Disclaimer: The opinions expressed by our writers are their own and do not represent the views of U.Today. The financial and market information provided on U.Today is intended for informational purposes only. U.Today is not liable for any financial losses incurred while trading cryptocurrencies. Conduct your own research by contacting financial experts before making any investment decisions. We believe that all content is accurate as of the date of publication, but certain offers mentioned may no longer be available.
XRP is stabilizing for once, but the longer-term outlook is for sure unstable. The price is holding above a newly formed support zone near $1.38 and is currently trading in the mid-$1.40 range. Although this base has been tested several times, indicating that buyers are regularly stepping in, the strength of that demand is still debatable.
XRP is full of possibilities
The short-term structure is now better. As is usually the first sign of a possible trend reversal, XRP has started to form slightly higher lows. Additionally, it has succeeded in surpassing short-term moving averages, suggesting a change in momentum. The asset is still trading below significant resistance levels, though, especially in the $1.50-$1.55 range, where rejections have previously taken place.
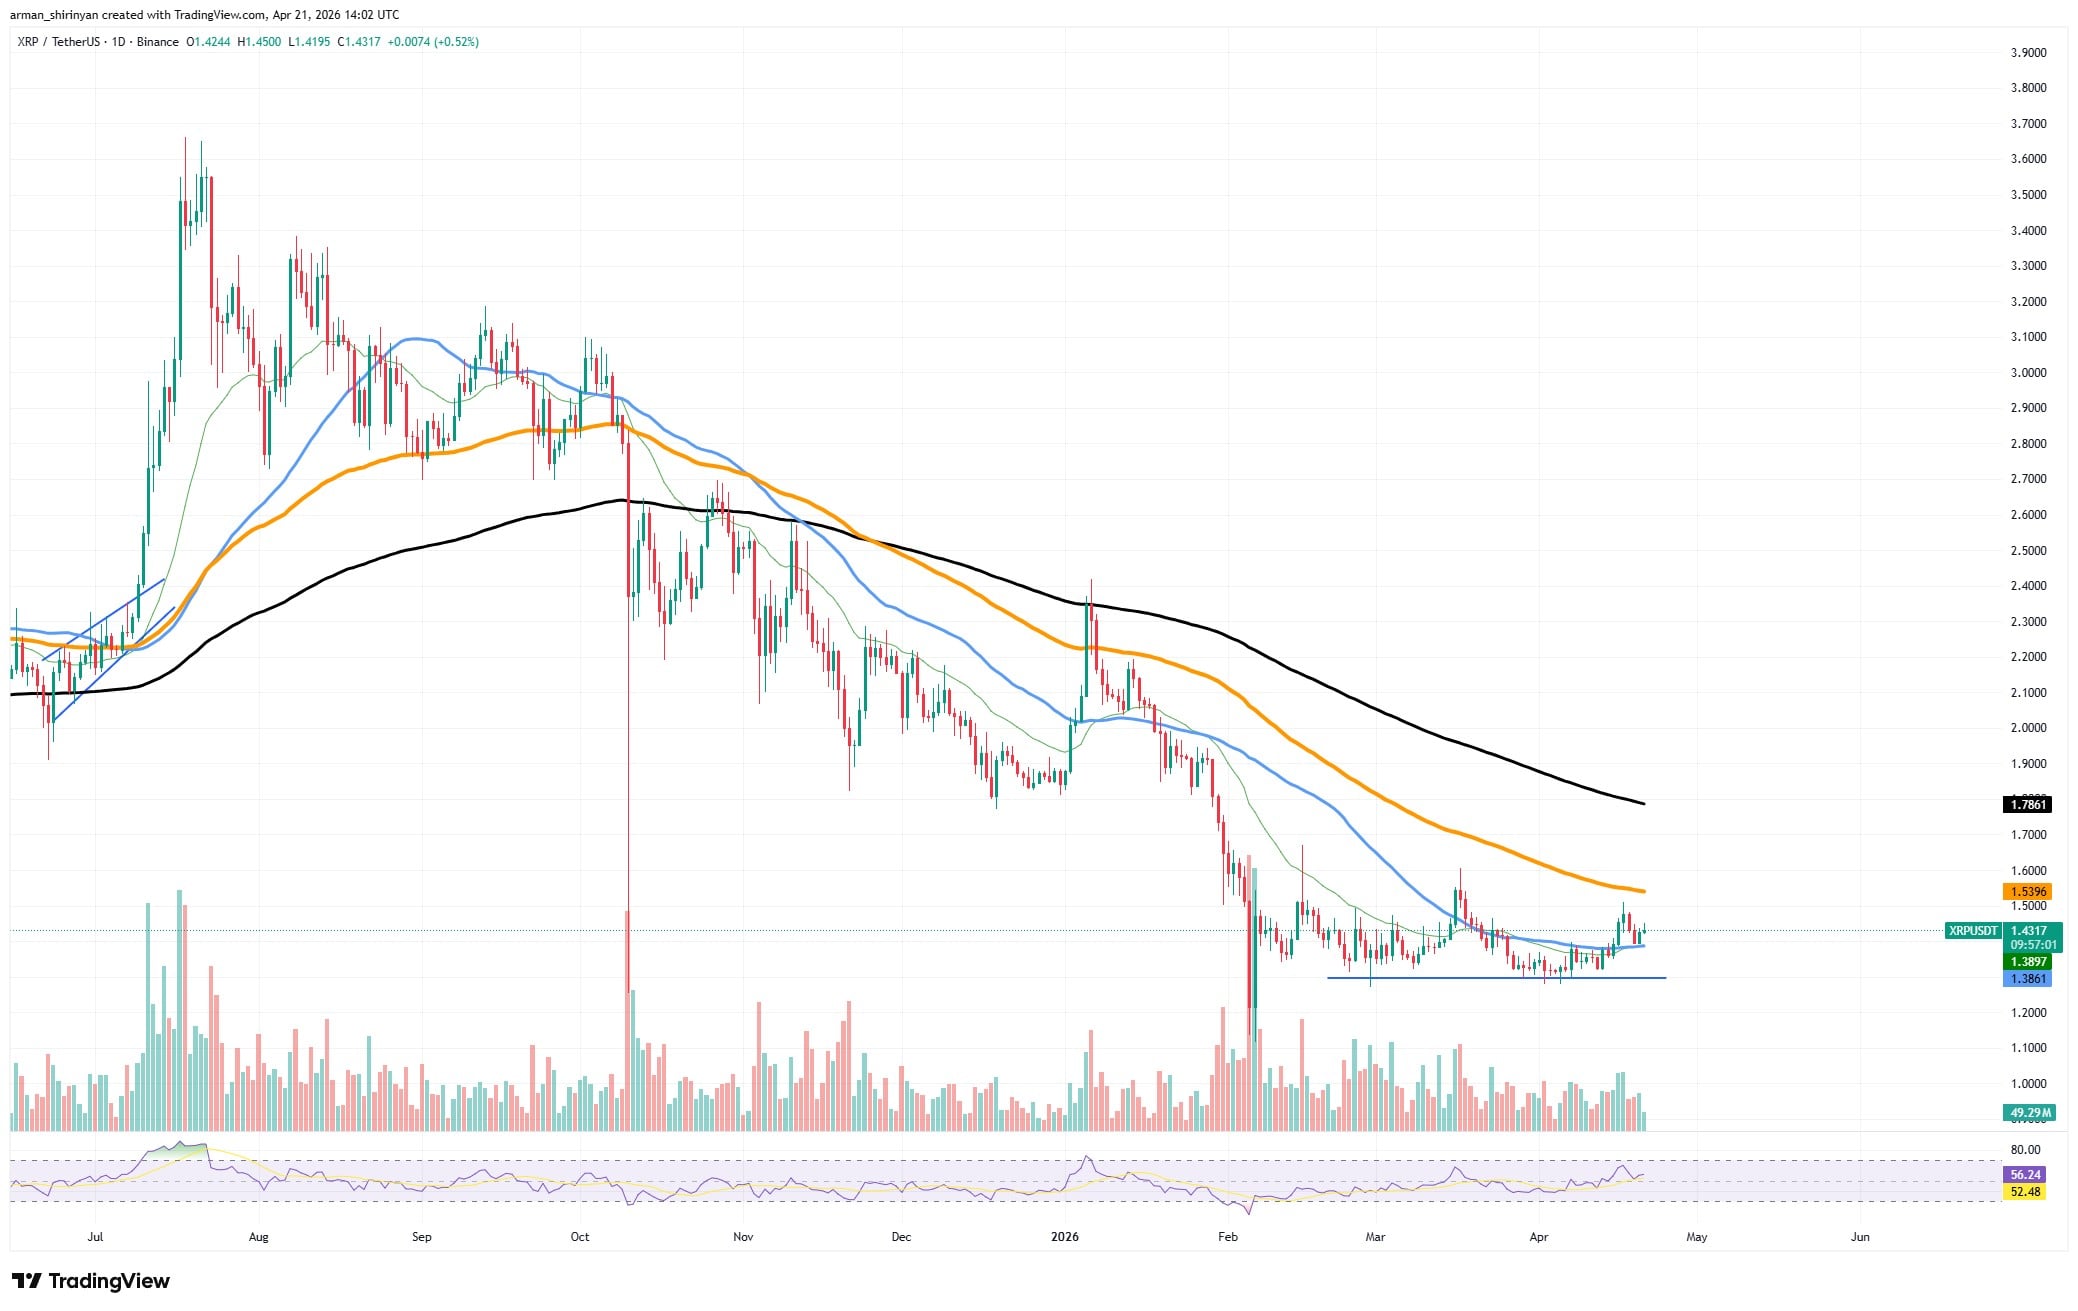
The next supply cluster is located in the $1.70 range, which could be reached if there is a clear breakout above it. In the absence of that breakout, XRP is still trapped in a range, and the current move runs the risk of becoming yet another lower high inside a larger bearish structure.
Right now, volume is the biggest issue. The upward move was supported by increased trading activity during the initial bounce, but lately, the volume has begun to decrease. This drop indicates that the recovery's momentum is waning. Price will find it harder to sustain a breakout attempt if volume keeps declining, because there won't be enough participation to withstand selling pressure at resistance.
Although moderate bullish momentum is reflected in the RSI's hovering above neutral, it cannot confirm a decisive move. This fits with the overall picture of a market that is stabilizing but not yet trending.
Bitcoin nearing the top
The technical fragility of Bitcoin's current trading structure raises questions about how long its recent rebound will last. Bitcoin has returned to the mid-$70,000s after rising from the mid-$60,000 area, but it is doing so in an unclean manner. Instead of a strong trend continuation, the market is forming overlapping patterns that suggest indecision and potential exhaustion.
A tightening triangle, where higher lows are compressing into a descending resistance line, is the most noticeable structure on the chart. Although the direction is uncertain, this kind of formation usually occurs before a breakout. The fact that this triangle is developing beneath significant moving averages, such as the 100-day and 200-day trends, which are still sloping downward, makes the current setup problematic.
Another pattern is subtly emerging at the same time. The structure may develop into a double top formation if Bitcoin is unable to break above the present resistance area around $76,000-$78,000. This region's previous peak serves as the first top, and the current effort to reclaim it could become the second.

Concern is increased by volume behavior. Although there was a lot of activity during the initial rebound, as the price gets closer to resistance, there has been less participation in recent sessions. This price-volume divergence frequently indicates waning conviction, which reduces the reliability of breakouts.
Additionally, momentum indicators are pointing in the direction of caution. RSI is rising toward higher levels, which raises the possibility of a brief decline if the price is unable to move significantly higher. Both situations should be anticipated by investors, but the risk profile is changing.
Strong volume and a verified breakout above resistance would refute the bearish patterns and allow for further gains. Failure to break through, though, might lead to a reversal that pushes Bitcoin back toward the support zones of $70,000 or even $67,000.
Hyperliquid won't stay still
The $40 mark is a crucial turning point for Hyperliquid, and the way the market is currently structured indicates that this area is not likely to remain a long-term equilibrium. After a significant upward push, the price has recently retreated from the mid-$40s, but the overall trend is still positive with higher lows clearly visible on the chart. Here, trend continuity is the most crucial element.
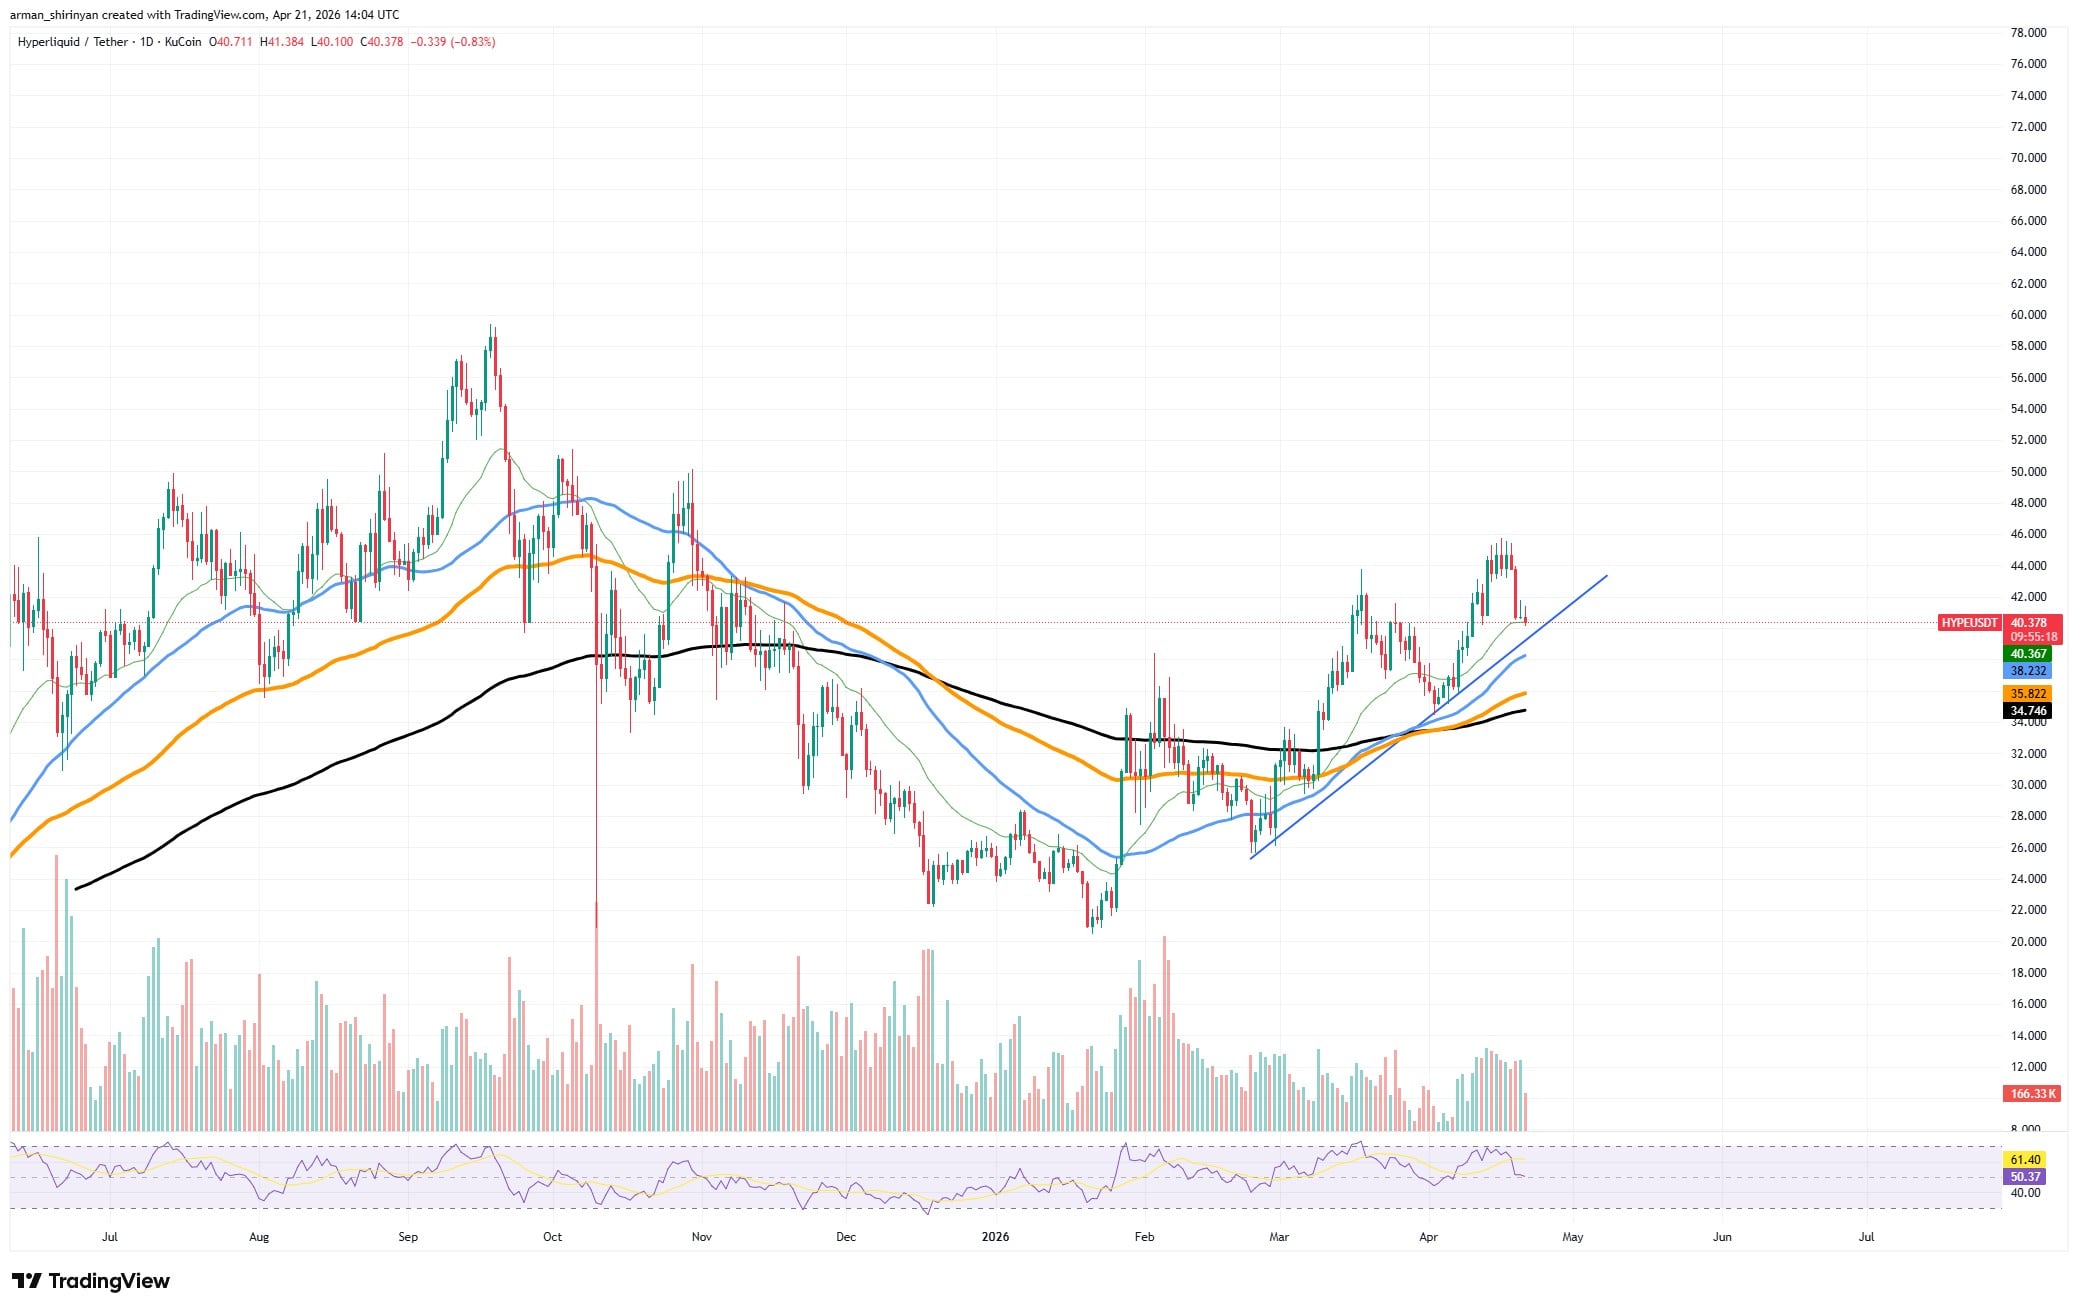
Since its local bottom earlier this year, HYPE has developed a rising structure on the chart that is backed by an ascending trendline. Price hasn't disrupted that structure despite the recent rejection near $45. Rather, it is consolidating slightly above the $40 area, which is currently serving as a short-term level of support rather than resistance. This is supported by moving averages.
Dynamic support is provided by short-term averages that are sloping upward and positioned below the current price. A change in broader momentum is frequently preceded by a flattening of the 100-day trend, which is not far below. The bias stays skewed upward as long as HYPE stays above these thresholds.

The recent decline is more likely a pause than a reversal because there hasn't been a notable increase in selling volume. Low-volume pullbacks are frequently used as continuation setups rather than breakdown signals in trending markets. After reaching high levels, momentum indicators are cooling off, which is a necessary reset for future gains.
The most important lesson is that $40 serves as a stage of transition rather than a final destination. A return to the $44-$46 range becomes more likely if buyers keep defending this area. If there was a break above that range, momentum would probably pick up speed and higher targets would become relevant.
 Dan Burgin
 U.Today Editorial Team