
Disclaimer: The opinions expressed by our writers are their own and do not represent the views of U.Today. The financial and market information provided on U.Today is intended for informational purposes only. U.Today is not liable for any financial losses incurred while trading cryptocurrencies. Conduct your own research by contacting financial experts before making any investment decisions. We believe that all content is accurate as of the date of publication, but certain offers mentioned may no longer be available.
After weeks of constant selling pressure, Shiba Inu may be beginning to show signs of life, but investors should exercise caution before declaring a trend reversal. According to the most recent daily candle, buyers are trying to protect the recent lows, which could lead to a local bounce setup.
Shiba Inu remains in downtrend
The crucial question is whether this grows into something more. SHIB has been caught in a strong downtrend for the past month. The asset is still trading below the 50-day, 100-day, and 200-day trend lines, among other major moving averages. This demonstrates that despite sporadic attempts at recovery, the overall market structure is still bearish. The behavior close to support is what makes the current situation intriguing.
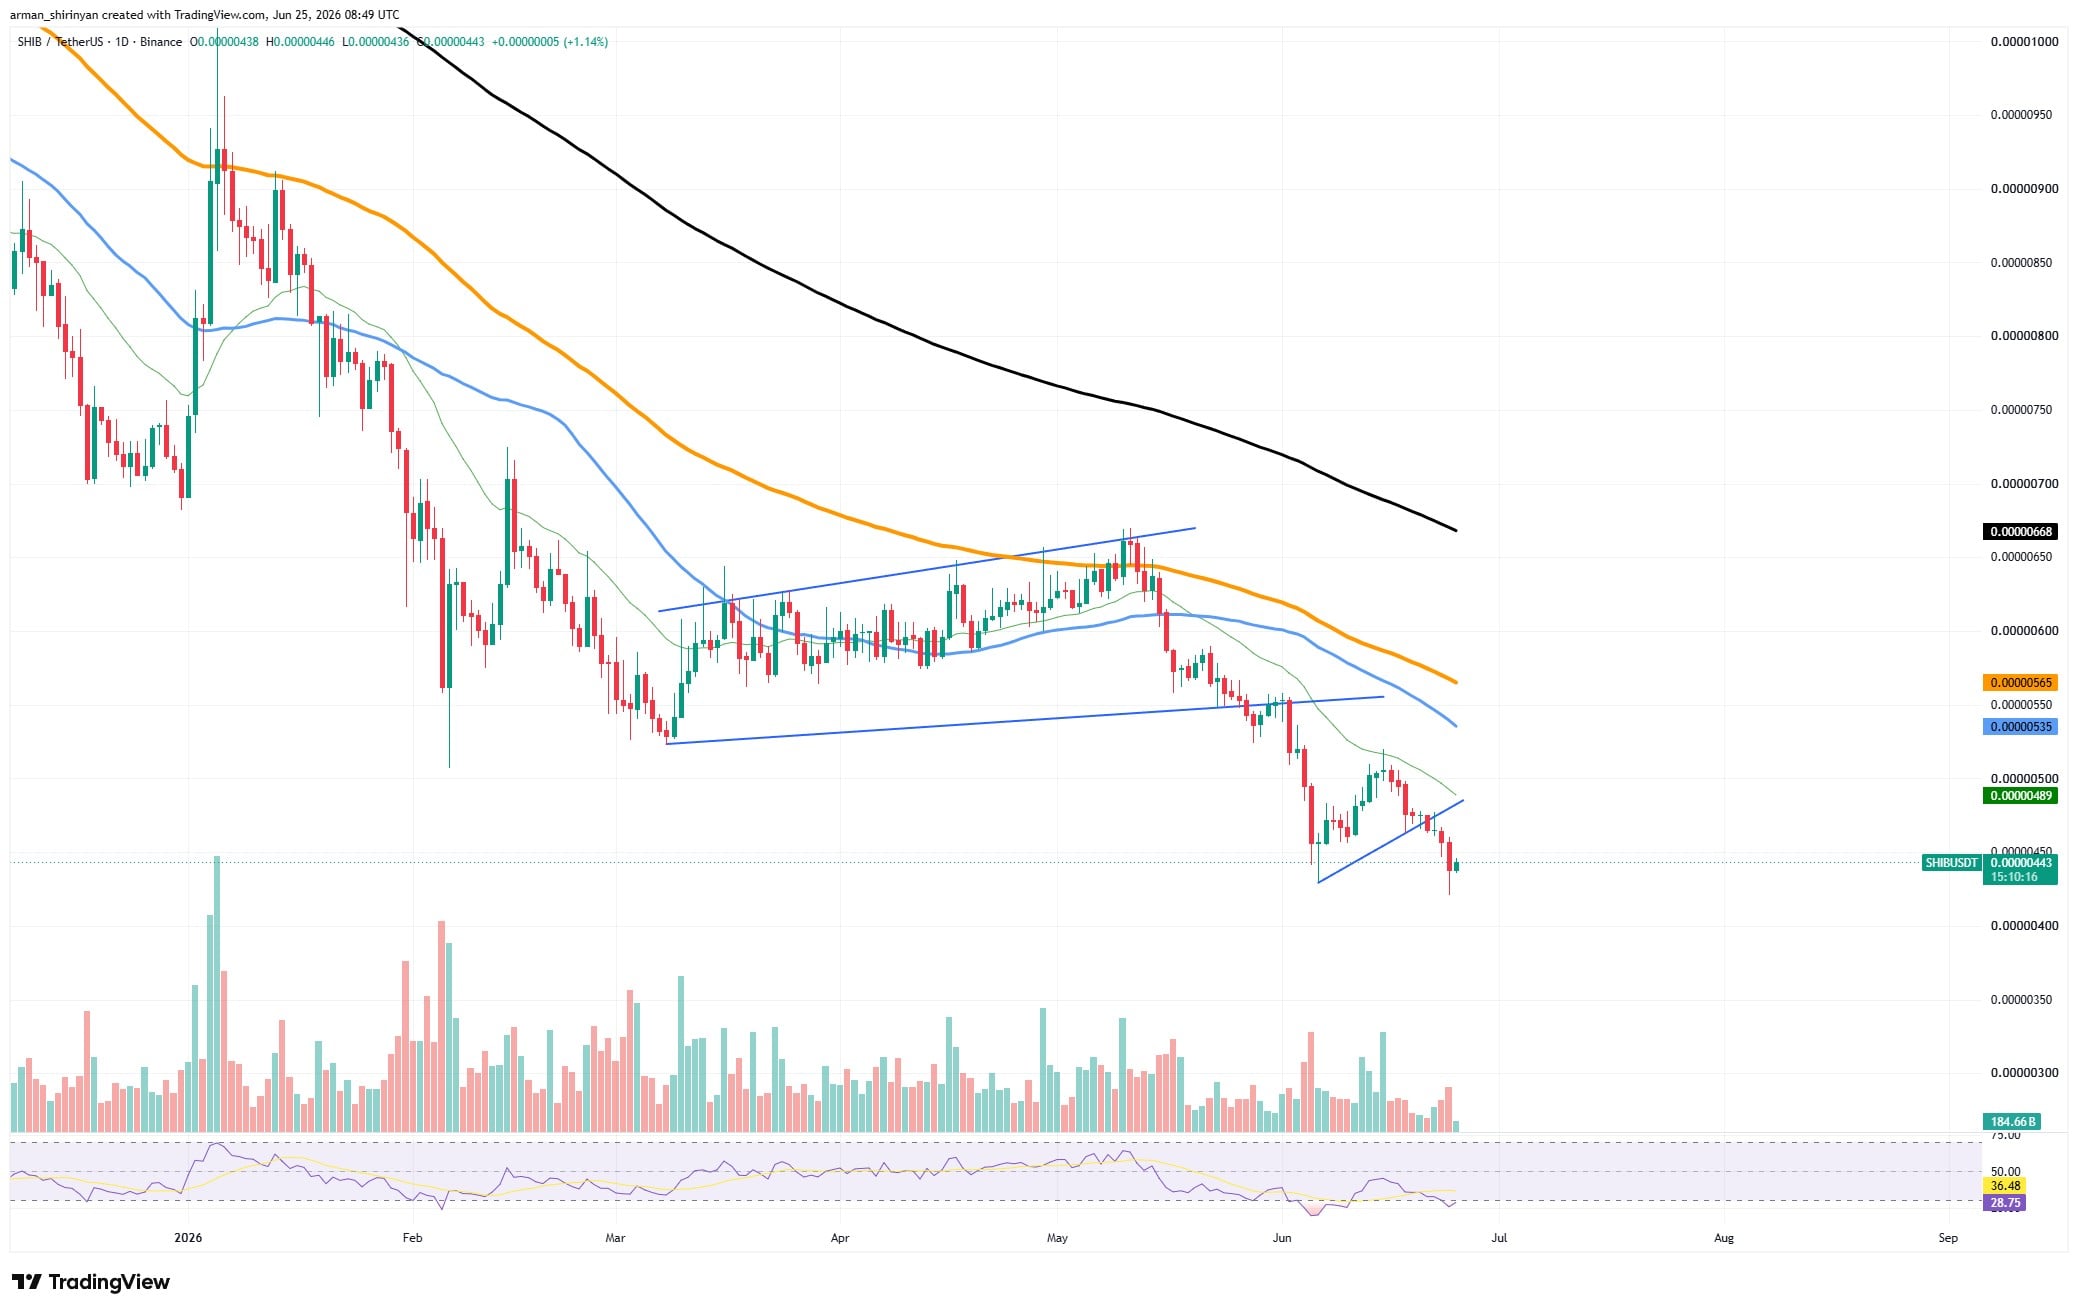
SHIB was able to draw in buyers and print a modest recovery candle after declining toward the $0.0000043–$0.0000044 range. It shows that sellers are no longer driving the asset lower with the same vigor as earlier in June, even though it is not a classic reversal signal. Additional context is provided by volume. Following the most recent breakdown, selling activity has gradually decreased, indicating that a sizable percentage of weak holders may have already sold their positions.

Before a long-term recovery can start, markets frequently need this kind of exhaustion. Additionally, the Relative Strength Index merits consideration. SHIB is getting close to levels where prior relief rallies have appeared, and the RSI is hovering near oversold territory. Extreme pessimism and a lack of momentum have historically produced favorable conditions for abrupt short-term recoveries. But there are still significant technical obstacles to overcome. The short-term moving average is currently located in the $0.0000049-$0.0000050 region, which is the closest resistance.
Resistances don't give up
The 50-day and 100-day moving averages, which continue to function as dynamic resistance zones, would still be a threat to SHIB above that. Transforming the current bounce candle into a series of higher lows and higher highs is the straightforward goal for bulls. A reversal cannot be produced by a single green candle.
Follow-through buying and the successful recovery of adjacent resistance levels are necessary for confirmation. Instead of a complete shift in trend, SHIB currently seems to be laying the groundwork for a possible relief rally. The market still needs evidence that buyers can maintain control, even though the bounce signal is present. Until then, rather than seeing the current recovery attempt as proof of a fresh bull run, traders should see it as an opportunity.
 U.Today Editorial Team
 Dan Burgin