Based on the Bitcoin code and launched in early 2014, Dash was initially known as XCoin and soon renamed to DarkCoin. In its early stages, it was mostly focused on privacy and anonymity, which led to the coin being used heavily for darknet market purchases. It was described as “the first privacy-centric cryptographic currency” by Evan Duffield and Daniel Diaz, the co-authors of the coin’s whitepaper, but is still struggling with popularity.
In more recent years Dash moved away from the privacy-centric model and has become an open source peer-to-peer cryptocurrency focused on the payments industry (just like everybody else). It aims to be money that is portable, fast, anonymous and inexpensive, providing instant transactions (through InstantSend) and private transactions (through PrivateSend). According to the official site, “Dash is Digital Cash you can spend anywhere”.
DASH/USD Price Analysis – The Big Picture
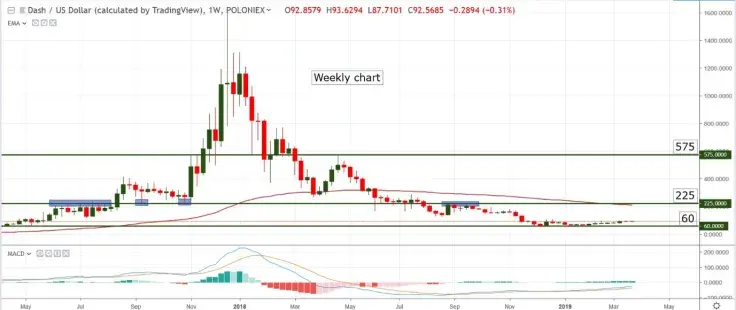
Similar to most other cryptocurrencies, Dash bottomed late last year and is now edging higher. It looks like the token could move higher but that depends on the market. Currently, it is trading at just $92 and is ranked number 15, with a circulating supply valued at $803,052,176.

The lines of the Moving Average Convergence Divergence (MACD) are moving tightly together and the histogram is barely visible which shows very little momentum for bulls or bears. This goes to show that interest for Dash is dwindling and that the coin may be entering an extended period of sideways price action. On the bright side, the MACD lines are crossed bullish and moving slowly upwards which is a sign of recovery. This may be an overly optimistic approach so take it with a grain of salt.
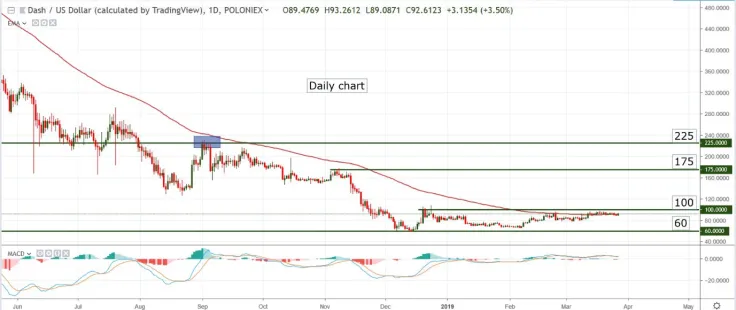
From a daily chart perspective, we can see the pair struggling to break the 100 days Exponential Moving Average and approaching the resistance at $100 (which is both a technical and psychological level). If the bulls can overcome the confluence zone created by 100 EMA and $100, then maybe we will see a stronger climb over the months to come. In my view, $175 is the next target followed by the more important level at $225 (this level acted as support and resistance in the past).

If the resistance zone cannot be broken decisively, we can expect price to drop back into the area around $60 in the coming months and possibly a resumption of the long-term downtrend if $60 support is broken.
Daily Chart Support: $60
Weekly Chart Support: $60 and all-round numbers below it
Daily Chart Resistance: 100 days EMA, $100, $175
Weekly Chart Resistance: $225, 100 weeks EMA, $575 (not expected to be reached in the next 6 months)
Most likely scenario: unless a clear bullish breakout occurs, we can expect downtrend resumption with a break of $60 support
Alternate scenario: a continued period of low volatility, minor upswings due to downtrend exhaustion and overall choppy price action
 Arman Shirinyan
 Alex Dovbnya
 Dan Burgin
 Denys Serhiichuk