For the last 24 hours, all cryptocurrencies in the top 20 by market cap have been posting gains, ranging from 5% to 12%. This is the first such occurrence since the massive sell off that begun almost half a month ago, so the obvious question must be asked: are we dealing with a corrective rally or a full-scale reversal?
While a definitive answer is almost impossible to give, the recent surge has revitalized the market and brought a shimmer of hope to an otherwise depressed crypto community.
Chart Analysis – ETH/USD

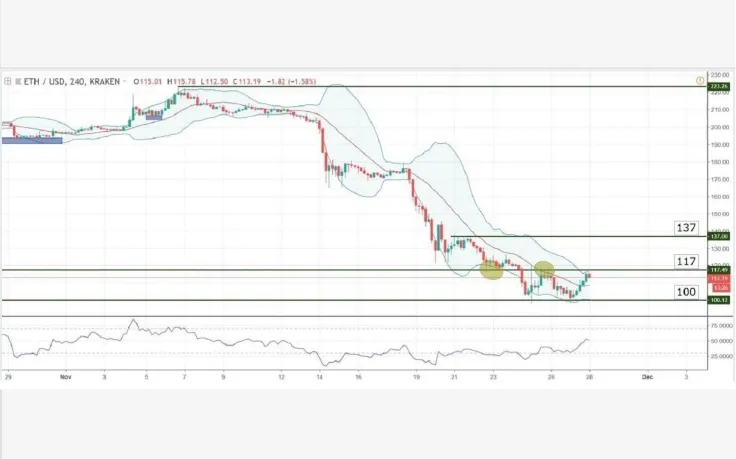
Ethereum is currently trading at $113 for an almost 10% gain over the last 24 hours, making it one of the best performing cryptocurrencies in the top 10 for said period. The rebound comes after a second failed attempt to break the $100 key handle, which created a double bottom pattern.
This type of chart formation is very bullish and can often be seen at the end of a downtrend, but before we can say that we are dealing with a full-scale reversal, the pair must create at least a higher high and a higher low. For that to happen, the pair must break the 117 mark, which acted as weak support in the past and then turned into resistance (last time it was touched, it rejected rising prices – see second circle on chart).
The Relative Strength Index is bullish without being overbought, and the Bollinger Bands are now moving sideways, which suggests that the strength of the downtrend is diminishing.
Support zone: 100
Resistance zone: 117 and the upper Bollinger Band
Most likely scenario: as long as 117 holds, we expect a drop towards 100
Alternative scenario: if 117 is broken, we expect a move towards 137
 Godfrey Benjamin
 Alex Dovbnya
 Denys Serhiichuk
 Tomiwabold Olajide
 Gamza Khanzadaev