
Disclaimer: The opinions expressed by our writers are their own and do not represent the views of U.Today. The financial and market information provided on U.Today is intended for informational purposes only. U.Today is not liable for any financial losses incurred while trading cryptocurrencies. Conduct your own research by contacting financial experts before making any investment decisions. We believe that all content is accurate as of the date of publication, but certain offers mentioned may no longer be available.
As the asset struggles to sustain momentum above the $1.50 mark, XRP is once again nearing a turning point in its current market cycle. The wider technical structure indicates that this support zone may soon be lost, possibly forcing the asset into a longer period of consolidation below this threshold, despite the price's recent attempt at a modest rebound.
Lack of conviction around XRP
XRP has been stuck in a steady decline over the last few months, marked by lower highs and waning momentum. The dominance of sellers on the market has been reinforced by key moving averages that have capped every recovery attempt.
Although buyers have recently succeeded in raising the price from local lows close to the $1.30 area, the recovery is still precarious and technically unfinished.
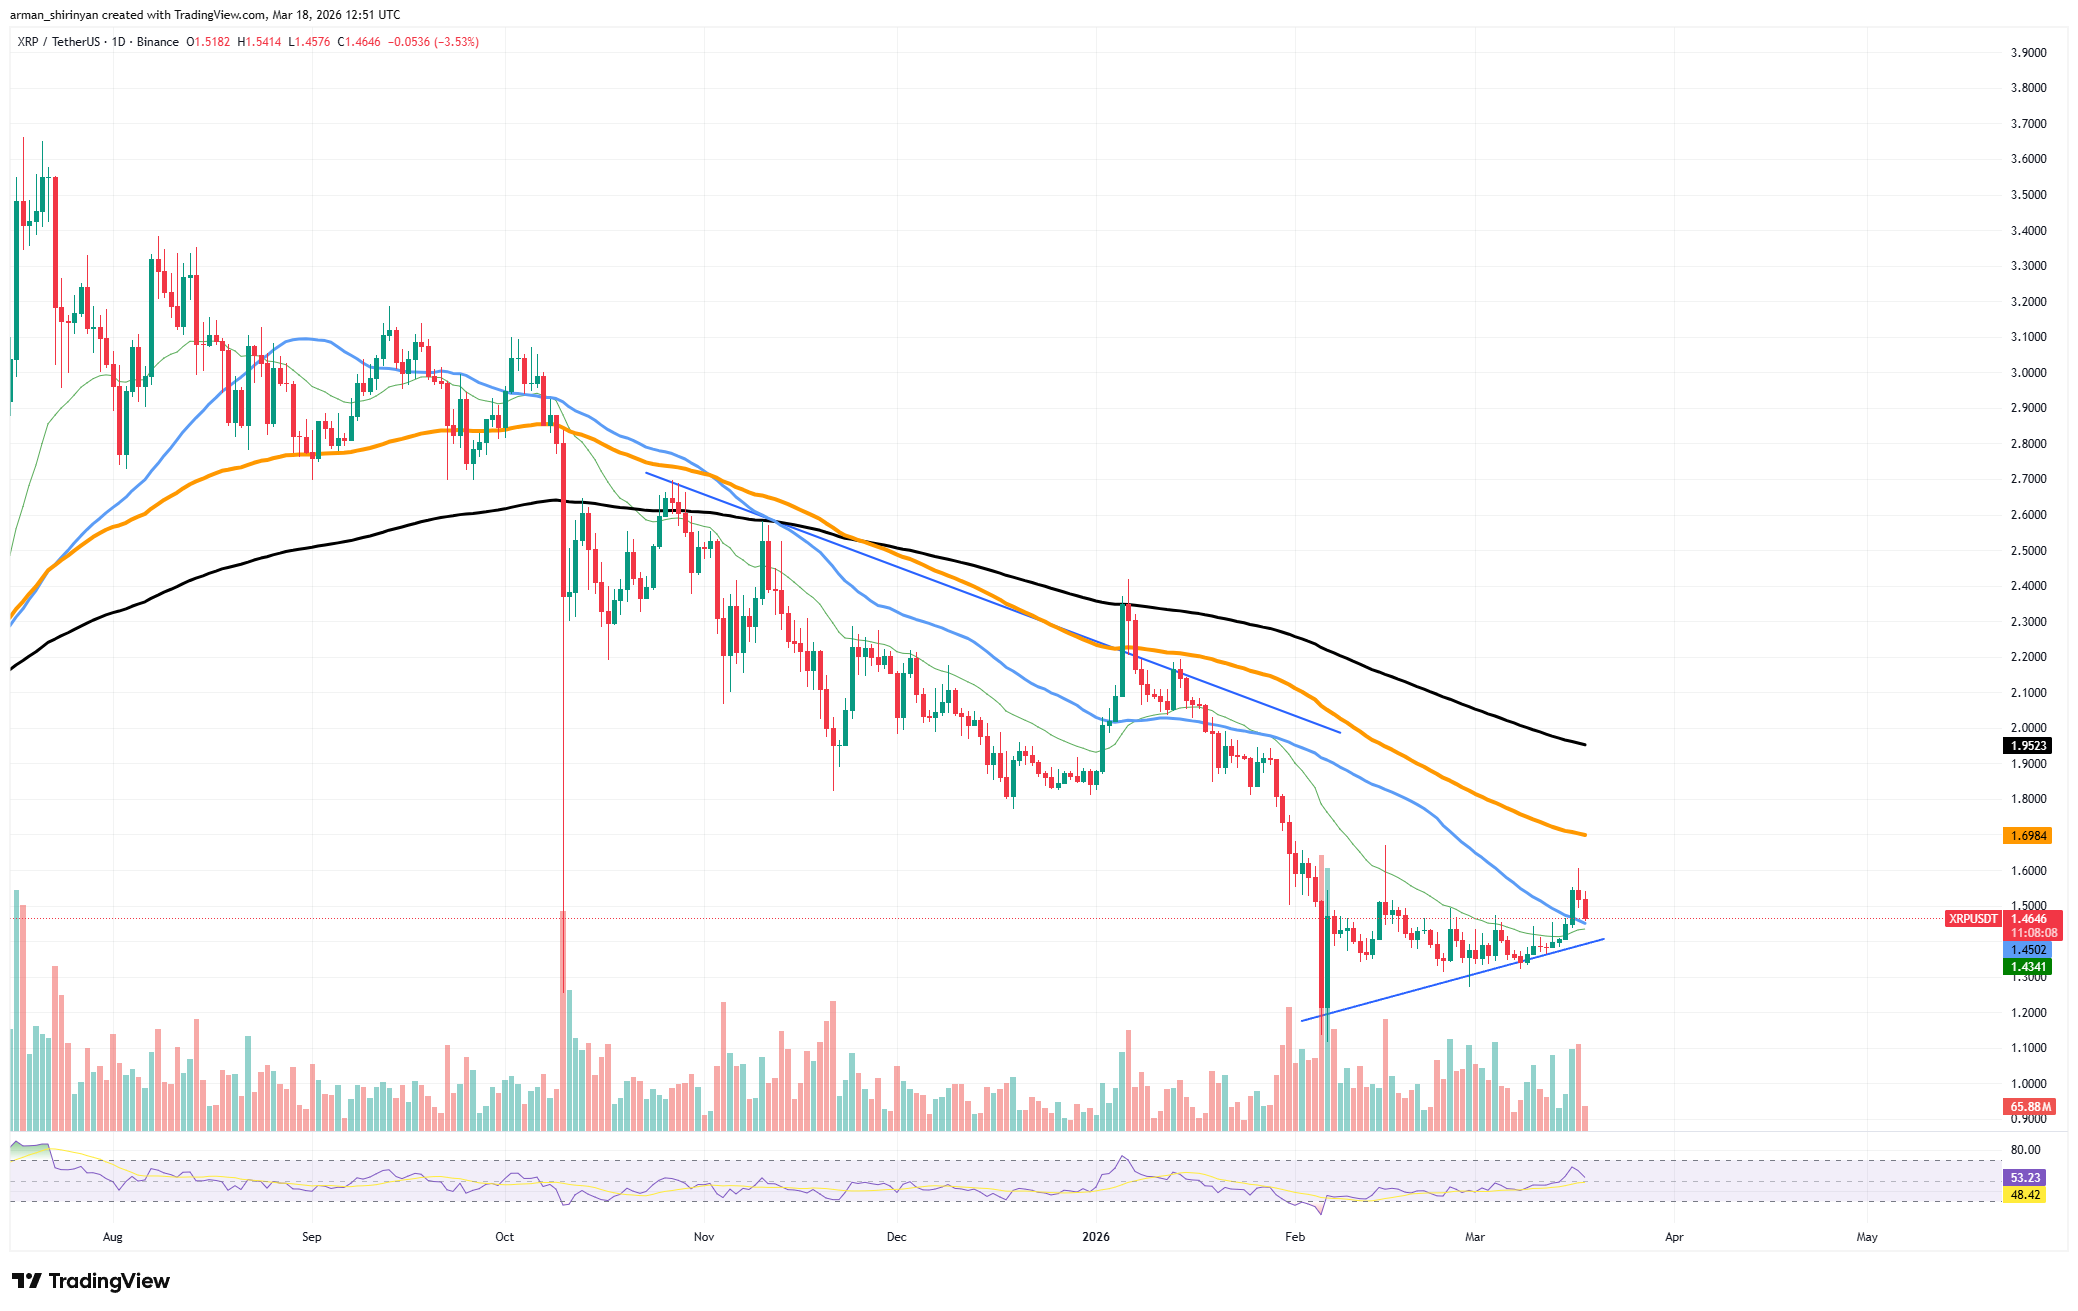
The $1.50 level, which has served as a short-term pivot point during recent trading sessions, is at the center of the current struggle. The price has not developed significant momentum above this zone, even though the market briefly reclaimed it.
The absence of consistent buying pressure raises the possibility that the market is not yet prepared to restore this level as solid support.
XRP may soon test, and possibly lose, the 50 EMA once more if it is unable to sustain its recent recovery structure. The short-term outlook would be seriously weakened by such a development.
A verified rejection at the 50 EMA would probably strengthen the general negative trend and raise the likelihood that XRP will fall below $1.50 once more. If this occurs, the level may move from short-term support into a far-off resistance zone that might take some time to recover.
Technically speaking, losing $1.50 would represent a significant structural and psychological setback. Long-term consolidation is frequently necessary for markets to recover lost levels, especially when broader trend indicators are still negative.
Ethereum's potential
A potential golden cross between the 26-day and 50-day exponential moving averages (EMAs) is a significant technical event that traders frequently keep a close eye on for Ethereum (ETH). Even though there has been persistent bearish pressure on the market for a number of months, recent price action indicates that momentum may be gradually changing.
Ethereum has recently started to form a recovery structure following a steep decline earlier this year that drove the price below several significant support levels. The asset is currently trading in the $2,200-$2,300 range after rising from lows close to the $2,000 area. Shorter-term moving averages have begun to converge as a result of this rebound, raising the prospect of a technical crossover.
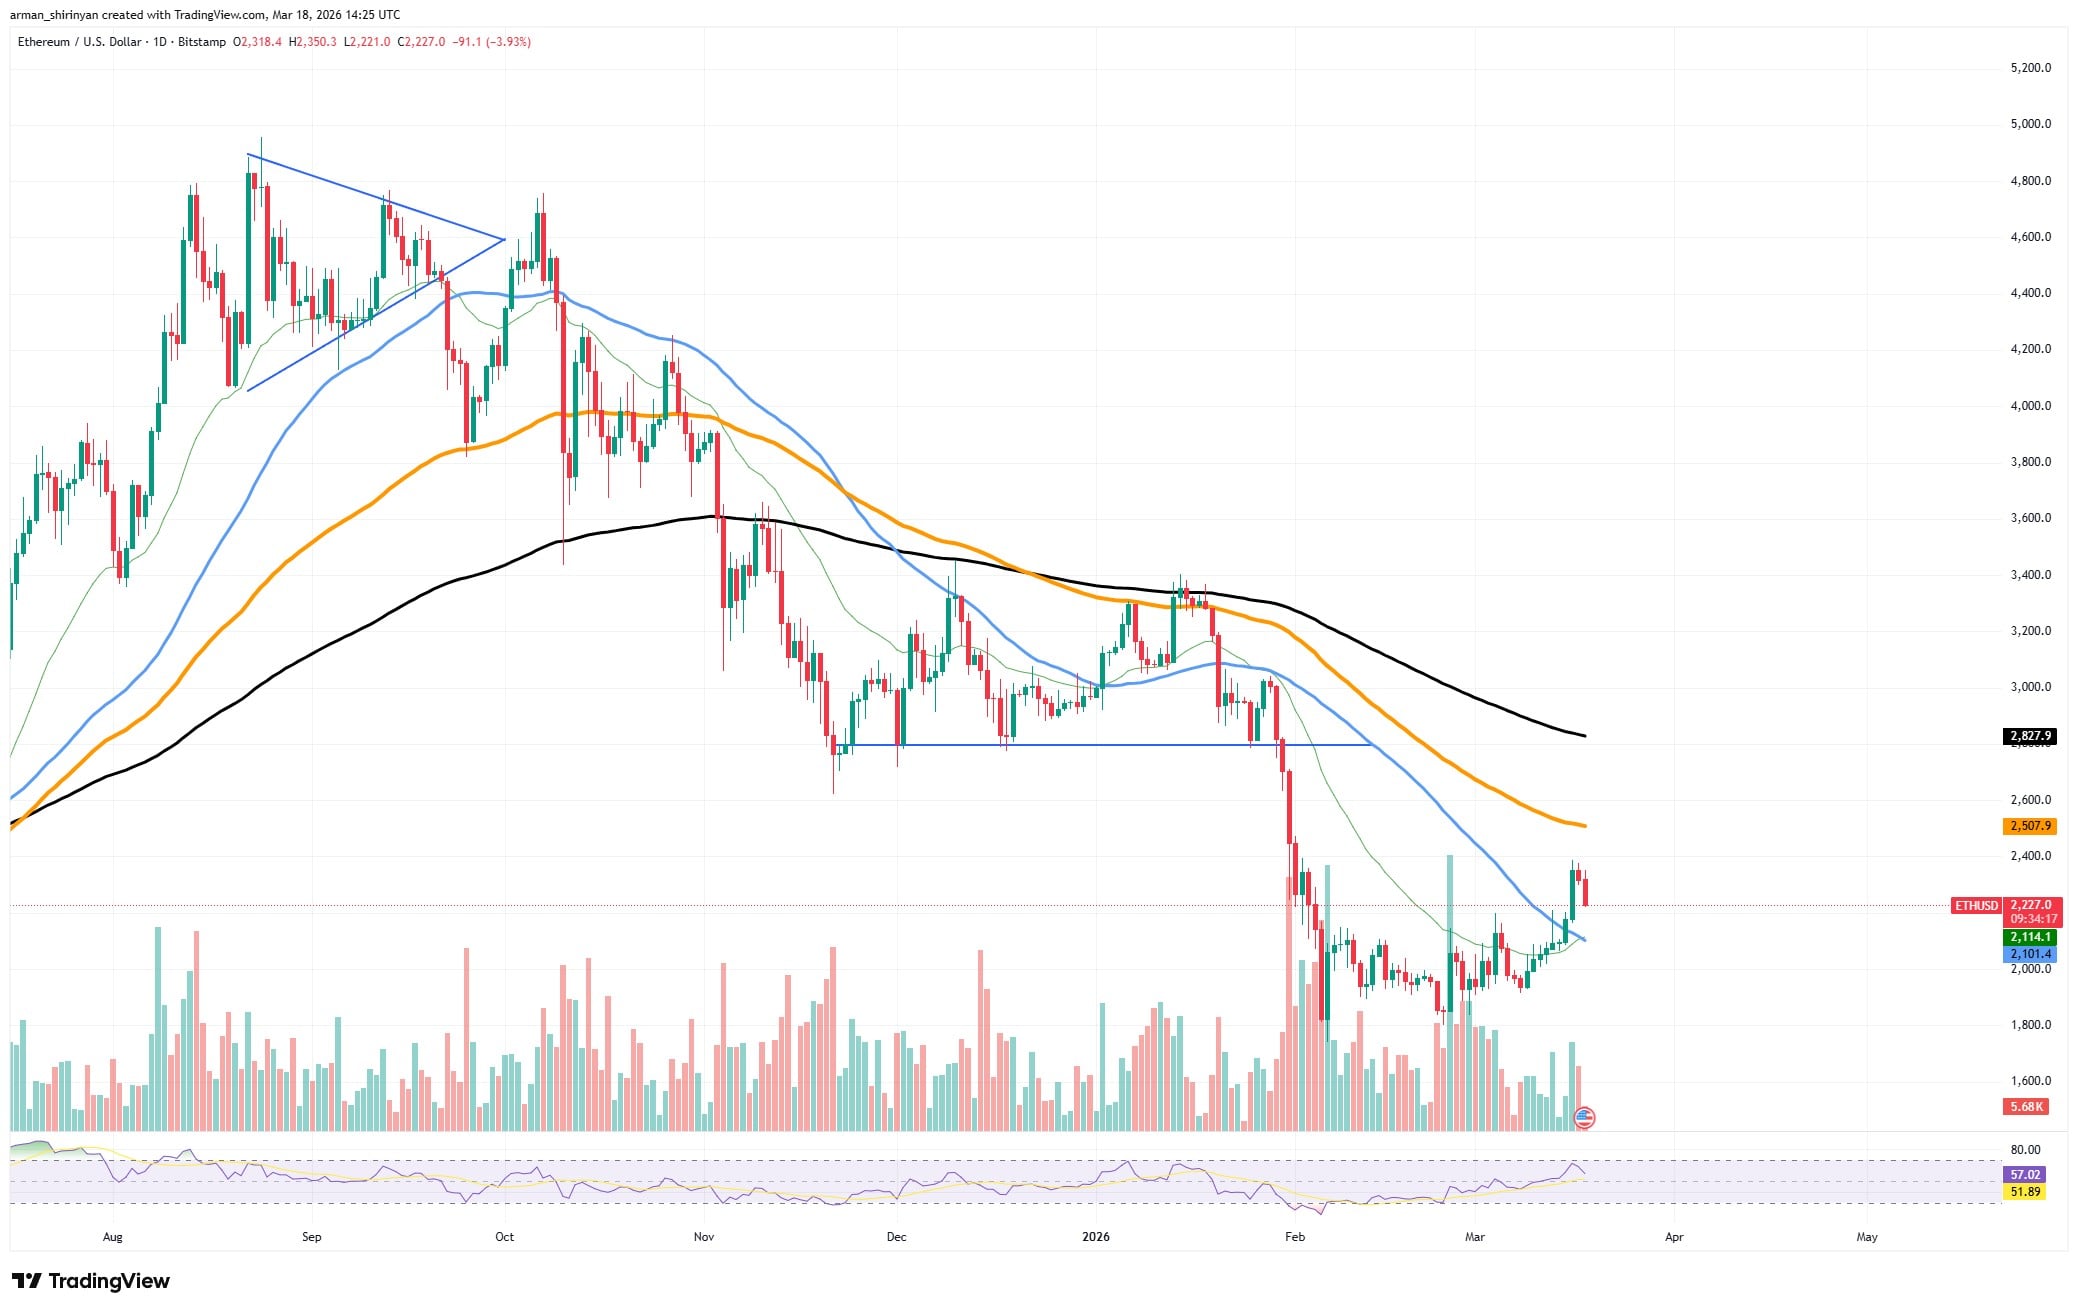
When a shorter-term moving average crosses above a longer-term one, it is known as a golden cross and indicates that recent price momentum is strengthening in relation to the overall trend. The 26-day EMA for Ethereum is rising and getting closer to the 50-day EMA, which has been serving as dynamic resistance during the current decline.
A change in short-term momentum, and the possibility that buyers are taking back control of the market, would be indicated if the 26 EMA were to successfully cross above the 50 EMA. Technical traders frequently take notice of such a crossover because it implies that recent price increases are significant enough to change the market’s trend structure.

A sustained rally is not, however, assured by a golden cross alone. Above the current price, Ethereum still faces a number of significant resistance levels. Higher moving averages, such as the 100-day and 200-day EMAs — which are still sloping downward and reflect the general bearish trend that has dominated the market in recent months — are still below the asset.
Ethereum would probably need to sustain its upward momentum and recover adjacent resistance zones in order for the potential golden cross to have a significant effect. Confirming that the crossover represents true market strength rather than a transient bounce would require strong volume and ongoing buying pressure.
Bitcoin loses momentum
As the market steadies following a steep decline earlier this year, Bitcoin is once again trying to regain momentum. Recent price action indicates that Bitcoin is not giving up on its attempt to return to the $80,000 range, even though the overall trend is still cautious.
The asset is currently constructing a short-term recovery structure that maintains the potential to test higher resistance levels after demonstrating resilience close to its recent lows.
Bitcoin saw a large sell-off that drove the price down toward the $65,000-$70,000 range after declining from levels above $95,000 during the previous cycle phase. Buyers started to intervene after that decline created a brief bottom, slowing the downward trend and laying the groundwork for a possible recovery.
$70,000 is a magnet
Bitcoin has been steadily returning to the mid-$70,000 range in recent sessions. Improved short-term momentum and a series of higher lows that point to increasing buying pressure have helped to support this recovery.
According to the current structure, traders are trying to regain their confidence following the previous decline.
The next significant technical and psychological turning point is currently the $80,000 level. In addition to potentially reopening the path toward higher price zones seen earlier in the cycle, regaining that level would be a significant step toward regaining bullish momentum.
Bitcoin has a number of challenges to overcome: the asset stays below important moving averages, such as medium-term trend indicators that frequently serve as resistance during recovery phases, that are still sloping downward. If buying pressure wanes, these levels might slow the current rally.
 U.Today Editorial Team
 Dan Burgin