Since Sunday, Jan. 20, $6 billion has been wiped from the cryptocurrency markets as Bitcoin is trading lower and dragging altcoins with it. The recent delay to Ethereum’s Constantinople hard fork brought further dismay and dragged the coin’s price lower, which also allowed Ripple’s XRP to widen the volume gap between the two digital assets.
Currently, there’s an almost $1 billion gap between XRP and ETH, with the former sitting at a 2nd place, just below Bitcoin and the latter occupying 3rd place, having dropped into technical support.
Chart Analysis – ETH/USD
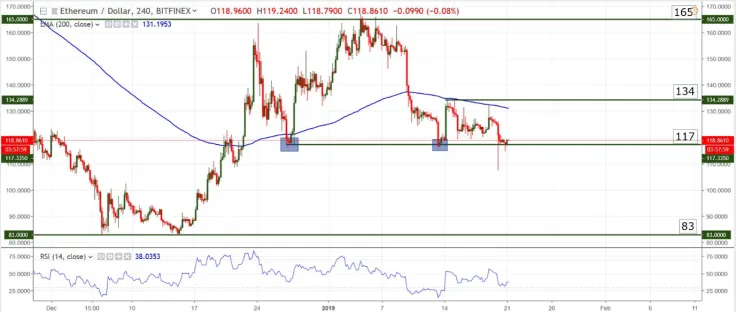
At the time of writing Ethereum was down more than 5% in the last 24 hours, trading around 117 against the US Dollar and testing a key technical support level. In recent past, the pair has hit 117 twice and each time, it was rejected higher with force. This successfully established a double bottom price pattern, which is, in essence, a bullish formation, even more so when it occurs at the (potential) bottom of a downtrend.

It is important to note that now price is testing said level for the third time, so it can create a triple bottom, which would be an even stronger indication that a move up will follow. As a side note, the spike below 117 (a red candle with long lower wick) is just a result of market inconsistencies because it is not present on most other exchanges apart from Bitfinex.
If the pair cannot form the triple bottom, hence meaning that we are dealing with a break of the double bottom, the outlook will become strongly bearish because usually, a break of a strong formation gives way to extended moves.
Support zone: 117 – 115, 100
Resistance zone: 200 EMA (4-hour charts) and 134
Most likely scenario: high-risk trading, unclear until a bounce or break is obvious
Alternate scenario: timid upside movement based on RSI showing bullish divergence
 Godfrey Benjamin
 Tomiwabold Olajide
 Arman Shirinyan
 Gamza Khanzadaev
 Yuri Molchan