
Disclaimer: The opinions expressed by our writers are their own and do not represent the views of U.Today. The financial and market information provided on U.Today is intended for informational purposes only. U.Today is not liable for any financial losses incurred while trading cryptocurrencies. Conduct your own research by contacting financial experts before making any investment decisions. We believe that all content is accurate as of the date of publication, but certain offers mentioned may no longer be available.
The Bitcoin market has resolved the trend debate - while at the beginning of the week bears tried to push the price down amid outflows from funds, the finale of the week of May 1-3, 2026 turned into both a technical and fundamental trap for short sellers.
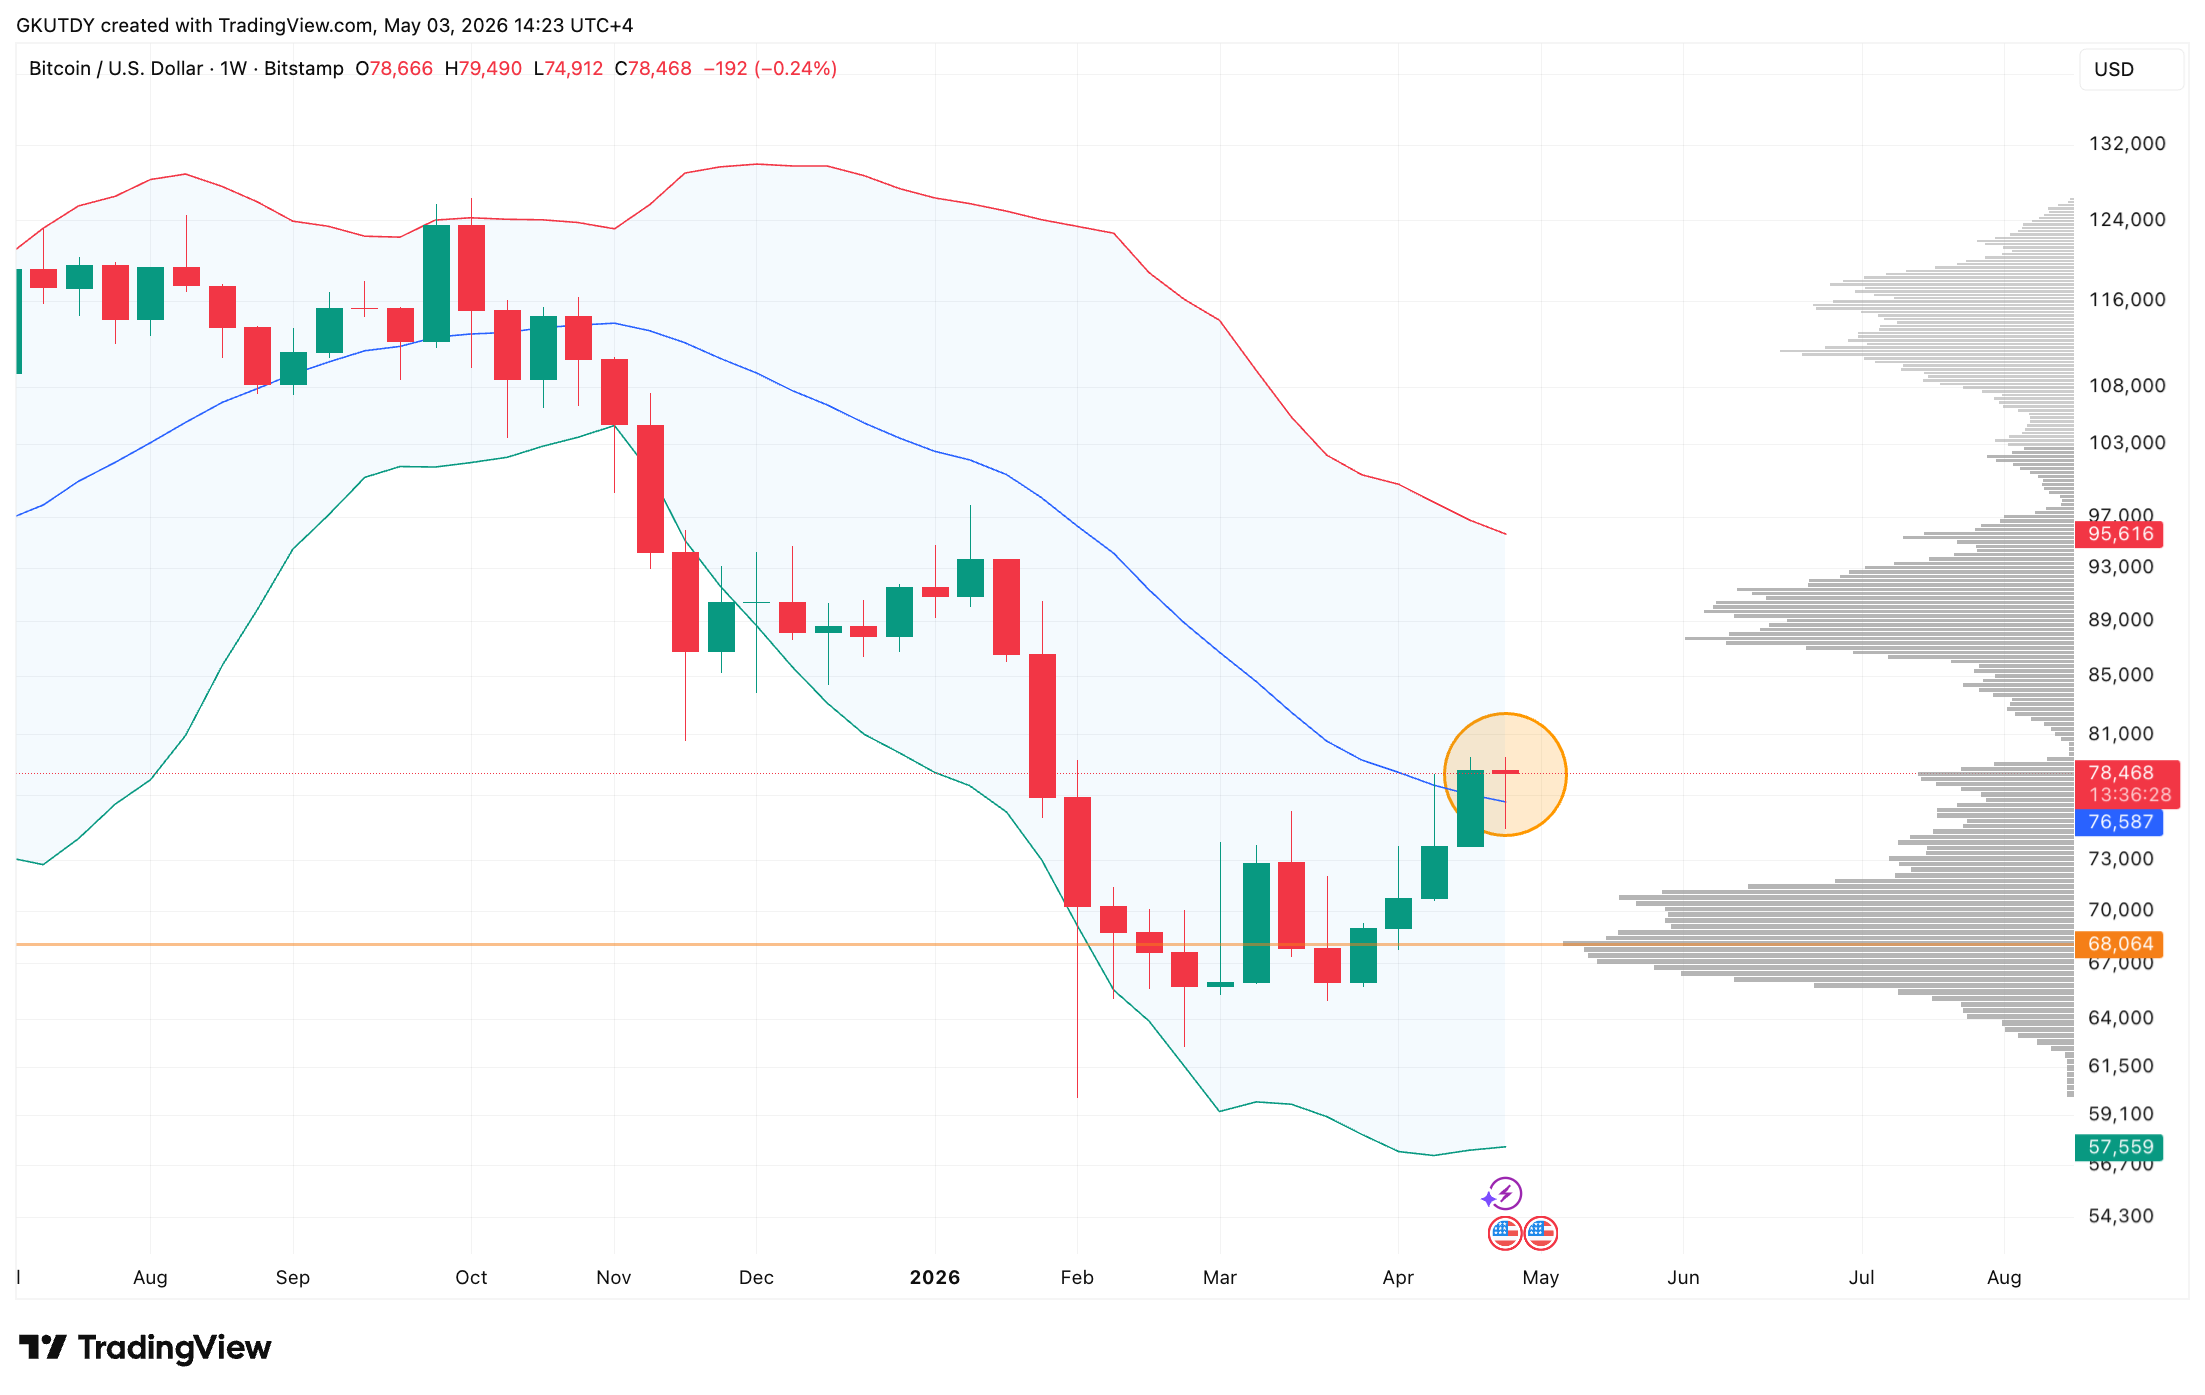
The main feature on the chart is a weekly candle with a long lower wick, which at the time of writing is precisely closing above the middle Bollinger Band at $76,589 as displayed by TradingView.
The price did not just break above this level, but retraced, tested the zone below mid-band for demand, and bounced. Such a wick is the footprint of an aggressive buyer - while retail participants hesitated, "smart money" used the local dip to add to positions.
$630 million ETF inflow triggers major Bitcoin bear trap
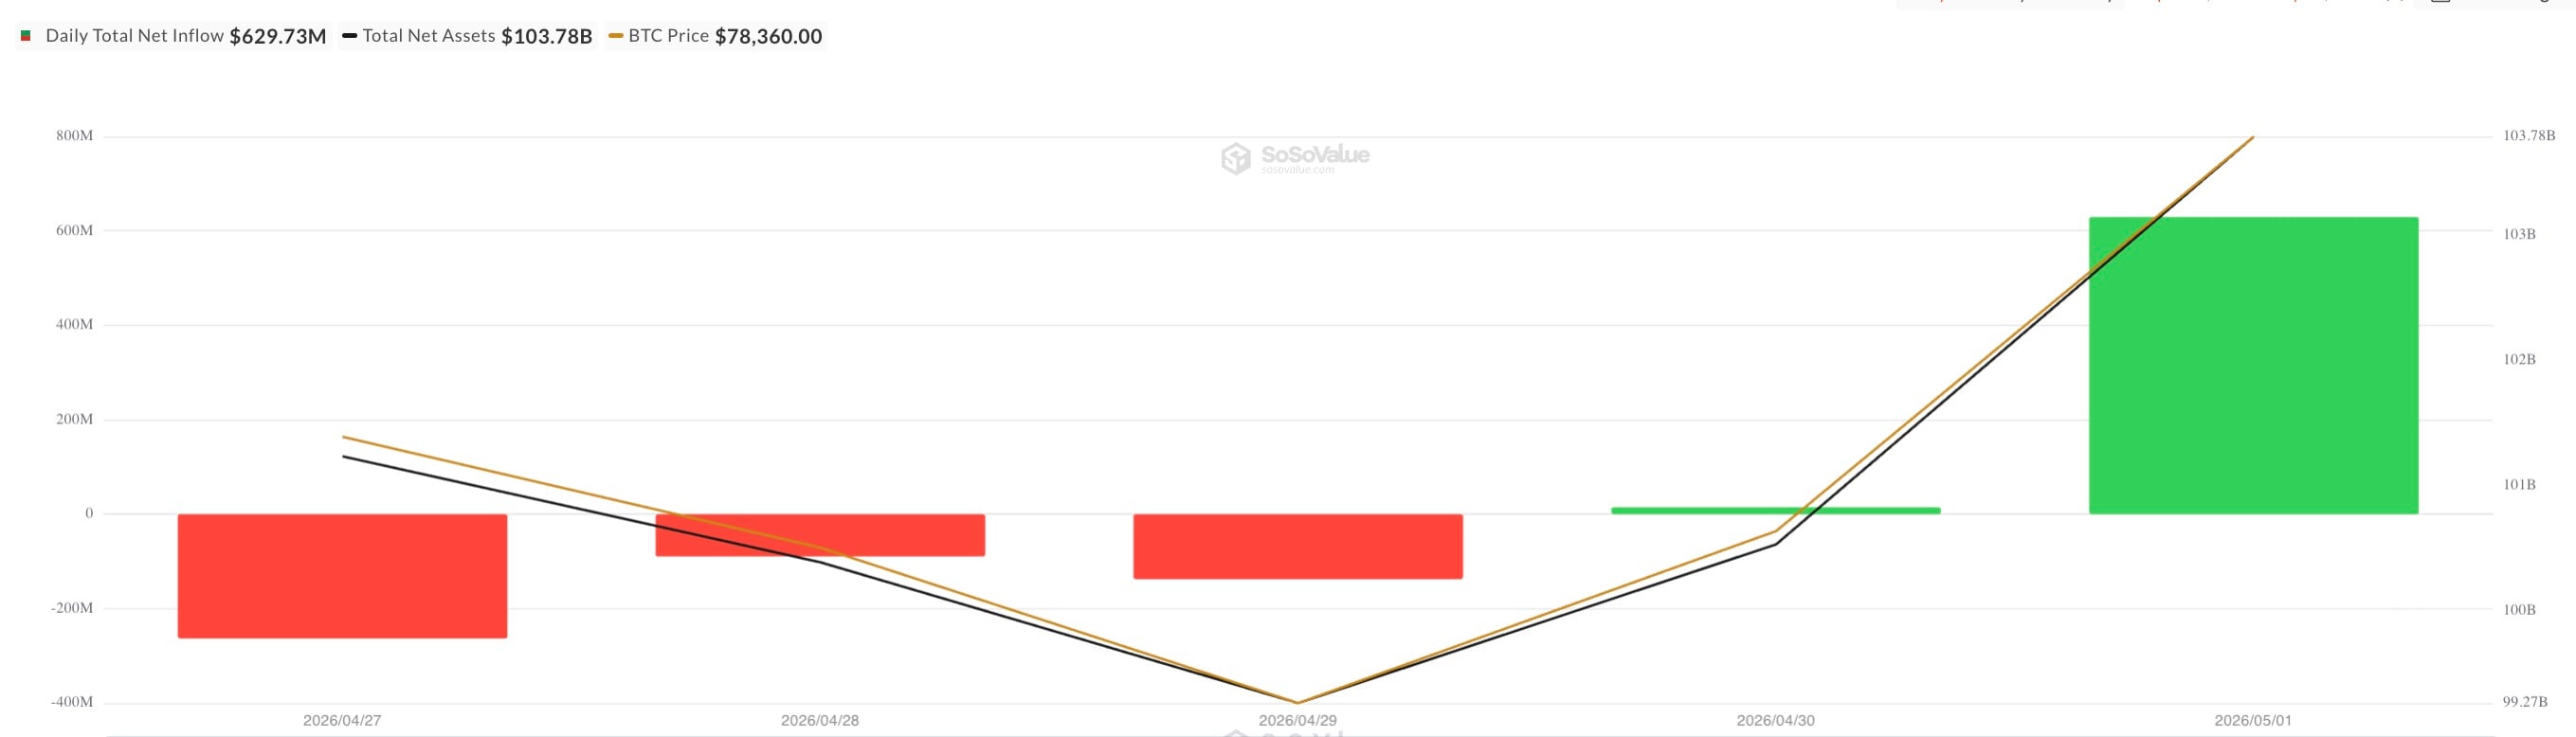
Data on US spot Bitcoin ETFs over the week explains why the bearish pressure failed. After three days of outflows from April 27 to 29, when the market lost nearly $500 million, a turning point occurred.
In just one trading day on May 1, ETFs saw $629.73 million in net inflows, according to SoSoValue. This massive inflow fully offset the weekly negative and became the "fuel" that pulled the candle's wick upward.

When a technical pattern - a pin bar above the middle Bollinger Band - is confirmed by such inflows of real money, the probability of continued growth becomes elevated as the candle's wick shows that strong demand for Bitcoin sits below $76,500. From a volatility perspective, consolidation above the center of the Bollinger Bands opens the path to the upper boundary of the channel, located at $95,600.
For bears, there is currently nothing to build their case on. The combination of a bullish weekly close and the return of aggressive ETF buying makes a move toward $95,600 the base scenario for May 2026.
 Dan Burgin
 U.Today Editorial Team