*** Please note the analysis below is not investment advice. The views and opinions expressed here are solely those of the author and do not necessarily reflect the views of U.Today. Every investment and trading move involves risk, you should conduct your own research when making a decision.
Bitcoin testing the curve support
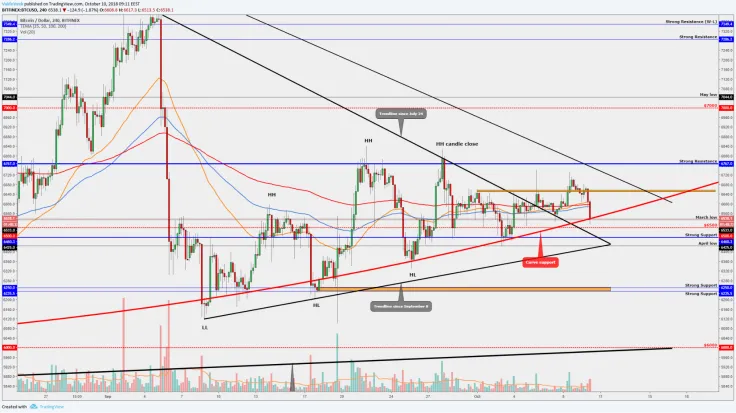
Yesterday's price range was pretty small. The price was above the orange area (an important level) and below it.

Currently, the price makes moves and it has broken below the all-important EMA’s, it has reached the curve support line and the March low level which also should start to work as a support. The Fibonacci golden ratio retracement level at 62 percent will indicate if we get a bigger or a smaller bounce upwards.
If we get a candle close below the mentioned levels, it would be the first sign of the bullish momentum gone. Our next major supports are the round number $6,500 and the strong support area at $6,460.
At the moment, altcoins also take this little hit but nothing remarkable. Watch those levels (curve support, round number, and the blue line as a strong support) and if the price breaks below then definitely stay out and wait for some better opportunities to enter again.
LITECOIN (LTC/USD) Breaks Below The Minor Trendline
Currently, the market takes some hit and so do altcoins.

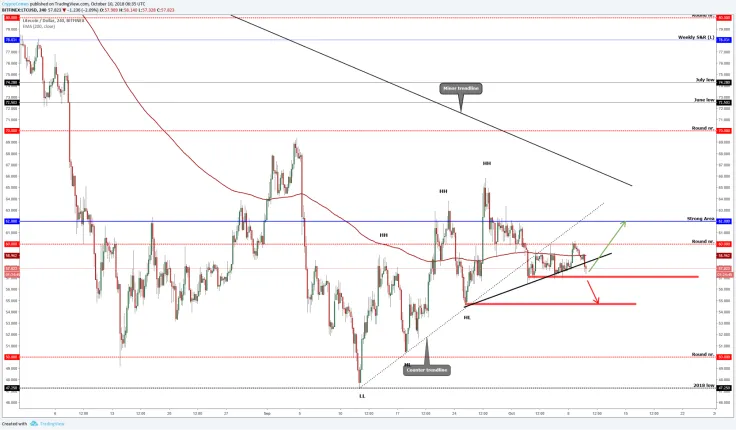
Currently, Litecoin has made a break below the minor trendline which will indicate that the red box below the price around $57 should start to work as a support. If this level doesn’t hold and if BTC drops even more, then we could see a break below the red support area and the price approaching the next support level at $55, and that would be an important level. In this case, the price structure may change. This area is the last HL (higher low) formation area and if it breaks, bad things can happen.
At the moment, BTC is on the very important area and if it gets a bounce upwards, LTC will have a good opportunity to follow this move and the targets will be on the next round number at $60 and the strong resistance at $62. So, watch closely what Bitcoin does.
MONERO (XMR/USD) - It Looks Bad
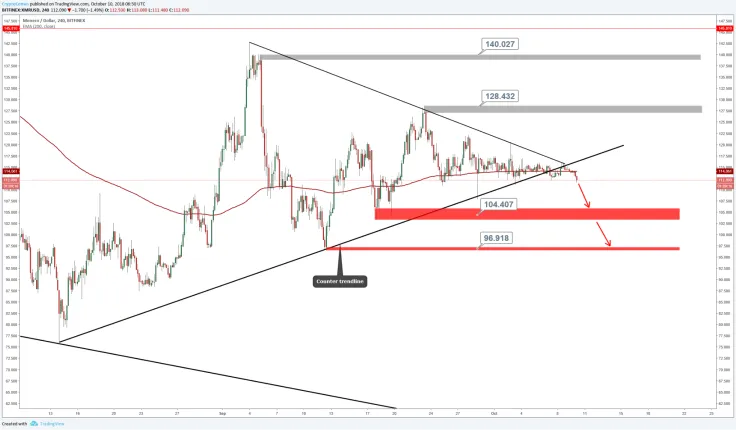
Monero has a break below the major counter trendline which is not a good sign! On the four-hour chart, it trades below the 200 EMA and it makes pretty ‘heavy’ steps downwards compared to others.

Technically, if Bitcoin makes another leg downwards, XMR would drop like a stone because there are some support levels but nothing significant until the red box at $104.
Basically, we have a breakout from the triangle, break below the EMA's plus Bitcoin making moves downwards, so better stay out from Monero because if it drops, it drops pretty heavily. The market has to make a pretty big turn upwards then we could come back and watch it again but currently, stay away.
 Vladislav Sopov
 Dan Burgin