Disclaimer: The opinions expressed by our writers are their own and do not represent the views of U.Today. The financial and market information provided on U.Today is intended for informational purposes only. U.Today is not liable for any financial losses incurred while trading cryptocurrencies. Conduct your own research by contacting financial experts before making any investment decisions. We believe that all content is accurate as of the date of publication, but certain offers mentioned may no longer be available.
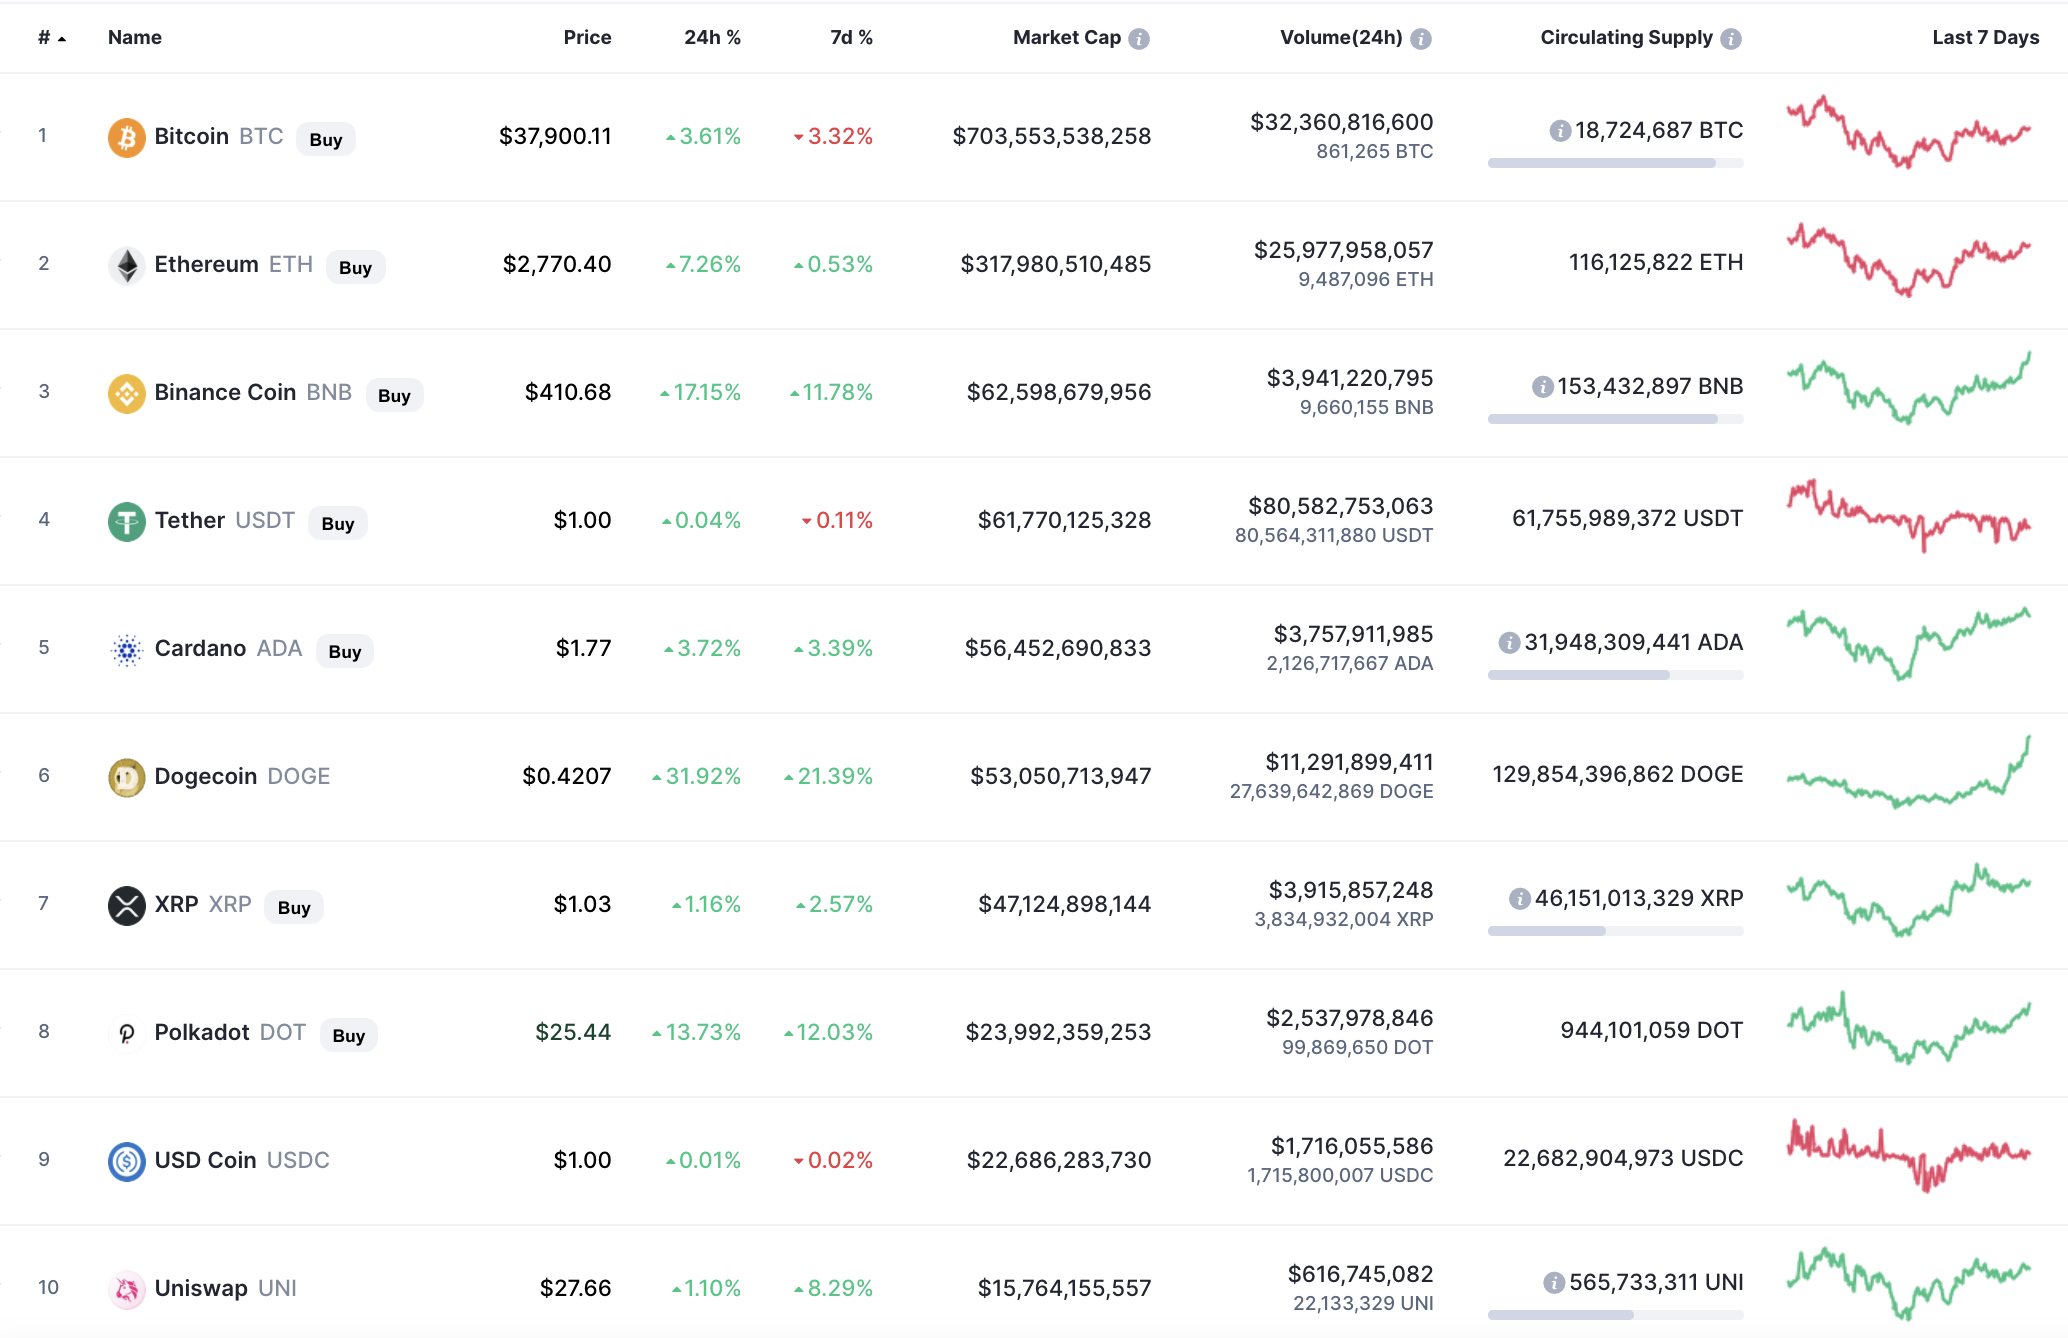
The cryptocurrency market may have left the correction as all of the top 10 coins have grown over the last day.
BTC/USD
Bitcoin (BTC) has accumulated enough power in the area of $36,000 to fix above $37,000. The rise over the last day adds up to 4.41%.
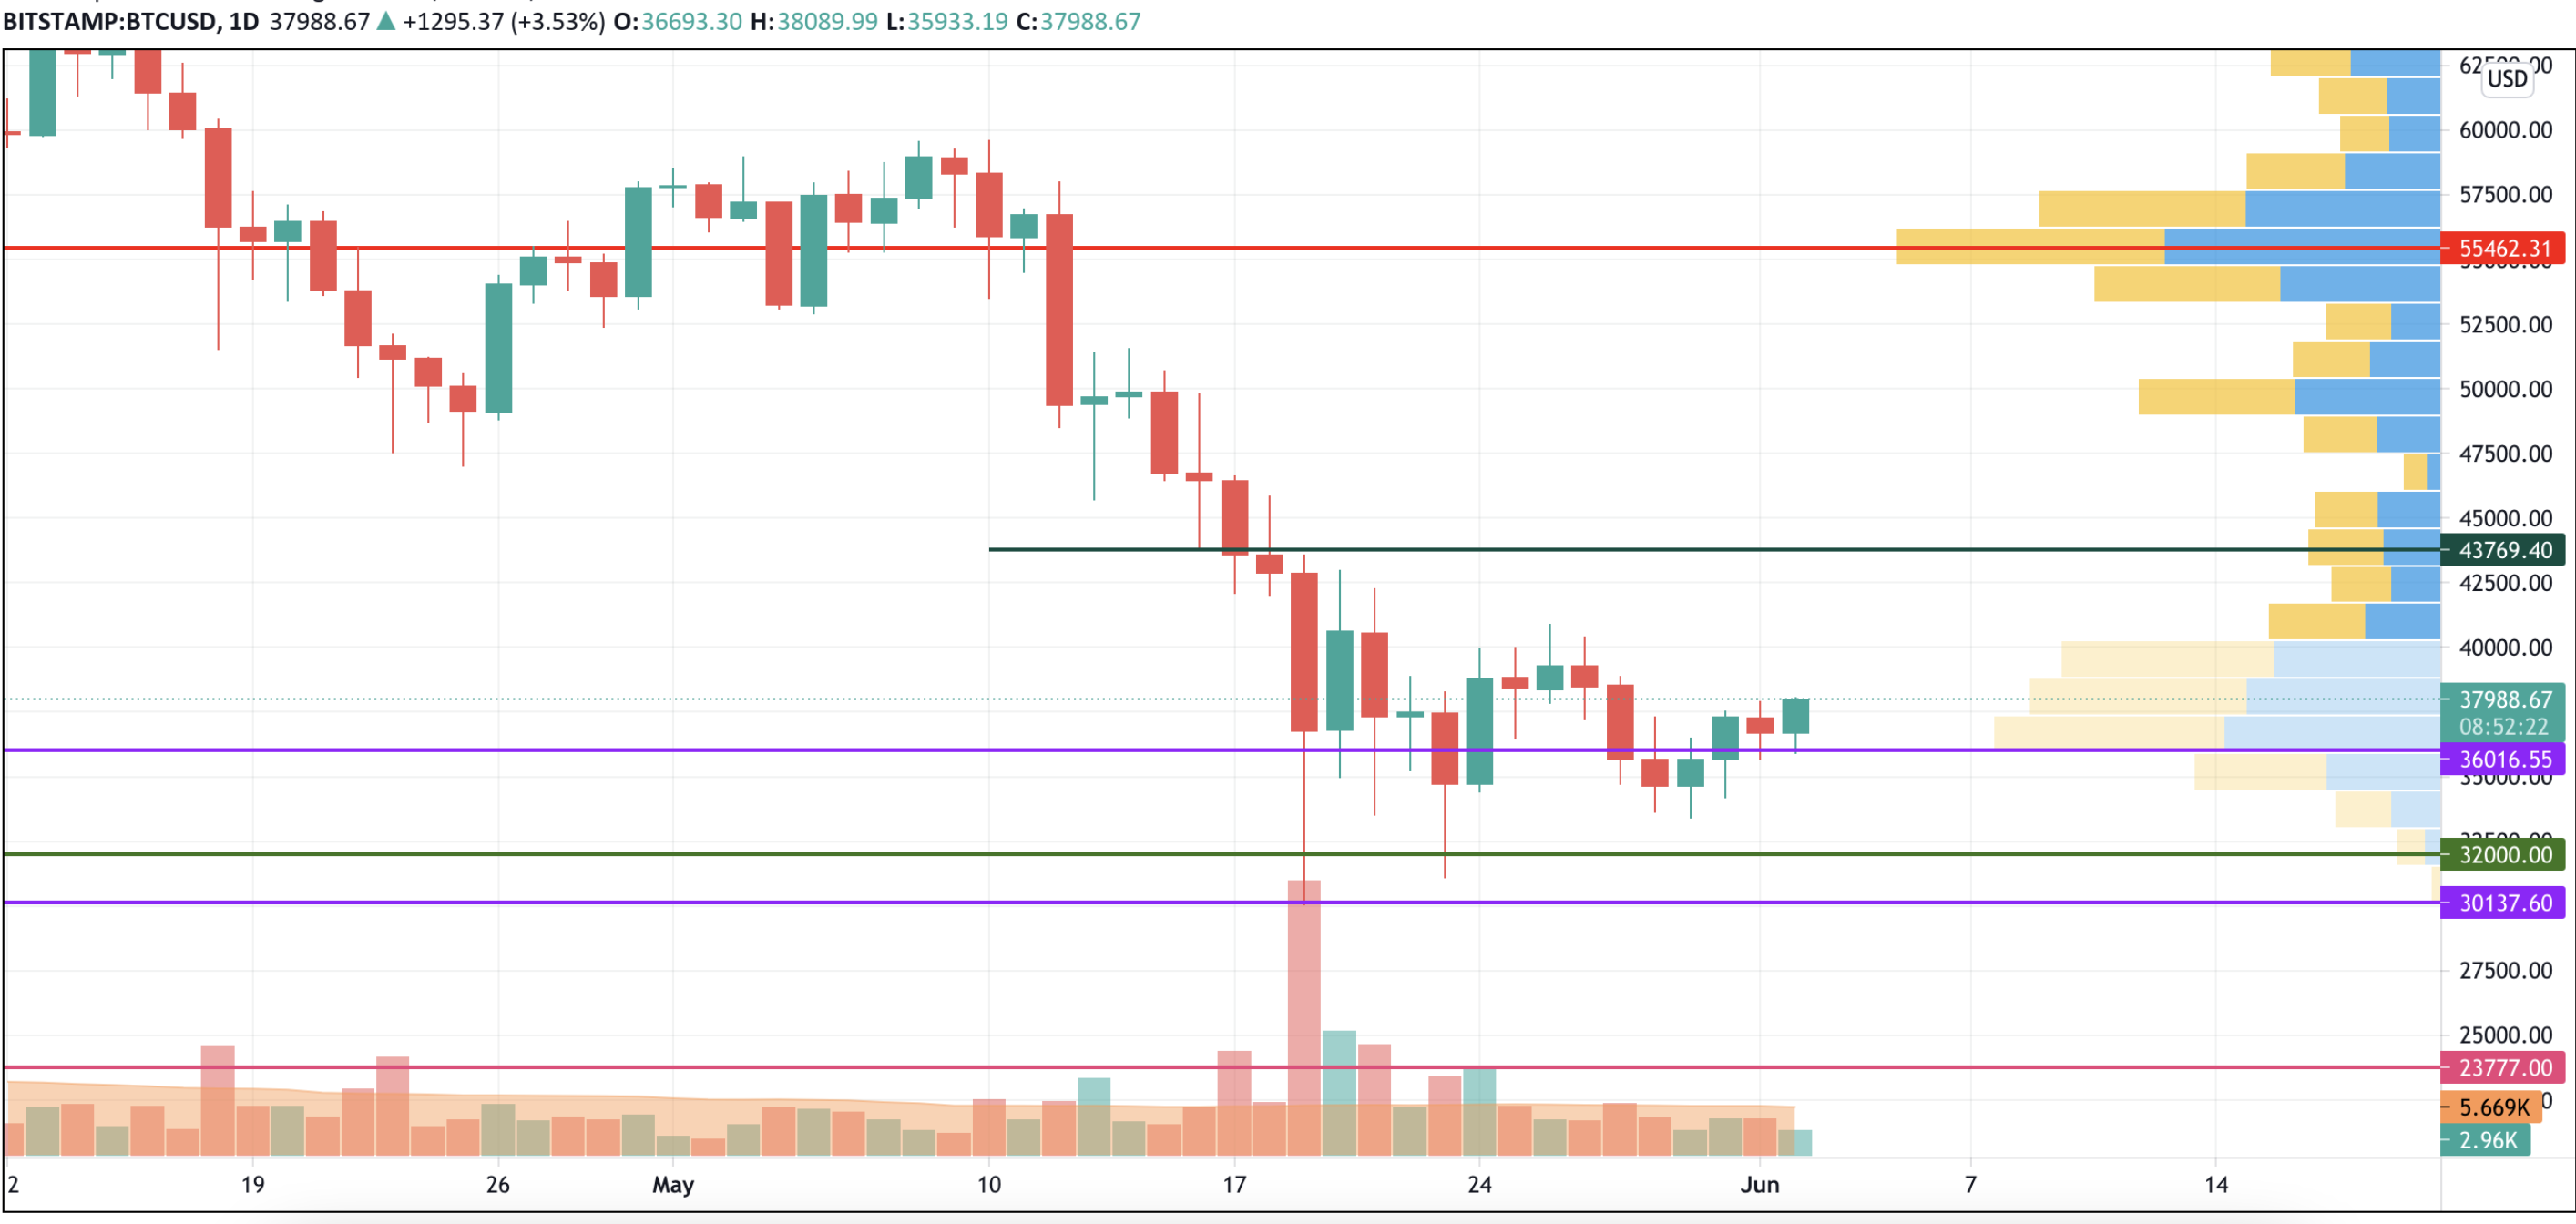
On the daily chart, Bitcoin (BTC) can keep rising as bulls have seized the initiative in the short-term case. The closest level at which sellers may return to the game is the vital mark of $40,000, as the buying volume is not enough for a long-term bull run.
Bitcoin is trading at $38,105 at press time.
BNB/USD
Binance Coin (BNB) has gained more than Bitcoin (BTC) as the price of the native exchange coin has rocketed by 19% since yesterday.
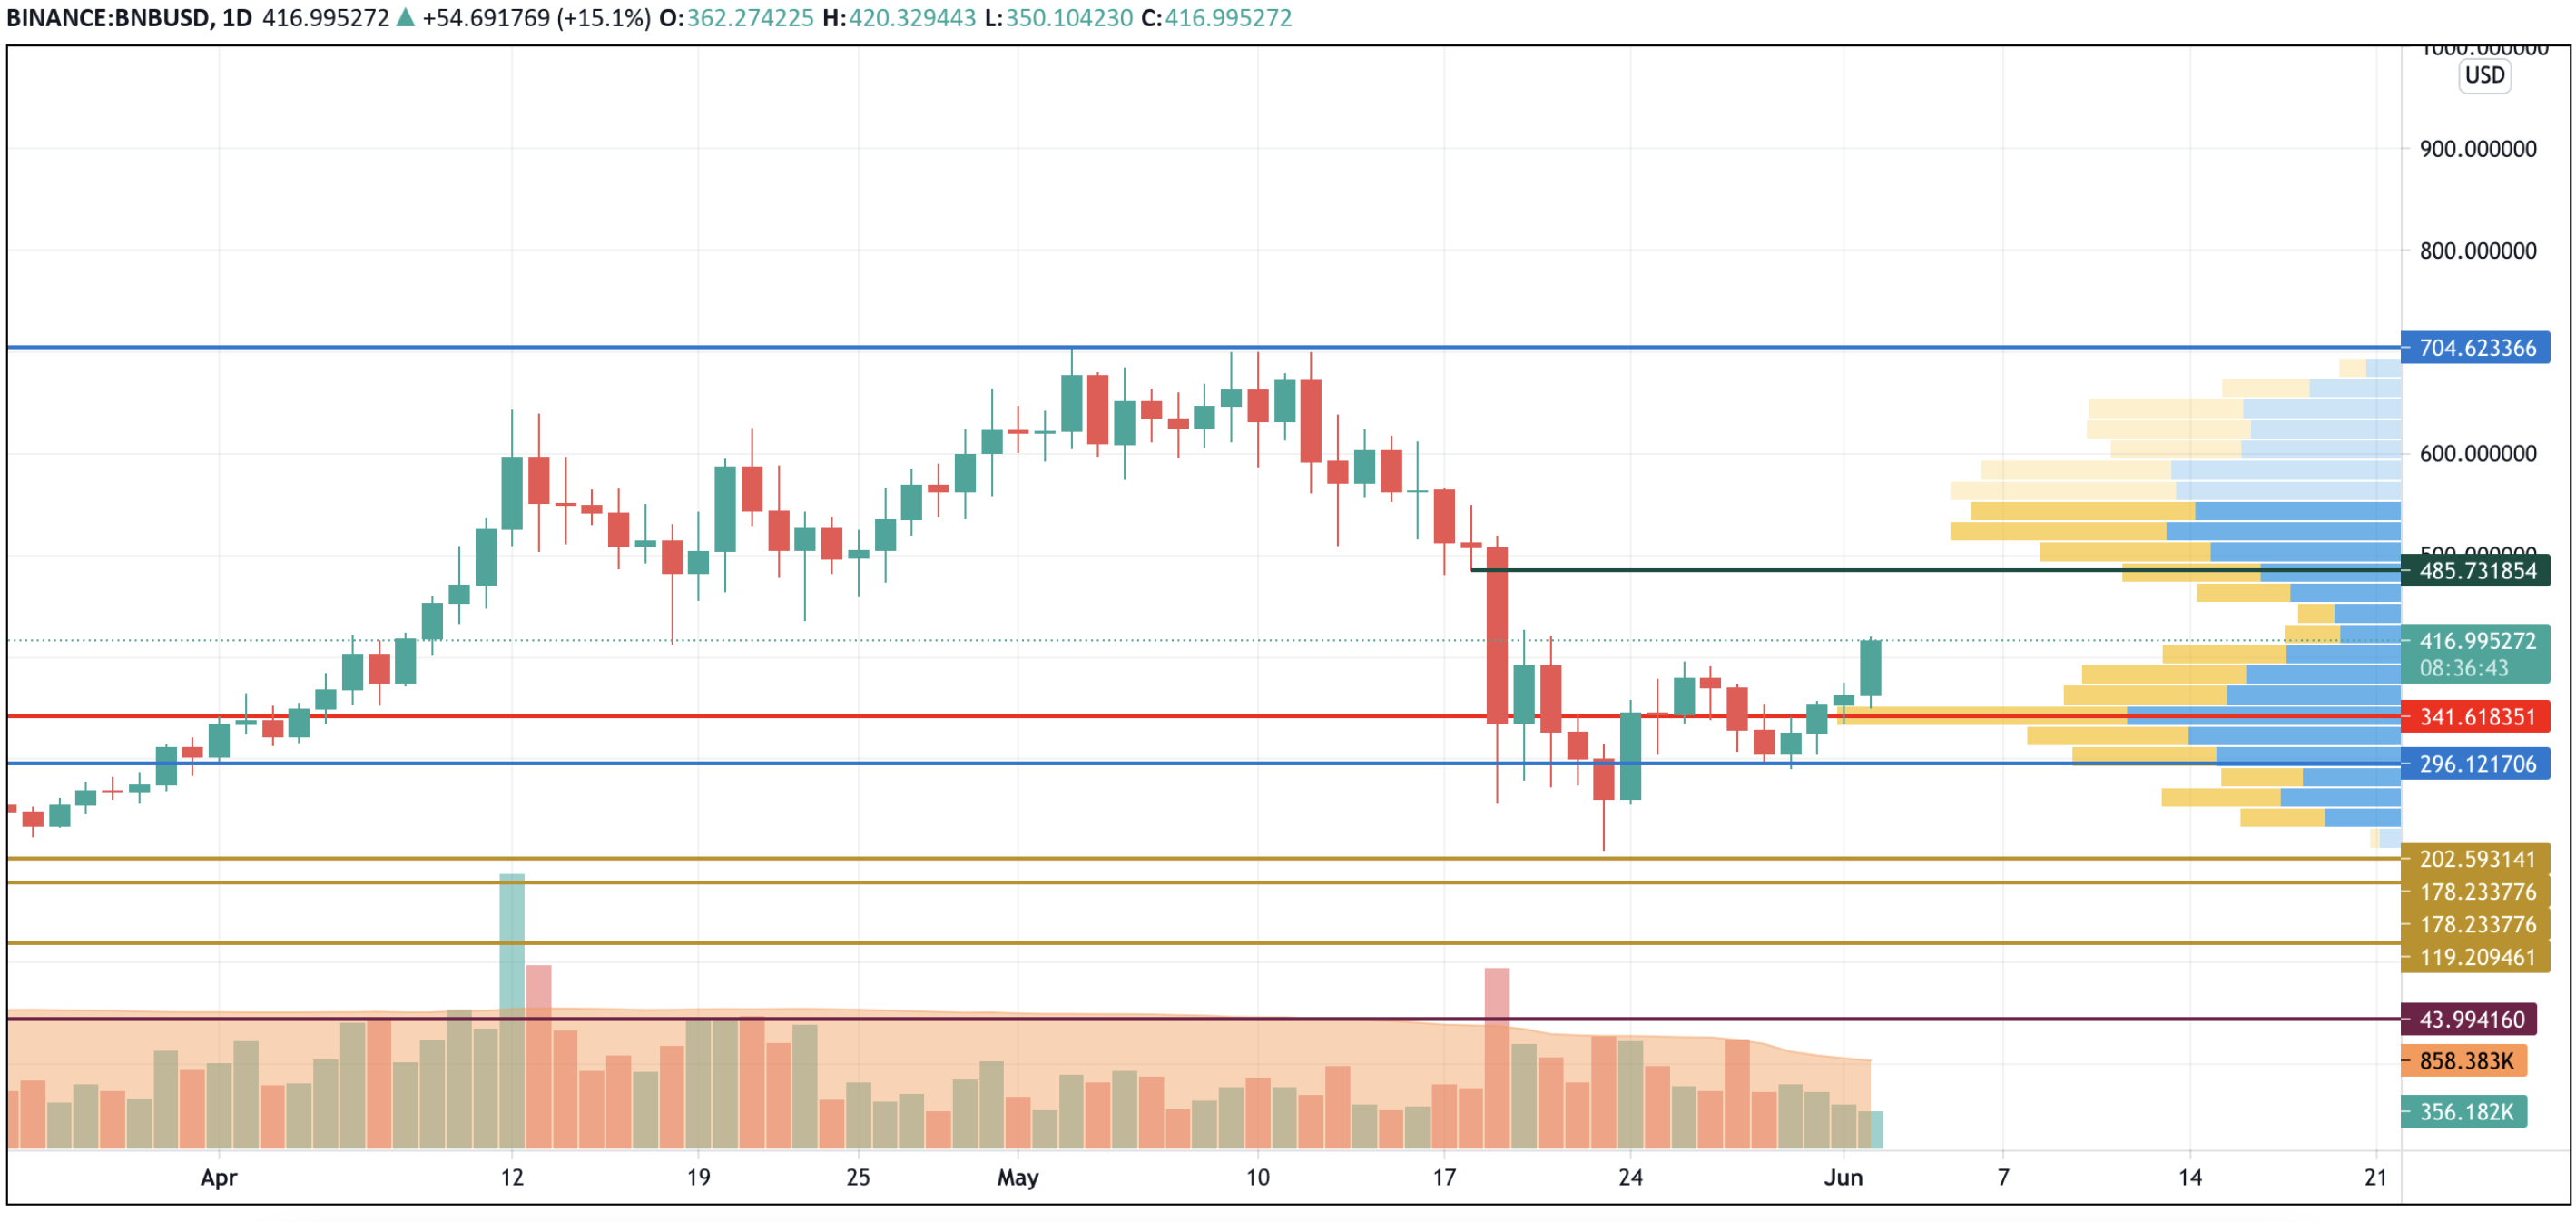
From the technical point of view, Binance Coin (BNB) is realizing accumulated energy in the area of $300. However, the buying trading volume keeps going down, which means that the rise might not last for long.
The nearest resistance is located at the mark of $485.
BNB is trading at $416 at press time.
XLM/USD
Stellar (XLM) is an exception to the rule as its rate is almost unchanged over the last day.
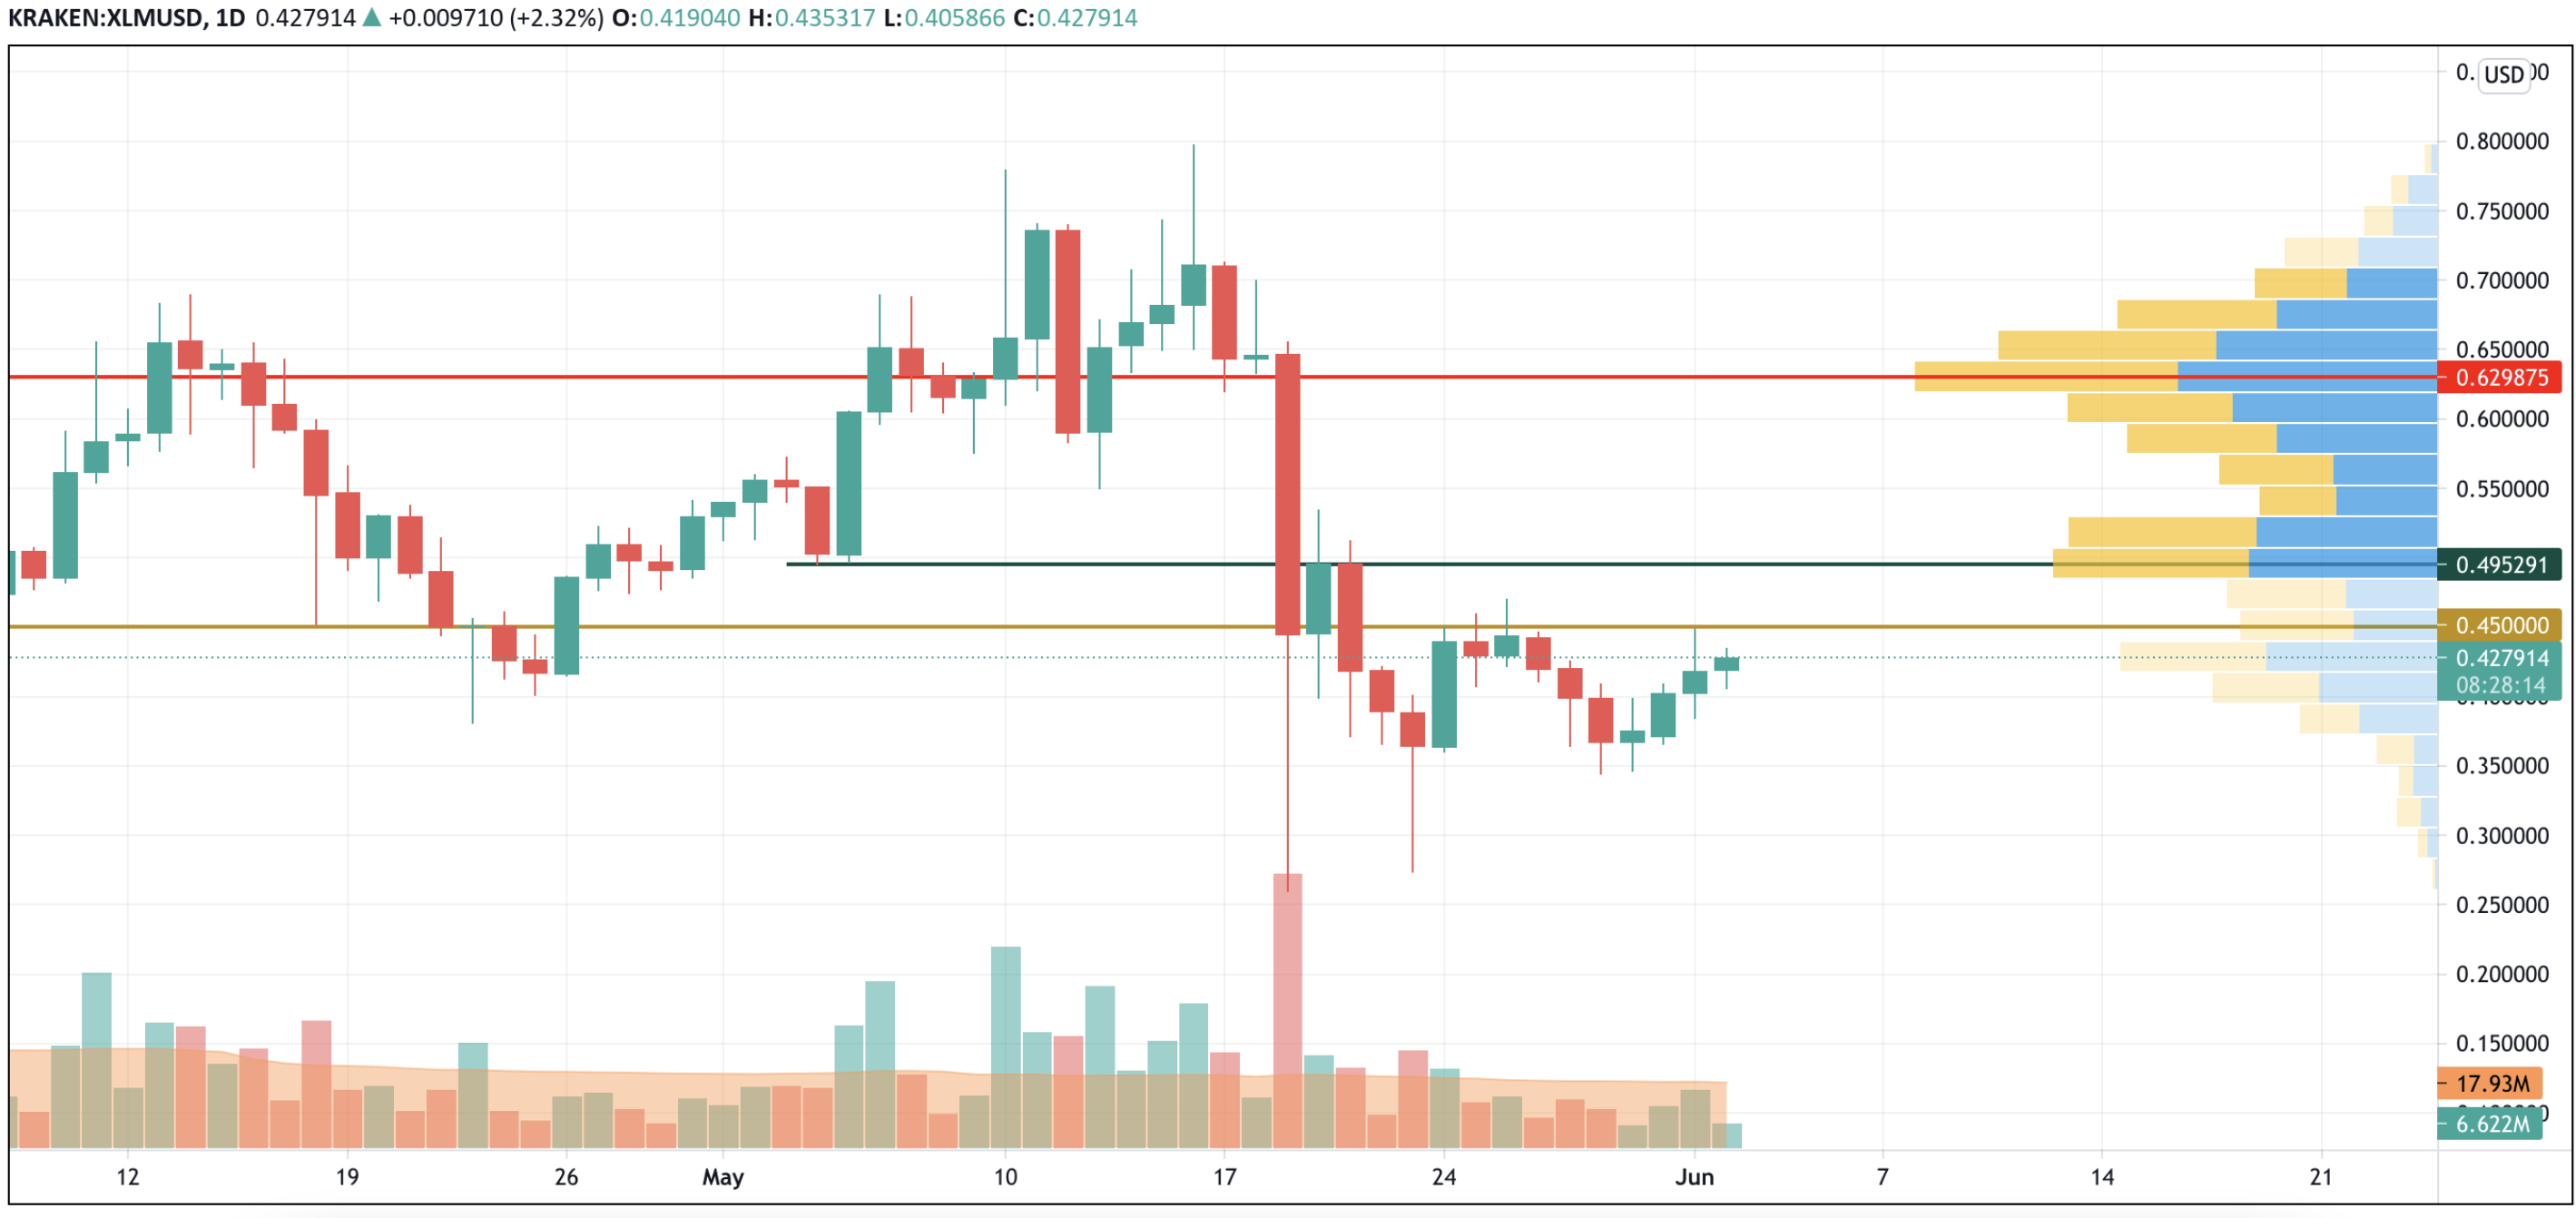
After a false breakout of the $0.45 mark, the price is not going down, which means that bulls might soon break this level. If that happens, the next level where a decline is possible is at $0.495.
XLM is trading at $0.4287 at press time.
YFI/USD
The rate of yearn.finance (YFI) has gone down by 0.35% over the last day.
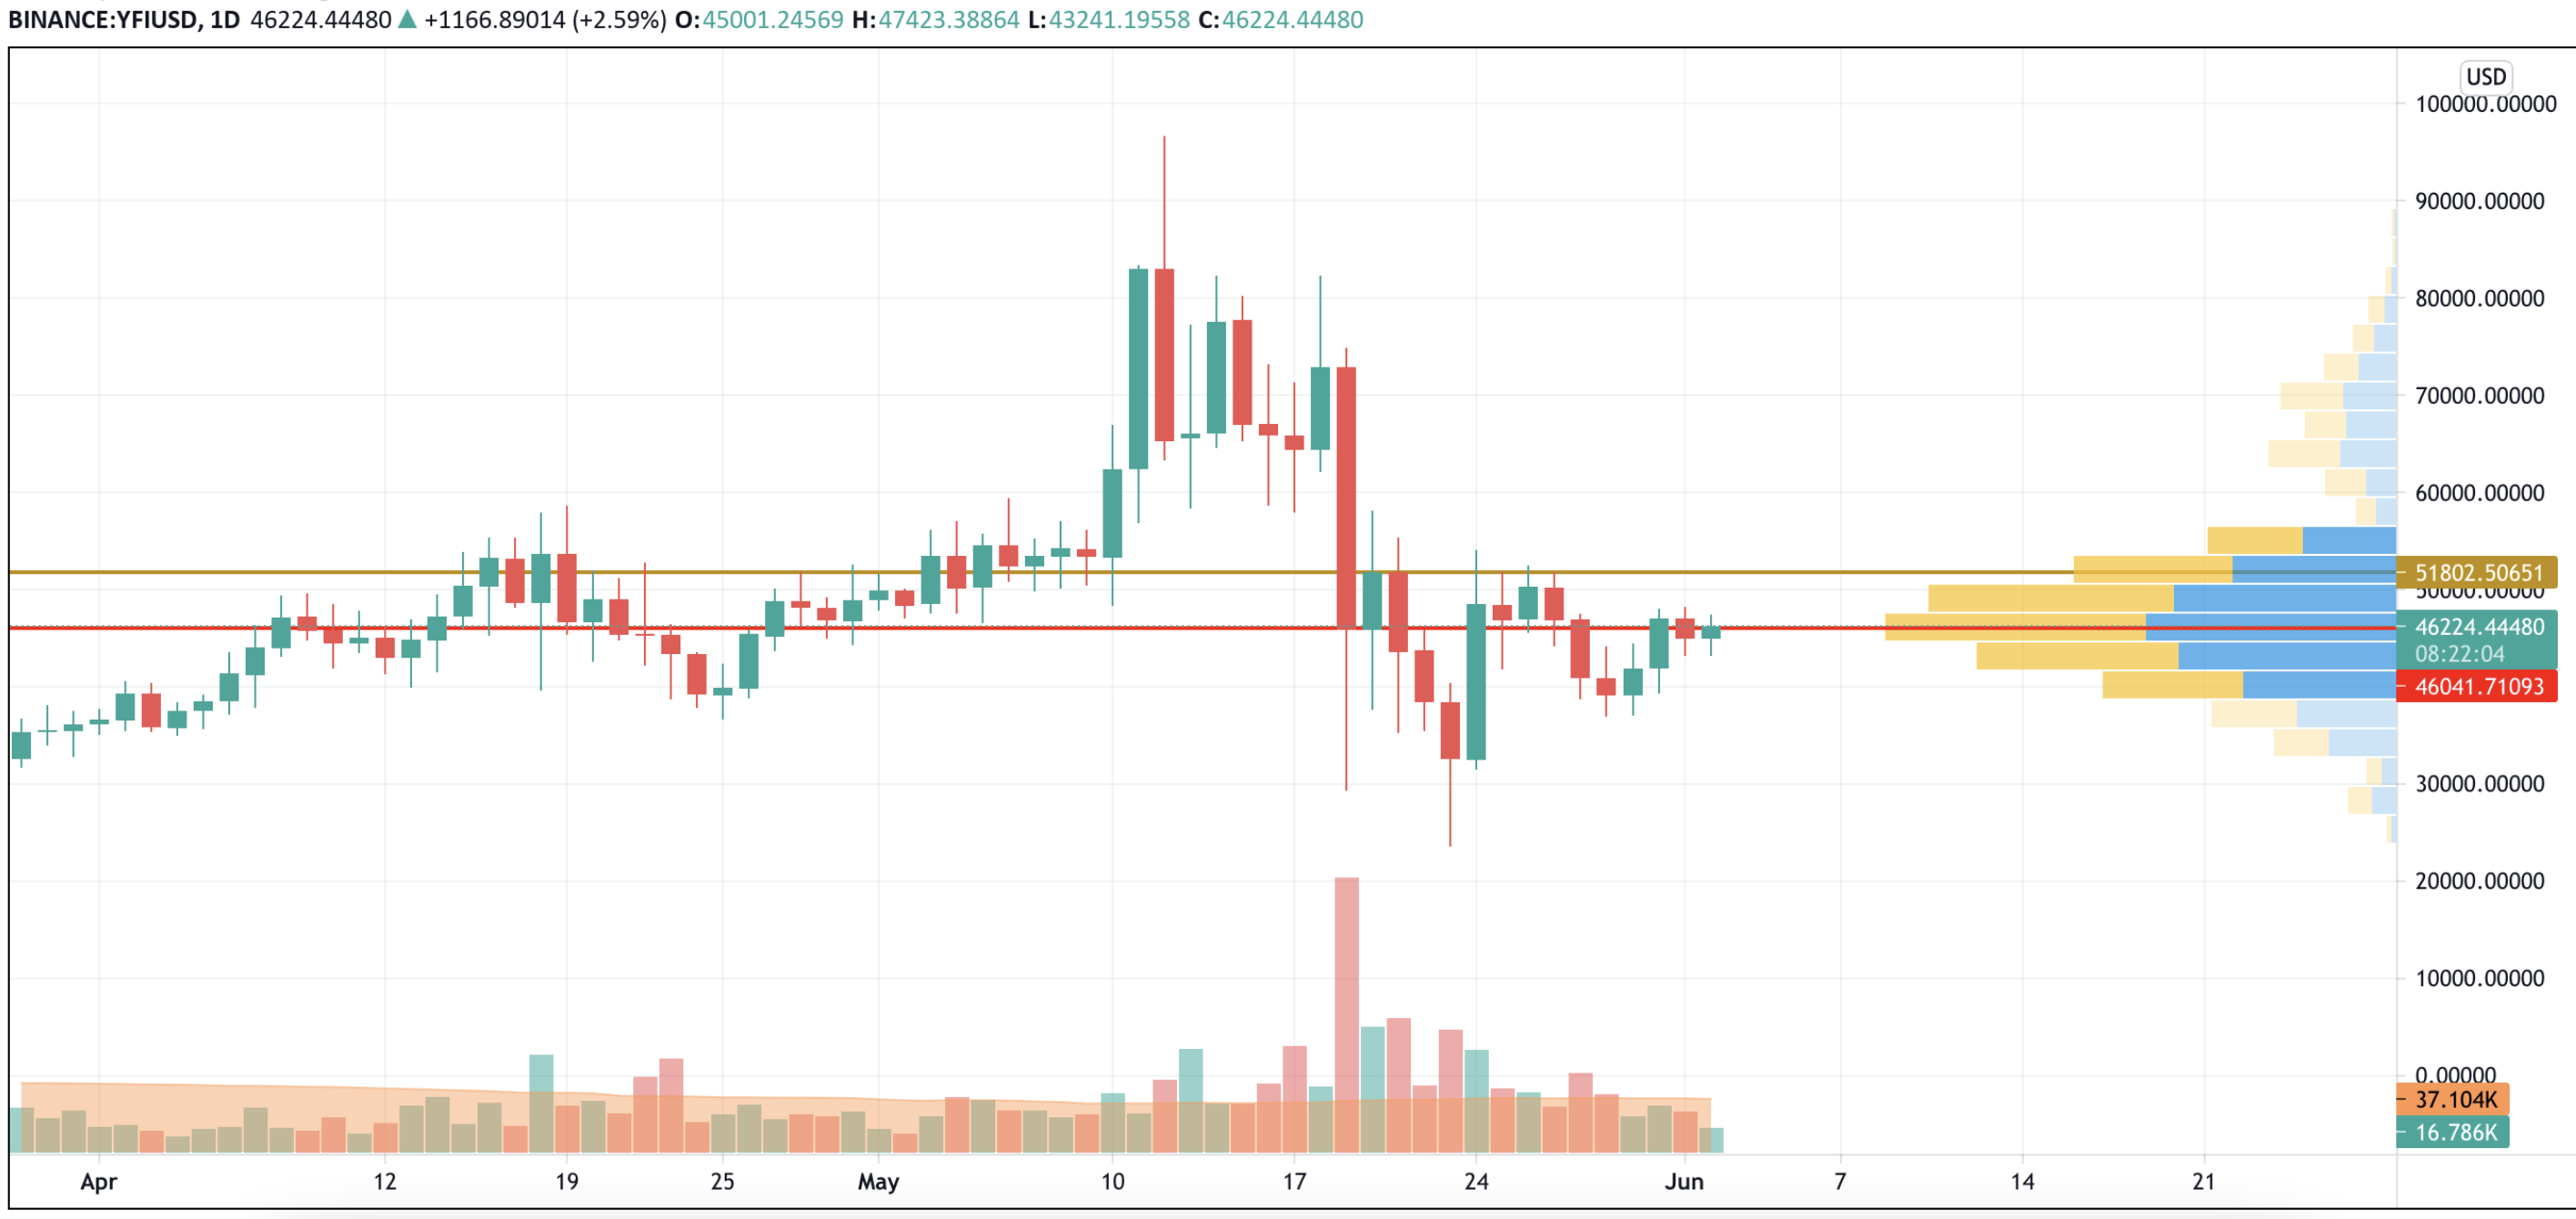
YFI is located in the zone where most of the liquidity is focused. At the moment, neither bulls nor bears are dominating on the market. If buyers can fix above $47,000, the vital level of $50,000 may be achieved soon.
YFI is trading at $46,150 at press time.
 Godfrey Benjamin
 Tomiwabold Olajide
 Caroline Amosun