
Disclaimer: The opinions expressed by our writers are their own and do not represent the views of U.Today. The financial and market information provided on U.Today is intended for informational purposes only. U.Today is not liable for any financial losses incurred while trading cryptocurrencies. Conduct your own research by contacting financial experts before making any investment decisions. We believe that all content is accurate as of the date of publication, but certain offers mentioned may no longer be available.
Bitcoin started February 2026 with a 10.1% drop, and now it is sitting at around $78,700 — which is over $45,000 less than the cycle high. But if CryptoRank's price history data is anything to go by, February might not be the disaster everyone is preparing for. Actually, it is the opposite: Bitcoin did great in February.
It had one of the best average and median gains of any month on record, with an increase of +13.4% and +11.6%, respectively. Only April and October have better numbers.
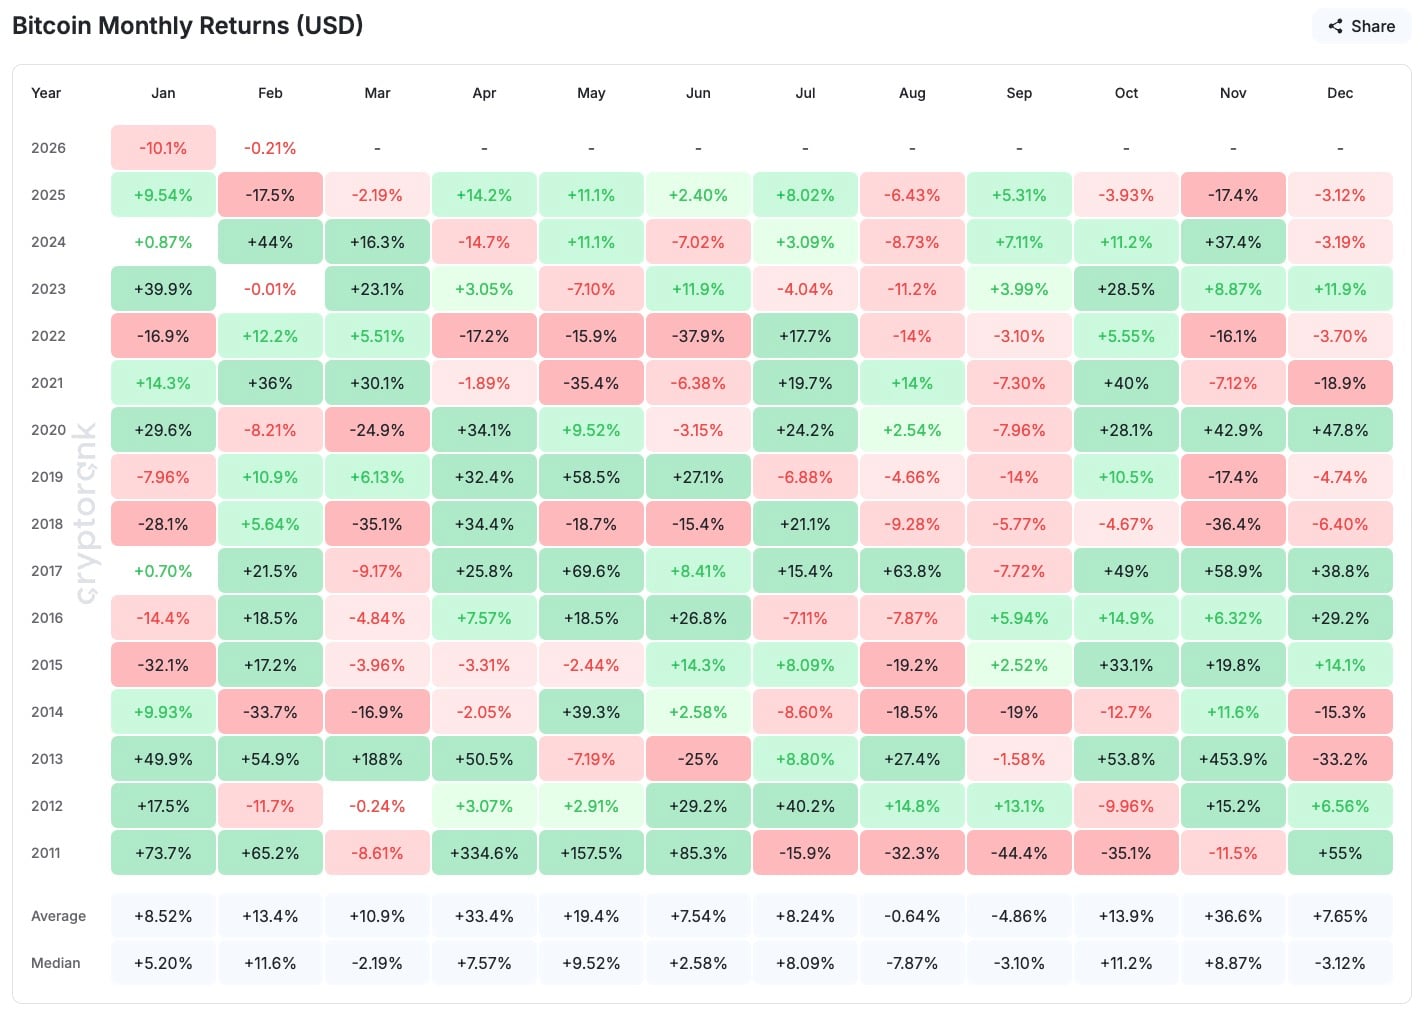
For the past 12 years, BTC has had a February gain 9 times out of 13. The outliers — 2020, 2014, 2012 — are rare and often linked to big events in the economy. But even then, it is not unusual to have a deep January red followed by a green February.
After a weak -0.28% in January, February still had a +5.64% print in 2018. In 2023, February barely moved at -0.01%, but then March went up by a whopping +23.1%.
Saylor and Strategy show way for Bitcoin
Bitcoin's weekly candle shows a 9.18% drop right now, but it is the retest of the $73,000-$76,000 support zone that could change the tempo. This is where Michael Saylor's Strategy has its average purchase price on a crazy 712,647 BTC stack — so it is only logical to set traps here. And February's seasonal stats back that up.
It is interesting to note that 2013, 2014, 2015 and 2021 all had double-digit rallies in February, even after tough conditions in January. In 2021, February's growth spurted by a whopping 36%, following January's modest 14.3% uptick. This mirrors the 2025 trend, where the year kicked off with a 9.54% gain.

The breakdown on Feb. 1 might just be the shakeout needed to reframe a textbook bullish setup. If history repeats itself, we could see a shift back to $90,000-$98,000 before March.
Even though everyone is panicking, February does not play out the same as January. It rarely collapses twice in a row — and when it doesn't, the snapbacks are violent. Don't let the red fool you.
 Dan Burgin
 U.Today Editorial Team