
The crypto market seems to make another stop as Bitcoin and its rivals had no significant price changes within the past 48 hours. General market players’ moods remain neutral but cryptos have some room to decline.
As for news and events, there is nothing to worry about, but some information may be useful and interesting to traders. Binance resumes its operations after two days of maintenance. The famous exchange stopped trading and withdrawal procedures a couple of days ago and was supposed to resume them on June 26. However, they have notified their users that they need more time to complete all their tasks.
Another interesting news is about the Reserve Bank of Australia and Bitcoin. The head of the regulatory authority underlined in his comments that there is no need for Bitcoin in Australia as the local fiat currency is strong enough. He stated also that BTC may be useful in other countries where traditional currencies are weak.
Bitcoin (BTC/USD) Price analysis, June 27
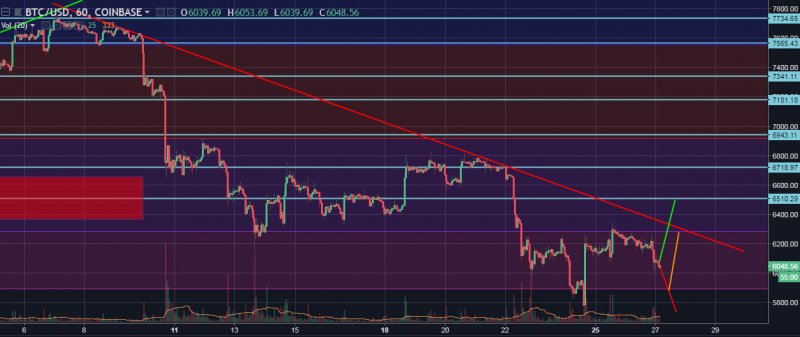
Bitcoin has lost more than two percent in the past 24 hours, but in general, the currency pair has no direction in the moment of writing. BTC/USD fluctuates below the descending trendline meaning we still have the local downtrend and sellers are able to push Bitcoin lower at any moment.
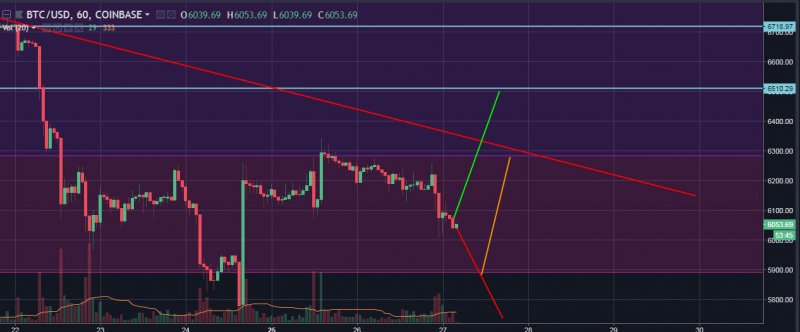
Let’s have a closer look at the hourly chart. Bitcoin has tested the resistance line at 3.618 retracement level a couple of times but failed to go higher. Cryptocurrency remains below this area in the moment of writing. The possible ways for BTC/USD are the following:
- Red scenario (bearish). Bitcoin will fall below the support area at 4.236 retracement level and move lower.
- Orange scenario (neutral). BTC/USD will remain within the current border, limited by the support at 4.236 and the resistance at 3.618 retracement levels.
- Green scenario (bullish). The currency pair will move higher and after successfully testing the resistance area at 3.618, it will target the next resistance at $6,510.
Ethereum (ETH/USD) Price analysis, June 27
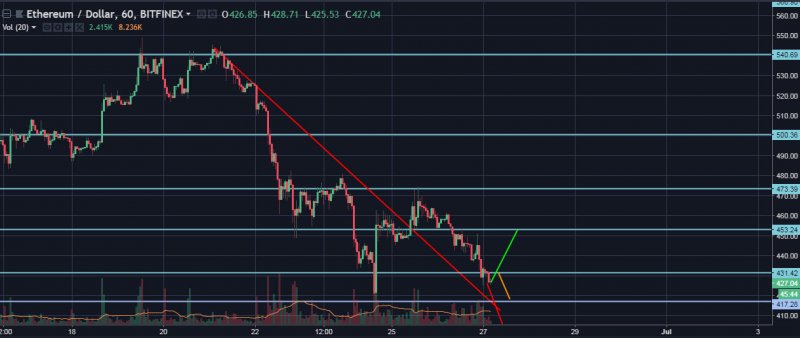
Ethereum has lost more than five percent in the past 24 hours. However, in general, there is no direction currently. The currency pair has crossed the descending trend line from below, but Ethereum approaches it again, ready to test it from above.
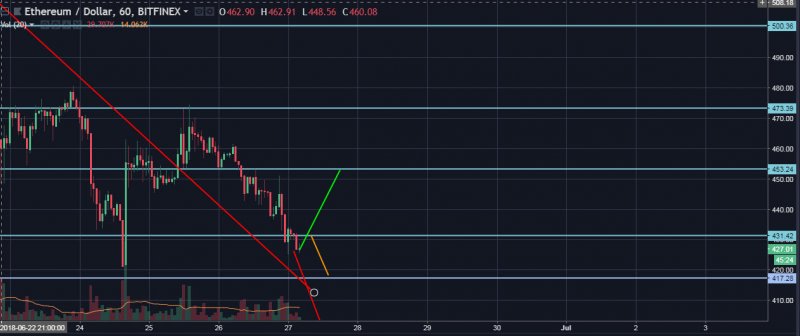
When we look closer at the hourly chart we can see that ETH/USD has tested $473.39 resistance area but failed to jump over it and started to decline. Ethereum has broken through the support area at $453.24 later and managed to fall below the next support at $431.42. The possible ways for Ethereum are the following:
- Red scenario (bearish). The currency pair will fall below the support area at $417.28 and develop its downtrend.
- Orange scenario (neutral). Ethereum will remain within the current range limited by the support area at $417.28 and the resistance area at $431.42.
- Green scenario (bullish). ETH/USD will break through the resistance at $431.42 and move higher, targeting the next resistance at $453.24.
Ripple (XRP/USD) Price analysis, June 27
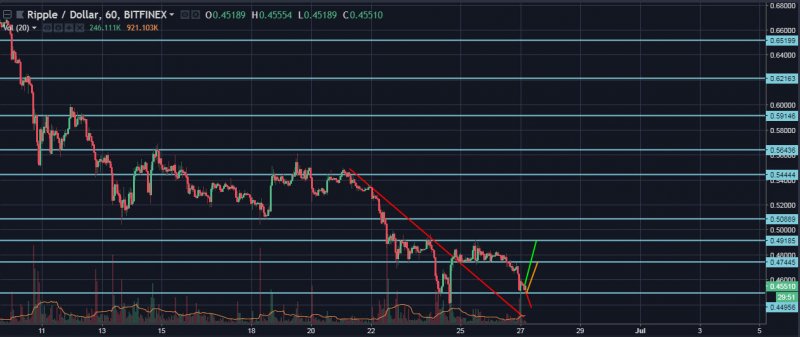
Ripple has lost more than four percent in the past 24 hours but looks neutral in general. The currency pair went above the descending trend line on the Hourly chart. However, Ripple goes downwards at the moment of writing aiming at this trend line.
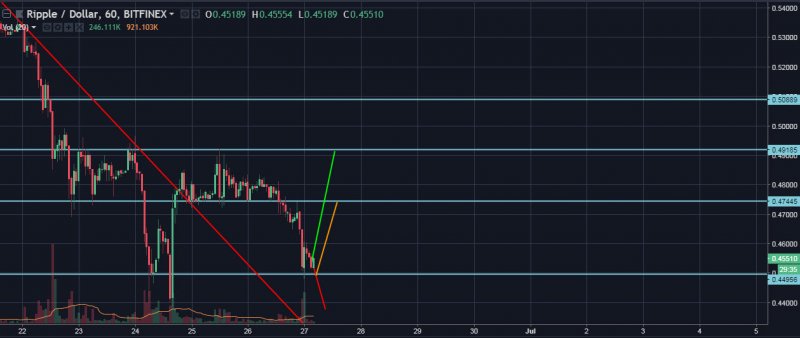
Let’s have a closer look at the hourly chart. The currency pair has tested the resistance area at $0.4918, but failed to cross it and reversed finally. XRP/USD has broken through the support area at $0.4744 and reached the next support at $0.4495. The possible ways for XRP/USD are the following:
- Red scenario (bearish). The currency pair will jump over the support area at $0.4495 and move lower.
- Orange scenario (neutral). Ripple will stay within the current borders, formed by the resistance at $0.4744 and the support at $0.4495.
- Green scenario (bullish). The currency pair will break through the resistance area at $0.4744 and move higher targeting the next resistance at $0.4918.
EOS (EOS/USD) Price analysis, June 27
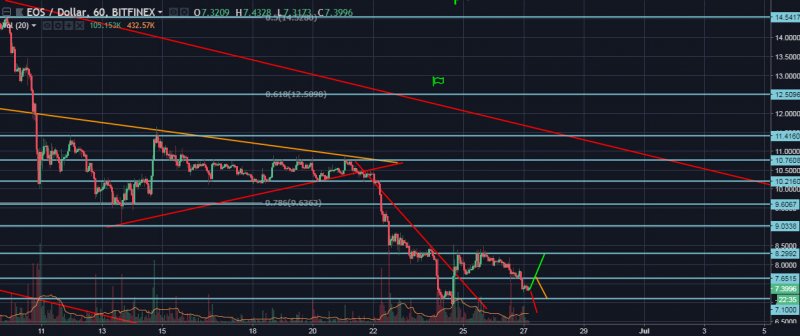
EOS suffered more significant losses in the past 24 hours. However, the currency pair shows no direction in general. The currency pair is above the descending trend line and looks neutral mid-term. It seems like market participants are preparing for something great.
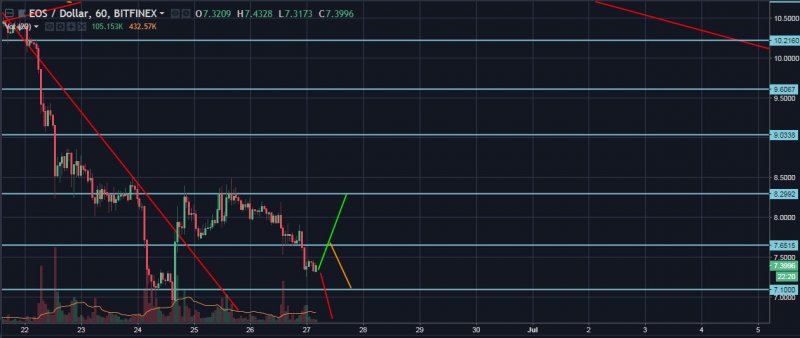
When we look closer at the hourly chart we can see that EOS/USD reached the resistance area at $8.29, but stopped there and declined later. The currency pair has crossed the support at $7.65 and fluctuates below in the moment of writing. The possible ways for EOS/USD are the following:
- Red scenario (bearish). The currency pair will break through the support area at $7.10 to move lower.
- Orange scenario (neutral). EOS will stay within the current range with no significant price changes, limited by the support at $7.10 and the resistance at $7.65.
- Green scenario (bullish). EOS/USD is going to cross the resistance at $7.65 and move higher, targeting the next resistance at $8.29.
NEM (XEM/USD) Price analysis, June 27
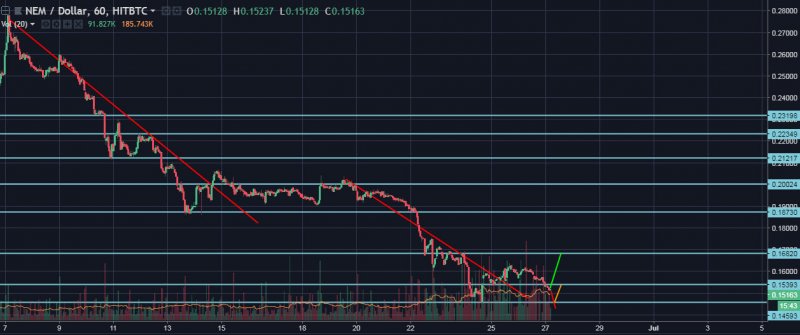
NEM was bearish in the past 24 hours as the currency pair has lost more than five percent. However, in general, XEM/USD is neutral as there is no direction currently. The currency pair went above the descending trend line but is trying to reach it again from above.
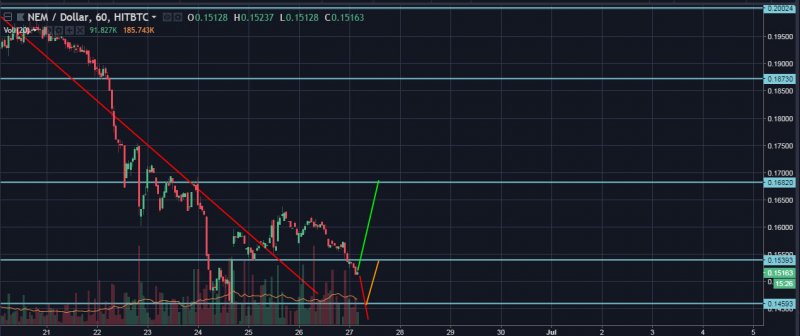
NEM failed to reach the resistance area at $0.1682 and declined later towards the support at $0.1539. The currency pair jumped over this line and fluctuates below it in the moment of writing. The possible ways for XEM/USD are the following:
- Red scenario (bearish). The currency pair will reach the support area at $0.1459 to test it. If successful, sellers will be able to push XEM/USD lower.
- Orange scenario (neutral). NEM will stay within the current range limited by the resistance at $0.1539 and the support at $0.1459.
- Green scenario (bullish). The currency pair will test the resistance area at $0.1539 and if successful, buyers will drive it towards the next resistance at $0.1682.
 Arman Shirinyan
 Alex Dovbnya
 Denys Serhiichuk