
Disclaimer: The opinions expressed by our writers are their own and do not represent the views of U.Today. The financial and market information provided on U.Today is intended for informational purposes only. U.Today is not liable for any financial losses incurred while trading cryptocurrencies. Conduct your own research by contacting financial experts before making any investment decisions. We believe that all content is accurate as of the date of publication, but certain offers mentioned may no longer be available.
After failing to maintain the recovery rally that peaked close to the 200-day moving average, Bitcoin is still under a lot of pressure. The longer-term bearish structure was validated by the $82,000 rejection, which also set off another wave of selling that drove Bitcoin back toward $58,000.
The situation is still weak technically. Bitcoin is currently trading below the 50, 100, and 200-day moving averages, all of which are still declining. This alignment usually indicates that sellers are in control over a number of time periods. While RSI is close to oversold territory and has not produced a strong bullish divergence, volume has not shown any indications of significant accumulation.
The most important level to keep an eye on is the most recent low of $57,000 to $58,000. A more severe decline would be possible if it were lost. For the time being, any upward movement appears to be more of a relief bounce than the beginning of a long-term trend reversal.
Stellar is avoiding a bear trend
XLM is still one of the few large-cap tokens that is holding close to its moving averages in spite of the overall weakness of the market. The token recently saw a huge surge that drove it above the 200-day moving average and generated a significant amount of trading activity.
The price is currently testing the cluster of the 50, 100, and 200-day moving averages around the $0.18–$0.19 zone after sharply retracing from local highs near $0.30. Bulls and bears now use this region as a crucial battlefield. The fact that XLM's longer-term structure has not entirely collapsed is a plus. In contrast to Bitcoin, Stellar still has an opportunity to reach a higher low if buyers hold onto the present support levels.
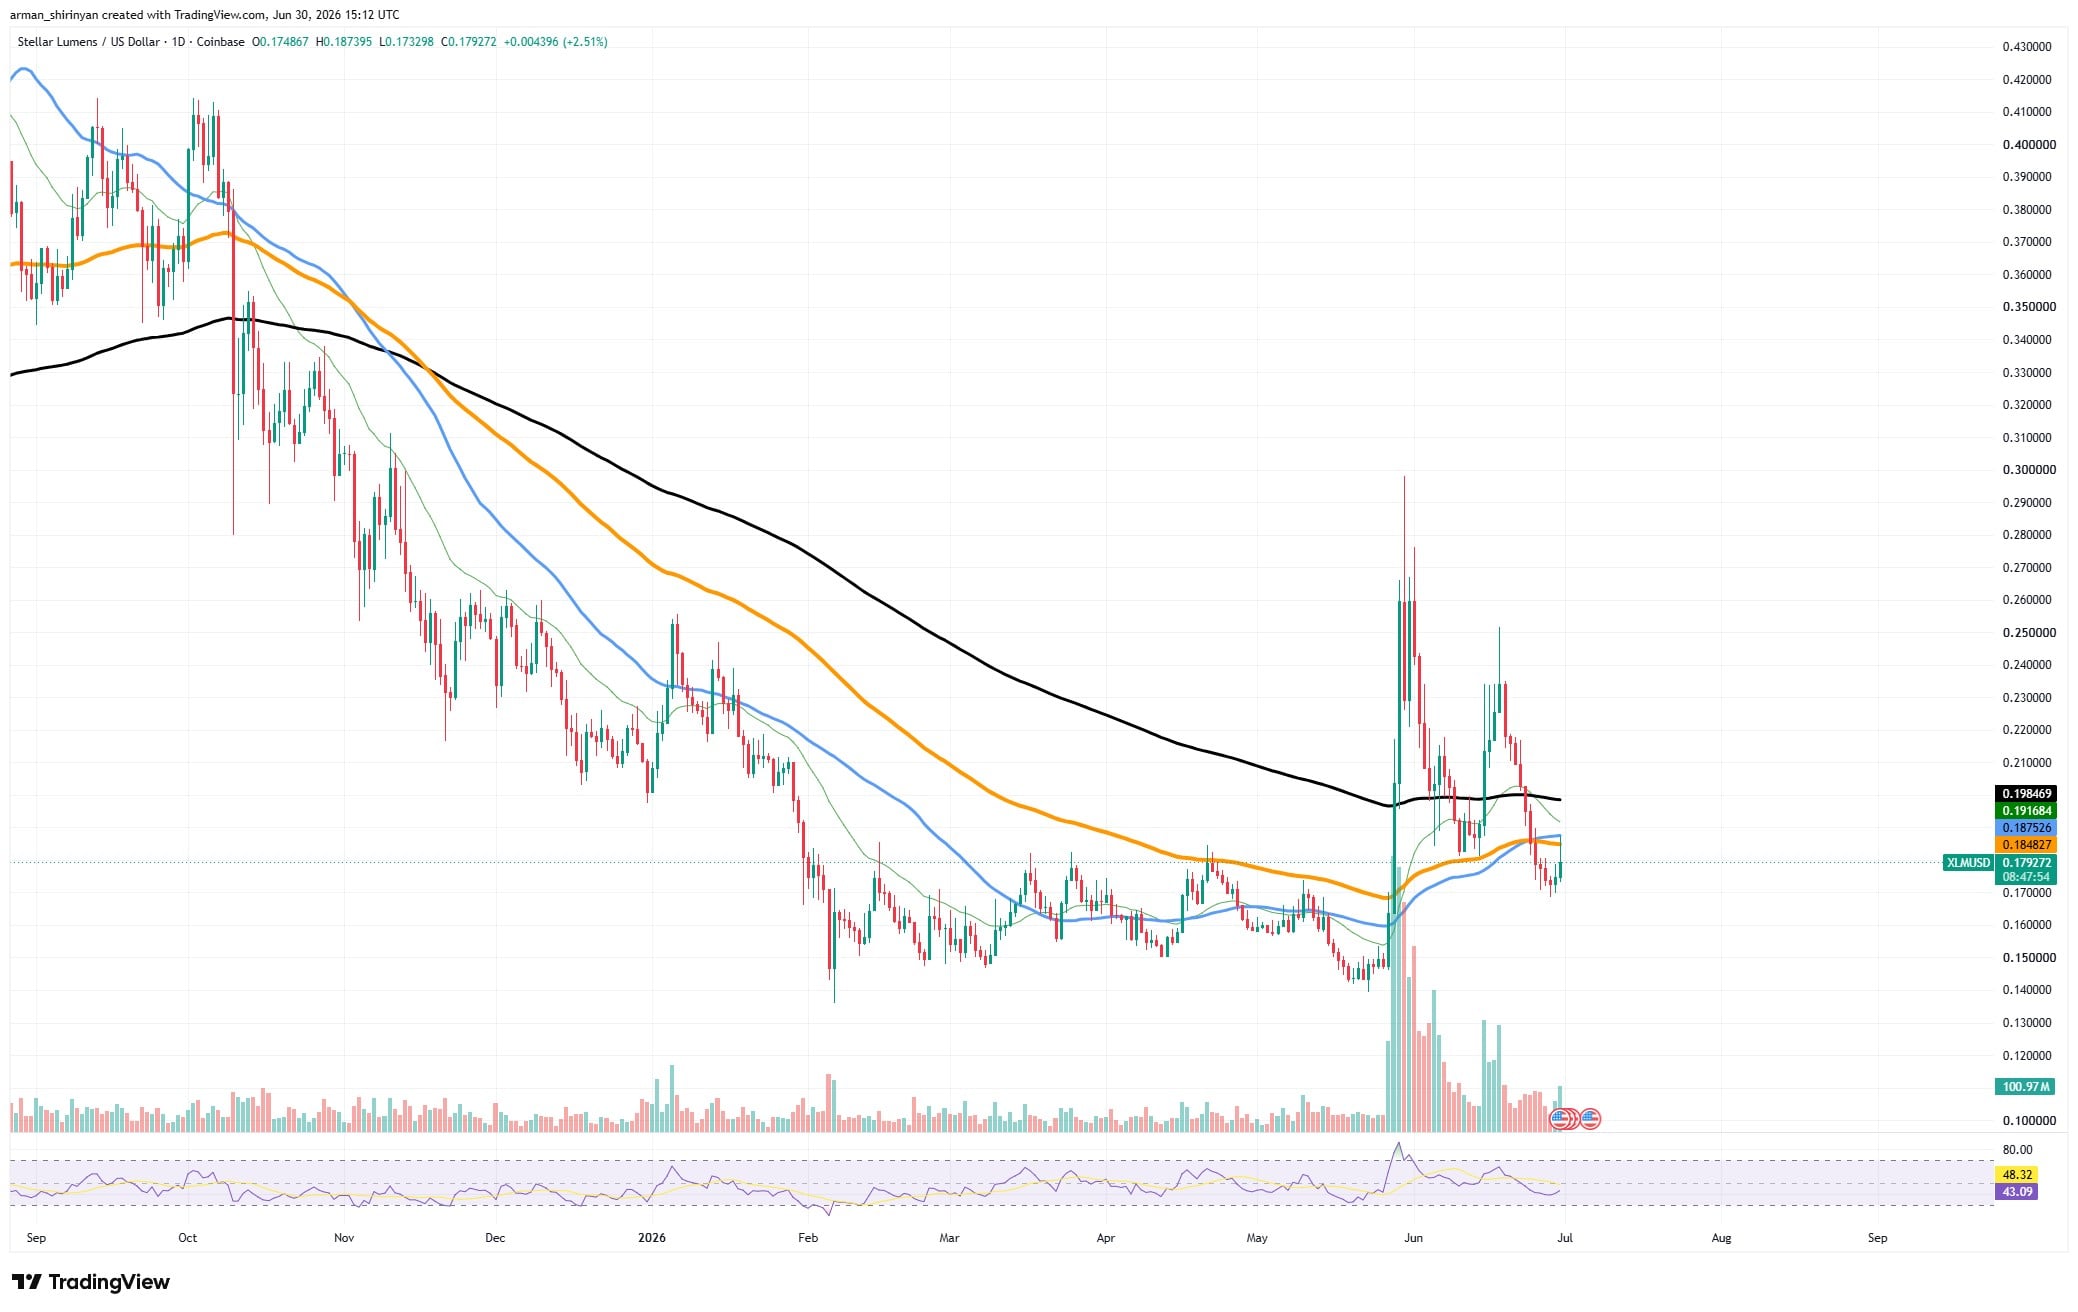
There is less speculative excess in the market as a result of the RSI cooling from overbought conditions. If XLM is able to hold above $0.18, it may be able to stabilize and try to push higher again. However, a breakdown below that range would probably invalidate a large portion of the recent breakout and return the asset to a wider downtrend.
The asset broke out of a descending triangle pattern after consolidating above important support levels for several months. It is currently trading close to $1.03, which is dangerously close to the psychological $1 mark. The breakdown in and of itself is significant. XRP consistently printed lower highs while defending the $1.30 support zone throughout March, April, and May.
Sellers eventually outnumbered buyers, which caused a sharp decline below support. The move accelerated the downward momentum and validated the bearish structure.
XRP remains alerted
XRP is still in a precarious position technically. The price is moving below the downward-sloping 50-, 100-, and 200-day moving averages.
This alignment typically indicates a long-term downward trend as opposed to a brief correction. Buyers have not regained control, as evidenced by the rejection of each recovery attempt over the past few weeks near moving-average resistance. Currently, $1.00 is the most crucial level. In addition to being a significant psychological barrier, it is also one of the final significant support areas before XRP moves into a region where past purchasing activity becomes significantly less frequent.
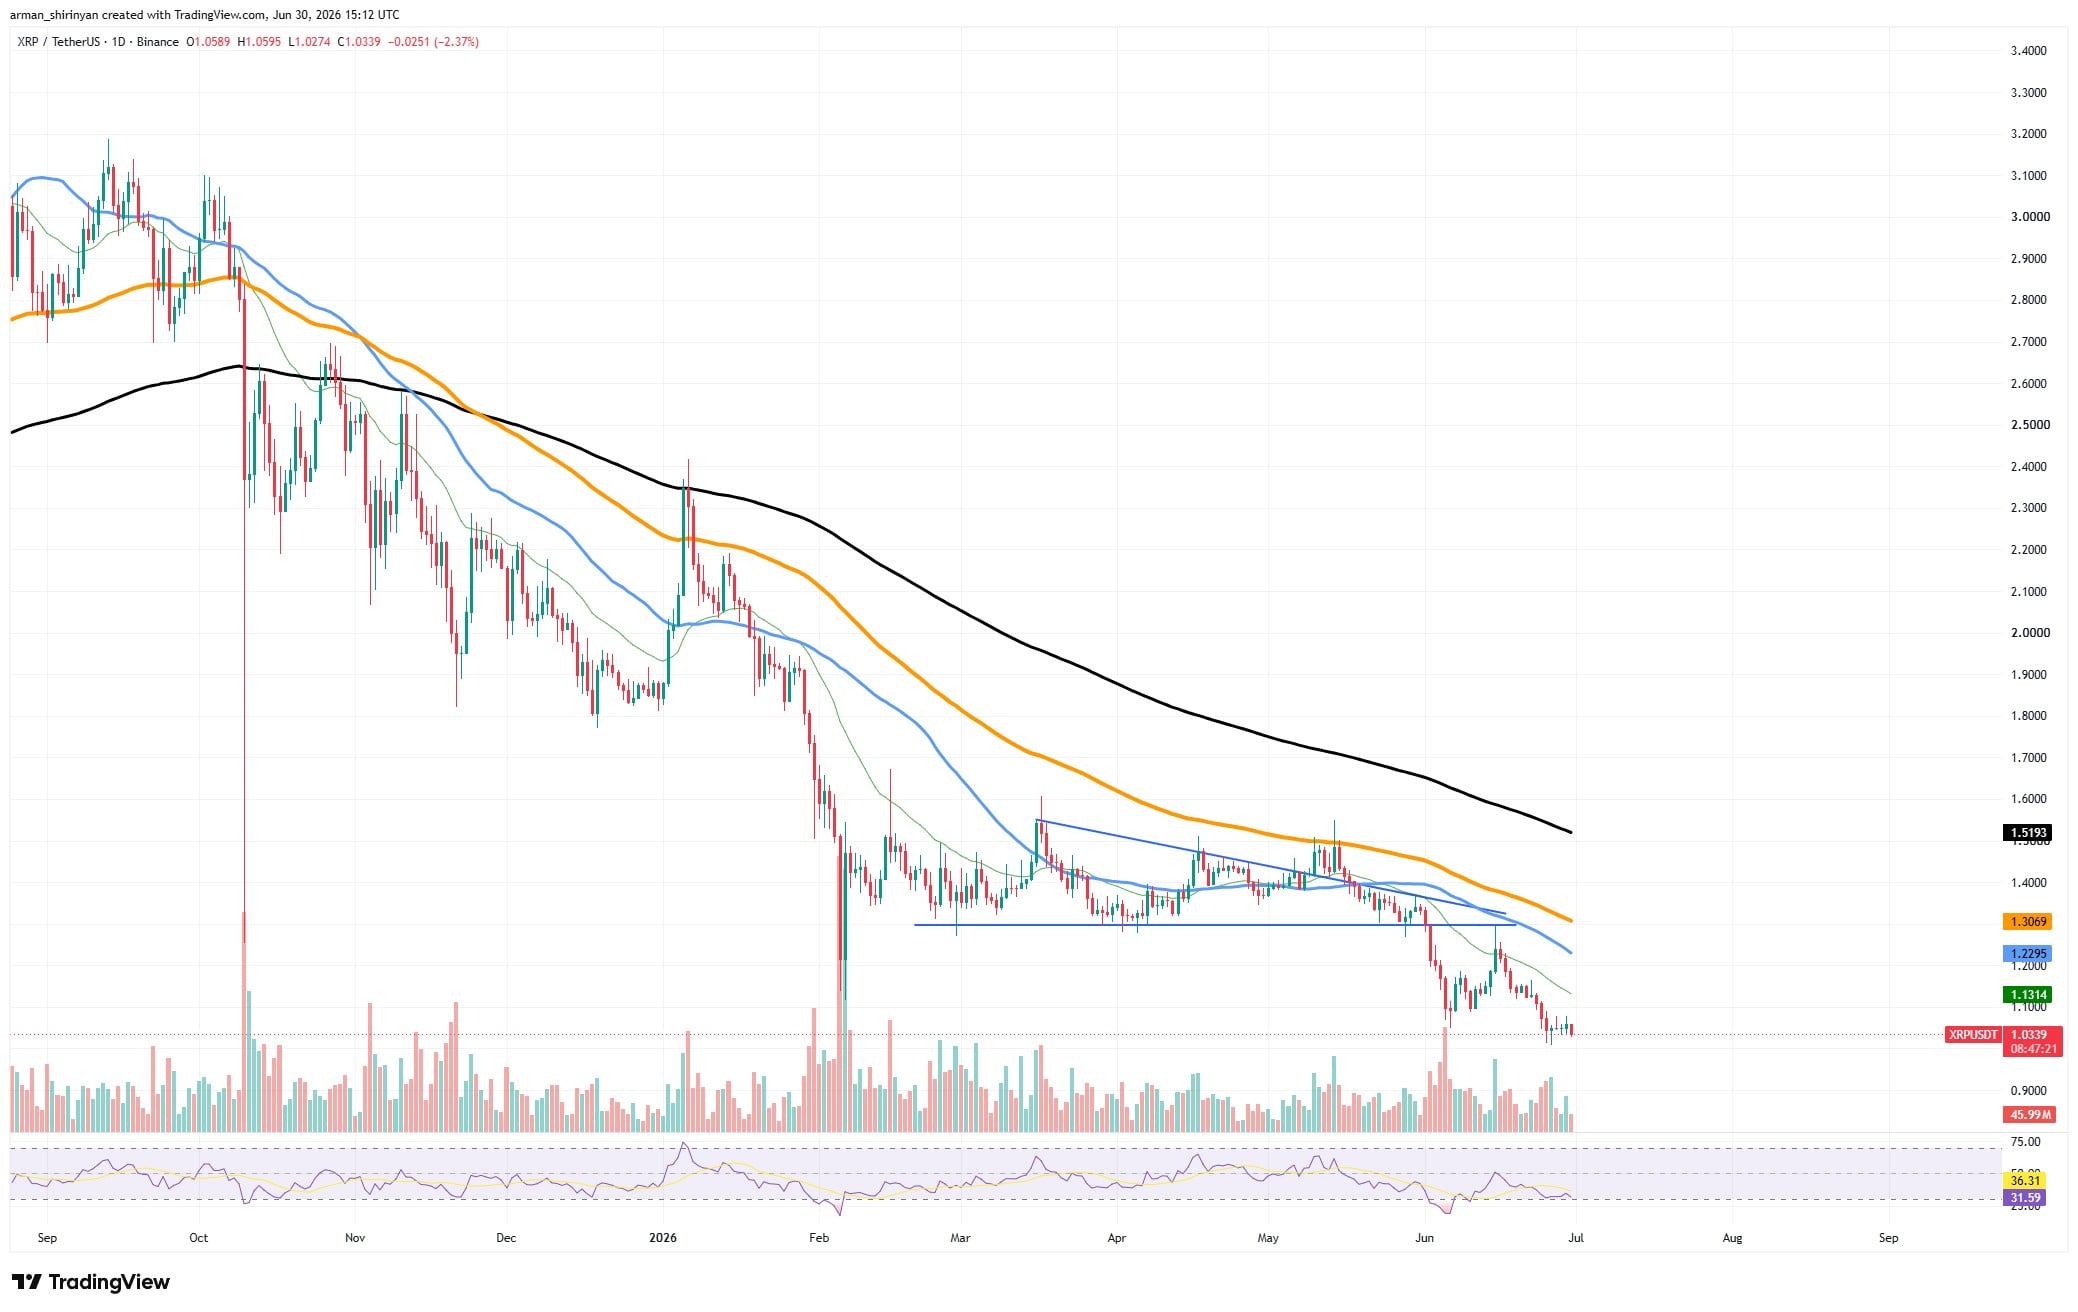
Another wave of liquidations and panic selling would probably result from a breakdown below $1, particularly among traders who have been anticipating a recovery from current levels. Although RSI is getting close to oversold territory, a convincing reversal signal has not yet been generated.
This does not necessarily mean that a bottom has formed, even though it implies that downside momentum may be slowing. The road ahead is simple but challenging for bulls. To refute the current bearish trend, XRP must eventually return above the broken $1.30 support area and at least recover the 50-day moving average around $1.13.
Until then, rallies are probably not going to be seen as the beginning of a recovery, but rather as opportunities for sellers. The medium-term course of XRP may be decided in the next few days. A relief bounce is possible if $1 holds. If it does not hold, the market might experience another painful decline.
Hyperliquid makes haste
Despite the recent correction, Hyperliquid is still one of the market's best-performing assets. In contrast to the majority of cryptocurrencies, HYPE is still firmly above its major moving averages and maintains a more expansive bullish structure. HYPE entered a phase of increased volatility after rising from below $30 earlier this year to highs above $75. The asset went through a number of significant corrections, but buyers kept intervening before the trend could fully collapse.

After yet another rejection from local highs, HYPE is currently trading close to $65. The pullback may seem alarming, but the chart remains positive. The 100-day and 200-day averages are still much lower, indicating the strength of the underlying trend, while the 50-day moving average at $64 continues to serve as immediate support. Several tests have already been conducted on the rising trendline that sustained the advance throughout the spring.
During times of volatility, the price briefly fell below it, but buyers soon regained control, averting a more significant structural breakdown. There is a significant decrease in momentum. After being in overbought conditions for weeks, the RSI has declined toward neutral territory. Since it eliminates excessive speculation without ruining the uptrend, this reset is actually beneficial to the market.
The 50-day moving average is the crucial level to monitor. Another attempt to reach the $70-$75 range is still possible if HYPE can stay above it. The likelihood of a deeper retracement toward the 100-day moving average around $53 would rise in the event of a break below that level. HYPE is one of the few significant assets that is currently exhibiting a bullish market structure. The current correction does not appear to be the start of a full trend reversal, but rather consolidation following an explosive rally.
 U.Today Editorial Team
 Dan Burgin