
Disclaimer: The opinions expressed by our writers are their own and do not represent the views of U.Today. The financial and market information provided on U.Today is intended for informational purposes only. U.Today is not liable for any financial losses incurred while trading cryptocurrencies. Conduct your own research by contacting financial experts before making any investment decisions. We believe that all content is accurate as of the date of publication, but certain offers mentioned may no longer be available.
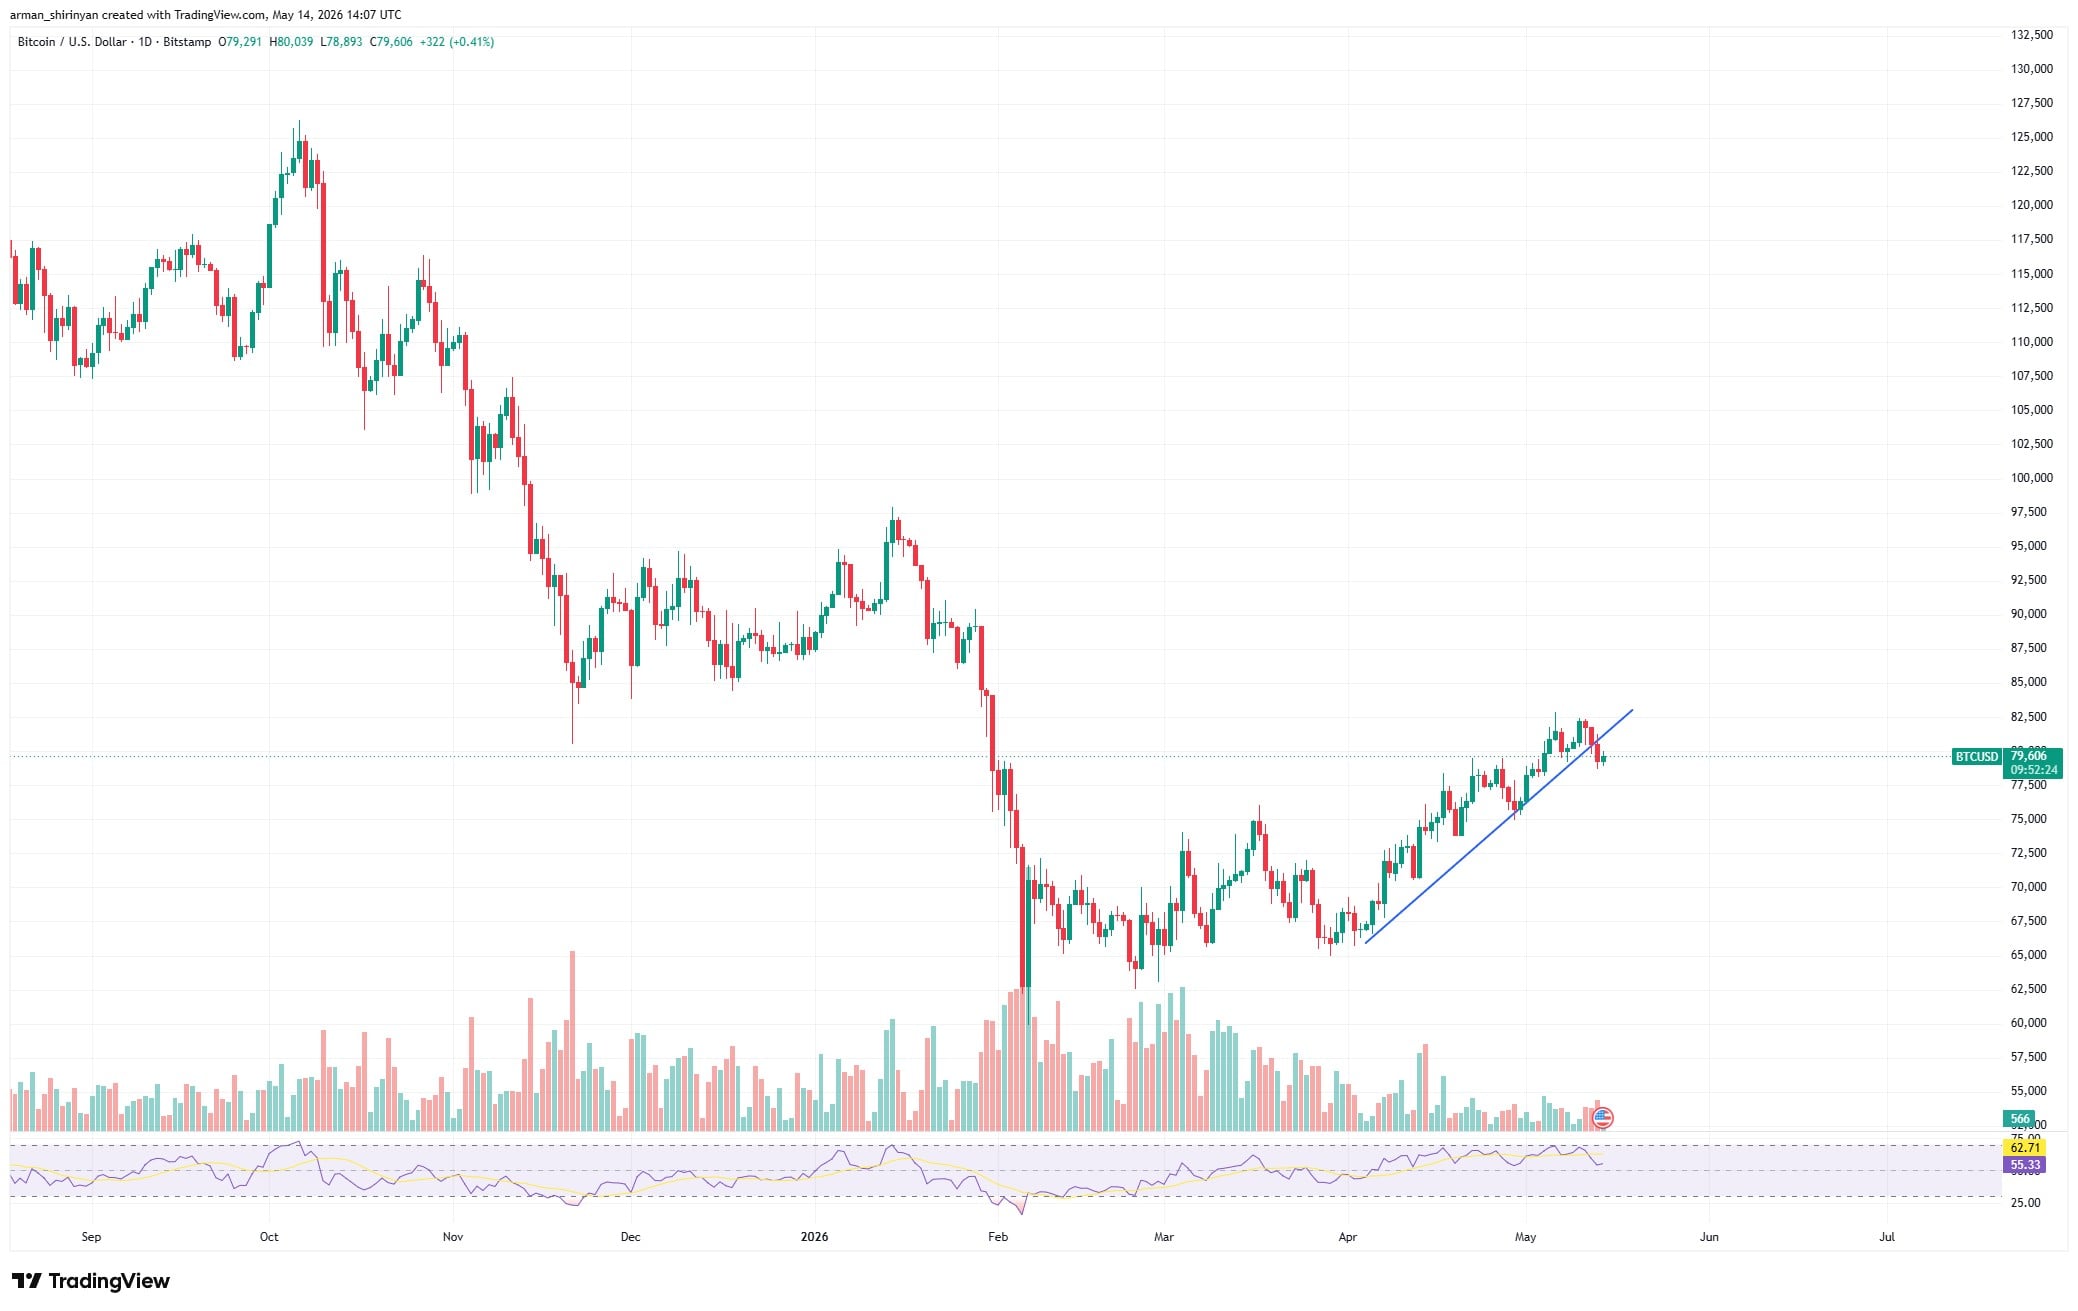
What had recently appeared to be a controlled recovery has become a more precarious technical setup, as Bitcoin has fallen back below the $80,000 mark. After failing to hold above the psychological $80,000 zone, which served as short-term support during the most recent rebound, the daily chart shows Bitcoin trading around $79,800. Dogecoin rises 50%, suggesting a new rally as momentum picks back up. Toncoin could lose $2 following a severe post-spike decline.
Bitcoin bids farewell to $80,000
The loss of one round number is not the only issue. Right now, Bitcoin is struggling below its 200-day moving average, which is close to $81,900. One of the chart's most obvious barriers is still that line. Bitcoin briefly moved in that direction but was unable to create a clear breakout, indicating that sellers are still active in the vicinity of higher levels.
Additionally, Bitcoin is vulnerable to another test of the lower moving averages as a result of the rejection. The crucial support zone is currently the 50-day and 100-day moving averages, which are at roughly $74,700 and $76,700. The current decline could continue to be a typical cooling-off phase following the April–May rally if Bitcoin maintains that level.
However, the bullish recovery structure becomes much weaker if the price loses that cluster, making a return to $72,500 or even $70,000 more plausible. After getting close to overbought territory, RSI has also begun to decline. That indicates that the upward momentum has subsided, but it does not prove a complete bearish reversal.

Additionally, volume has not demonstrated a clear bullish expansion, which undermines the credibility of the recent increase. Bulls only need to recover $80,000 before breaking and holding above the 200-day moving average. Without it, Bitcoin is still in the midst of a recovery attempt rather than a verified reversal of trend.
Although the market hasn't crashed, BTC is once again in a defensive position after losing $80,000.
Dogecoin's volume spike
After rising about 50% from its spring lows, Dogecoin is displaying one of the stronger recovery structures among the major altcoins. DOGE is currently trading close to $0.115, surpassing a number of short- and mid-term moving averages and getting closer to a more significant long-term resistance level.
A distinct shift in behavior can be seen in the chart. Dogecoin created a rounded base around the $0.09-$0.10 region after grinding lower for months before breaking higher. Because it depicts sellers progressively losing control, that base is significant.
The 200-day moving average near $0.124 is still the next significant test, but the recent move above the 50-day and 100-day moving averages confirms improving short-term structure. There isn't yet a verified long-term trend reversal for DOGE. The price must rise above the 200-day moving average and remain there for that to occur.

A clear daily close above $0.124 would probably bolster the bullish argument and pave the way for $0.135 and $0.15. These levels correspond to the rejection and consolidation zones from earlier in the year.
Although the RSI is in the vicinity of overbought territory, the rally has not yet reached an extreme level that would render it invalid. During early trend reversals, strong coins can stay high on the RSI. The question of whether volume will sustain the move is more crucial.
The breakout is more credible than the weak sideways action observed in March and April because of the recent volume improvement. The current support ranges from $0.106 to $0.100. The existing rally structure is unaffected as long as DOGE remains above that region. A decline below it would indicate a failure of the breakout.
Although the chart has changed from bearish compression to early bullish expansion, Dogecoin still faces resistance. Whether this spike turns into a true rally will depend on the next movement around the 200-day average.
Toncoin on a breakout stage
After failing to maintain the upper part of its recent breakout, Toncoin is under pressure once more. Earlier in May, TON surged sharply above $2.50, but the move soon lost momentum and the price has since dropped back toward the $2.10 region. That immediately highlights the $2 level.
A classic volatility problem is depicted in the chart. TON started off with a strong impulse move supported by a lot of volume, but the follow-through has since waned. The fact that the price is still higher than the major moving averages indicates that the larger recovery has not completely failed.
But instead of chasing the move higher, the pullback from the spike high indicates that traders are aggressively taking profits. Both technically and psychologically, the $2 zone is now important. The asset may consolidate before making another attempt to move toward $2.30-$2.50 if TON holds above it. In doing so, the breakout structure would survive.

However, the chart may unwind towards the 200-day moving average at $1.75 if TON loses $2 significantly. The 50-day and 100-day moving averages are located in the next support cluster, which is located between $1.55 and $1.60.
After entering overbought territory during the breakout, the RSI has drastically cooled. If the price stabilizes, that reset might be beneficial, but if selling persists and momentum wanes, it becomes a warning sign. The most recent candles indicate that buyers are no longer in complete control.
Although it is now more conditional, the bullish case is still alive. To prevent making the most recent breakout a mistake, TON must defend $2. Because they frequently trap late buyers and intensify downside pressure, failed breakouts are risky.
Although the margin of error has decreased, Toncoin is still above its important moving averages for the time being. The chart would probably change from a controlled pullback to a bearish reversal risk if $2 were lost.
 Dan Burgin