
Disclaimer: The opinions expressed by our writers are their own and do not represent the views of U.Today. The financial and market information provided on U.Today is intended for informational purposes only. U.Today is not liable for any financial losses incurred while trading cryptocurrencies. Conduct your own research by contacting financial experts before making any investment decisions. We believe that all content is accurate as of the date of publication, but certain offers mentioned may no longer be available.
Bulls are back in the game as most of the cryptocurrencies are again under bullish influence. Mainly, all Top 10 coins are located in the green zone.
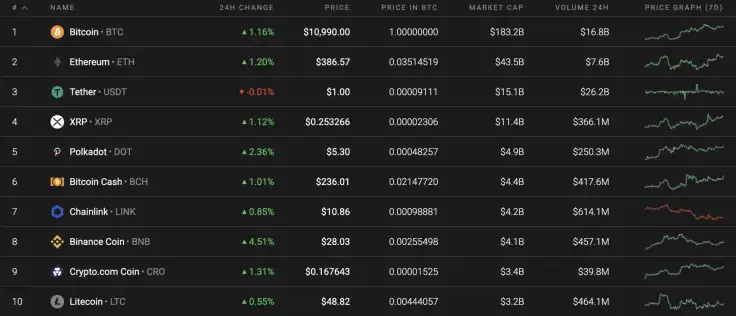
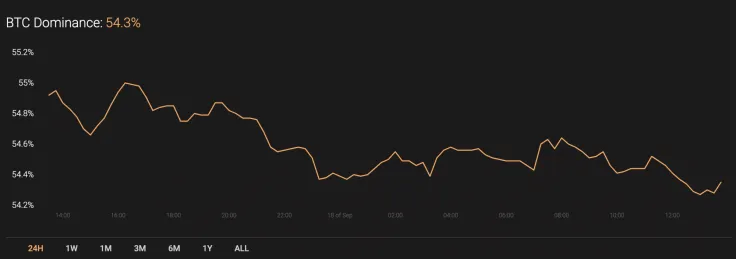
The sharp rise of the altcoins has affected the dominance rate of Bitcoin (BTC), which has declined and is now at 54.3%.
The relevant Bitcoin data today:
-
Name: Bitcoin
Advertisement -
Ticker: BTC
-
Market Cap: $202,975,758,055
-
Price: $10,975.67
Advertisement -
Volume (24h): $27,311,423,903
-
Change (24h): 1.01%
The data is relevant at press time.
BTC/USD: Can bears withstand and get Bitcoin back to $10,500?
Yesterday, in the morning, the price of Bitcoin (BTC) continued to decline. Sellers managed to pierce the daily EMA55, setting a local minimum of around $10,740.
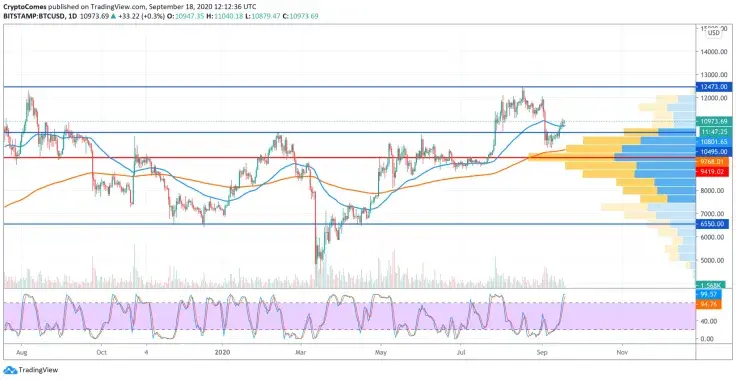
In the afternoon, the pair began to slowly recover and, before the end of the day, it was able to return to the area of $10,900. In the morning, trading volumes decreased significantly, and further recovery to the target level of $11,200 was difficult. If buyers form a bullish momentum today, the pair will break through the level of $11,200, and the daily maximum is possible in the 50% Fibo area ($11,394).
At the same time, the overheating of the market, which is seen on the daily time frame, may not allow the bulls to break through to the target level. In that case, sellers will try to return the pair to the support area of $10,500.
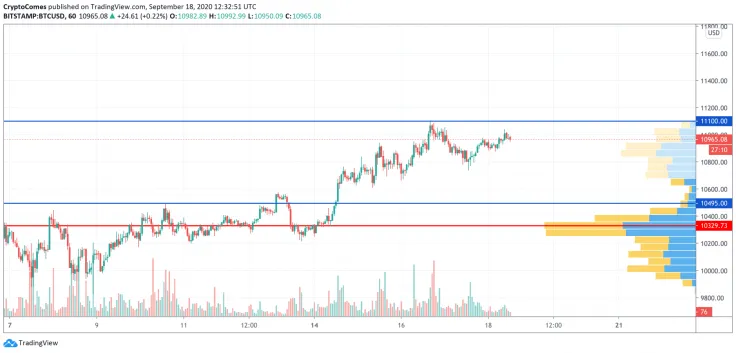
On the hourly chart, Bitcoin (BTC) is likely to retest the $11,100 level after it has successfully bounced off the local support at $11,750. However, buyers have fewer chances to keep the growth as the volume is low, along with the liquidity. In this regard, the more likely price action is the false breakout of $11,100 on the weekend, followed by a decline below $11,000 next week.
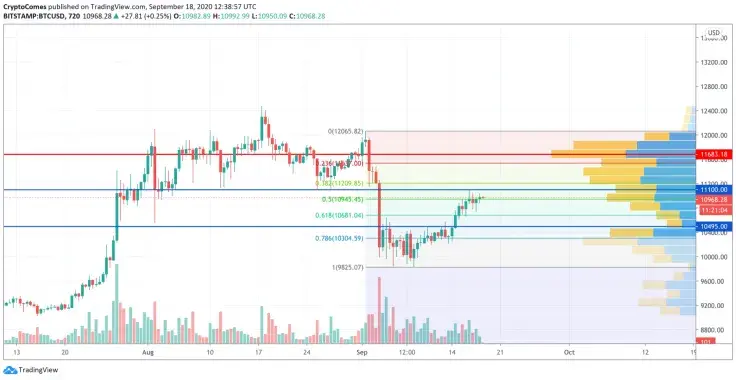
On the 12H time frame, bulls' power is coming to an end as $11,000 is a strong resistance that is unlikely to be broken for the first time. Although liquidity is high, the trading volume is going down slightly, which means that a short-term decline may occur. Applying the Bollinger Bands indicator to the chart, one needs to pay attention to the 61.8% level that refers to $10,681. That may be the endpoint of the correction before a new wave of growth.
Bitcoin is trading at $10,984 at press time.
 Dan Burgin
 U.Today Editorial Team