
Disclaimer: The opinions expressed by our writers are their own and do not represent the views of U.Today. The financial and market information provided on U.Today is intended for informational purposes only. U.Today is not liable for any financial losses incurred while trading cryptocurrencies. Conduct your own research by contacting financial experts before making any investment decisions. We believe that all content is accurate as of the date of publication, but certain offers mentioned may no longer be available.

After momentarily hitting the $725–$730 range, Binance Coin is currently trading around $713 in an effort to maintain one of its biggest upward trends in recent months. The structural shift that underlies the rally is just as significant as the event itself. BNB has clearly surpassed its major moving averages.
The longer-term averages are still grouped around $623–$651, but the 20-day EMA has accelerated to about $668. Most notably, after falling below the 200-day EMA for several months, the price has now recovered it around $651. As a result, the current bullish structure's primary support range is now $650–$670.
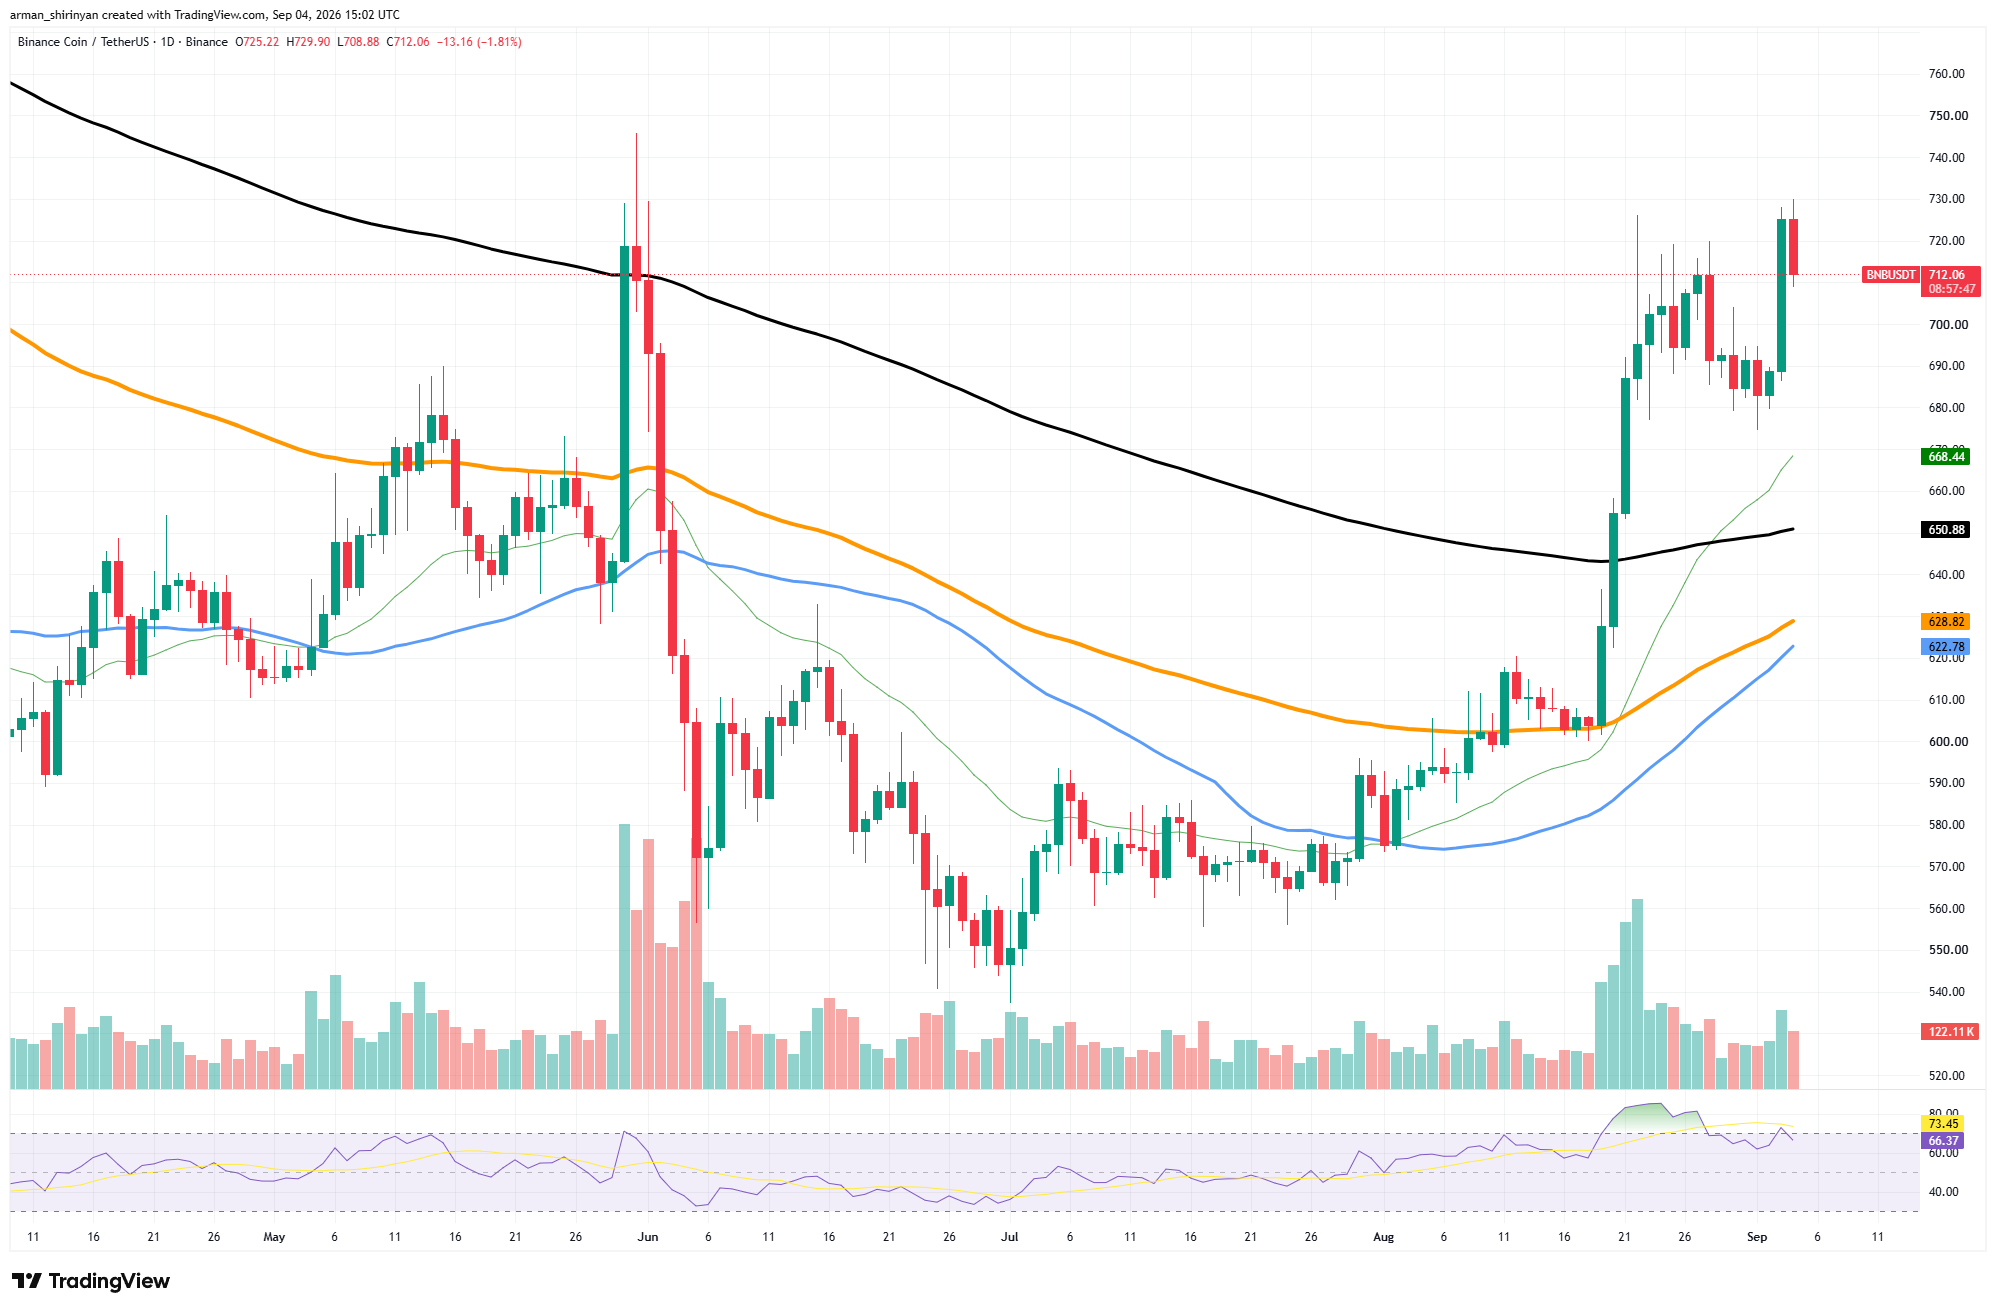
Momentum is the problem right now. After a dramatic increase from roughly $605, BNB is now in overbought territory with an RSI of about 73. Buyers are facing significant opposition, as evidenced by the most recent rejection at $730. Therefore, a short-term correction or sideways consolidation would be typical instead of the breakout being immediately invalidated. $730 is the initial level that bulls must clear.

The path toward $750–$760, where BNB traded prior to its significant June correction, could be opened by a daily close above it. On the other hand, losing $690 would make a retracement toward the 20-day EMA at $668 more likely. But the overall technical structure is still bullish as long as BNB stays above the $650–$670 range.
Uniswap's Trouble
After rising from about $3.20 in mid-August to about $6.25, Uniswap has entered a far more aggressive phase of its recovery. In less than three weeks, UNI has essentially doubled and surpassed all of the daily chart's major moving averages. Particularly significant was the breakout above the $4.00–$4.20 cluster.
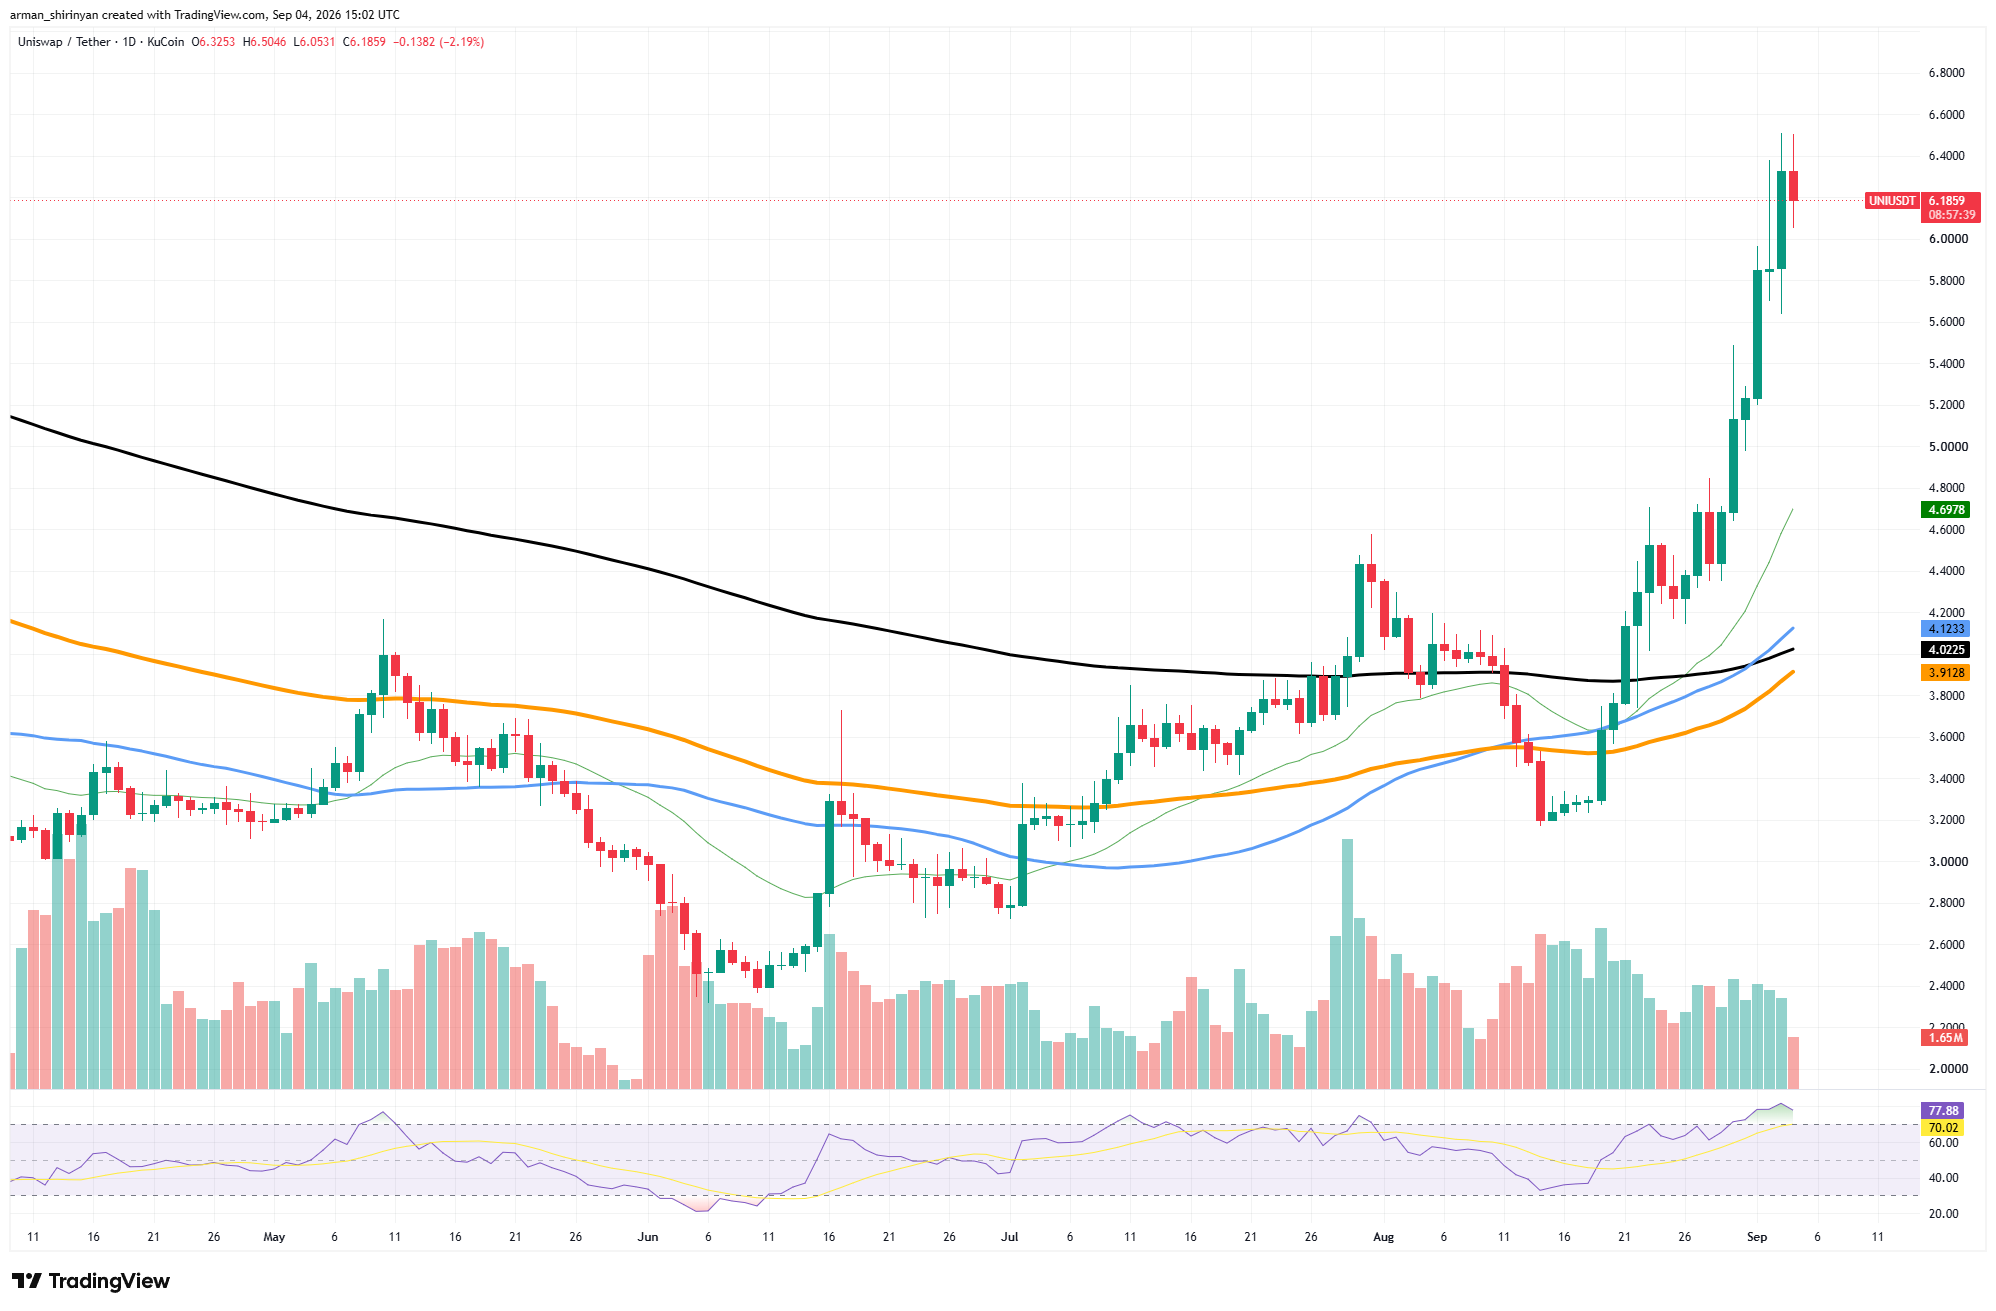
UNI then showed exceptionally strong buying pressure as it cleared $4.70, $5.20, and $5.80 with little consolidation. The other major averages are still between $3.91 and $4.12, but the 20-day EMA has already increased to roughly $4.70. The main short-term risk is also generated by that separation.

The daily RSI has reached about 80, and UNI is currently about 33% above its 20-day EMA. As a result, the market is significantly overbought, and the most recent candles between $6.25 and $6.50 show the first indications of hesitation. Price discovery would continue to move toward $6.80 and possibly $7.00 with a clear breakout above $6.50.
Instead, a cooldown toward $5.80–$6.00 could result from failing to clear that area. The deeper support is located between $5.20 and $4.70. Although UNI is still technically bullish, there is a significantly higher short-term correction risk when following a vertical advance.
Gram Misses the Memo
Despite multiple attempts to create a bottom between $1.30 and $1.35, Gram is still stuck in a bearish market structure. GRAM is trading below all of the major moving averages visible on the daily chart at around $1.36, so buyers are unable to confirm a sustainable reversal.
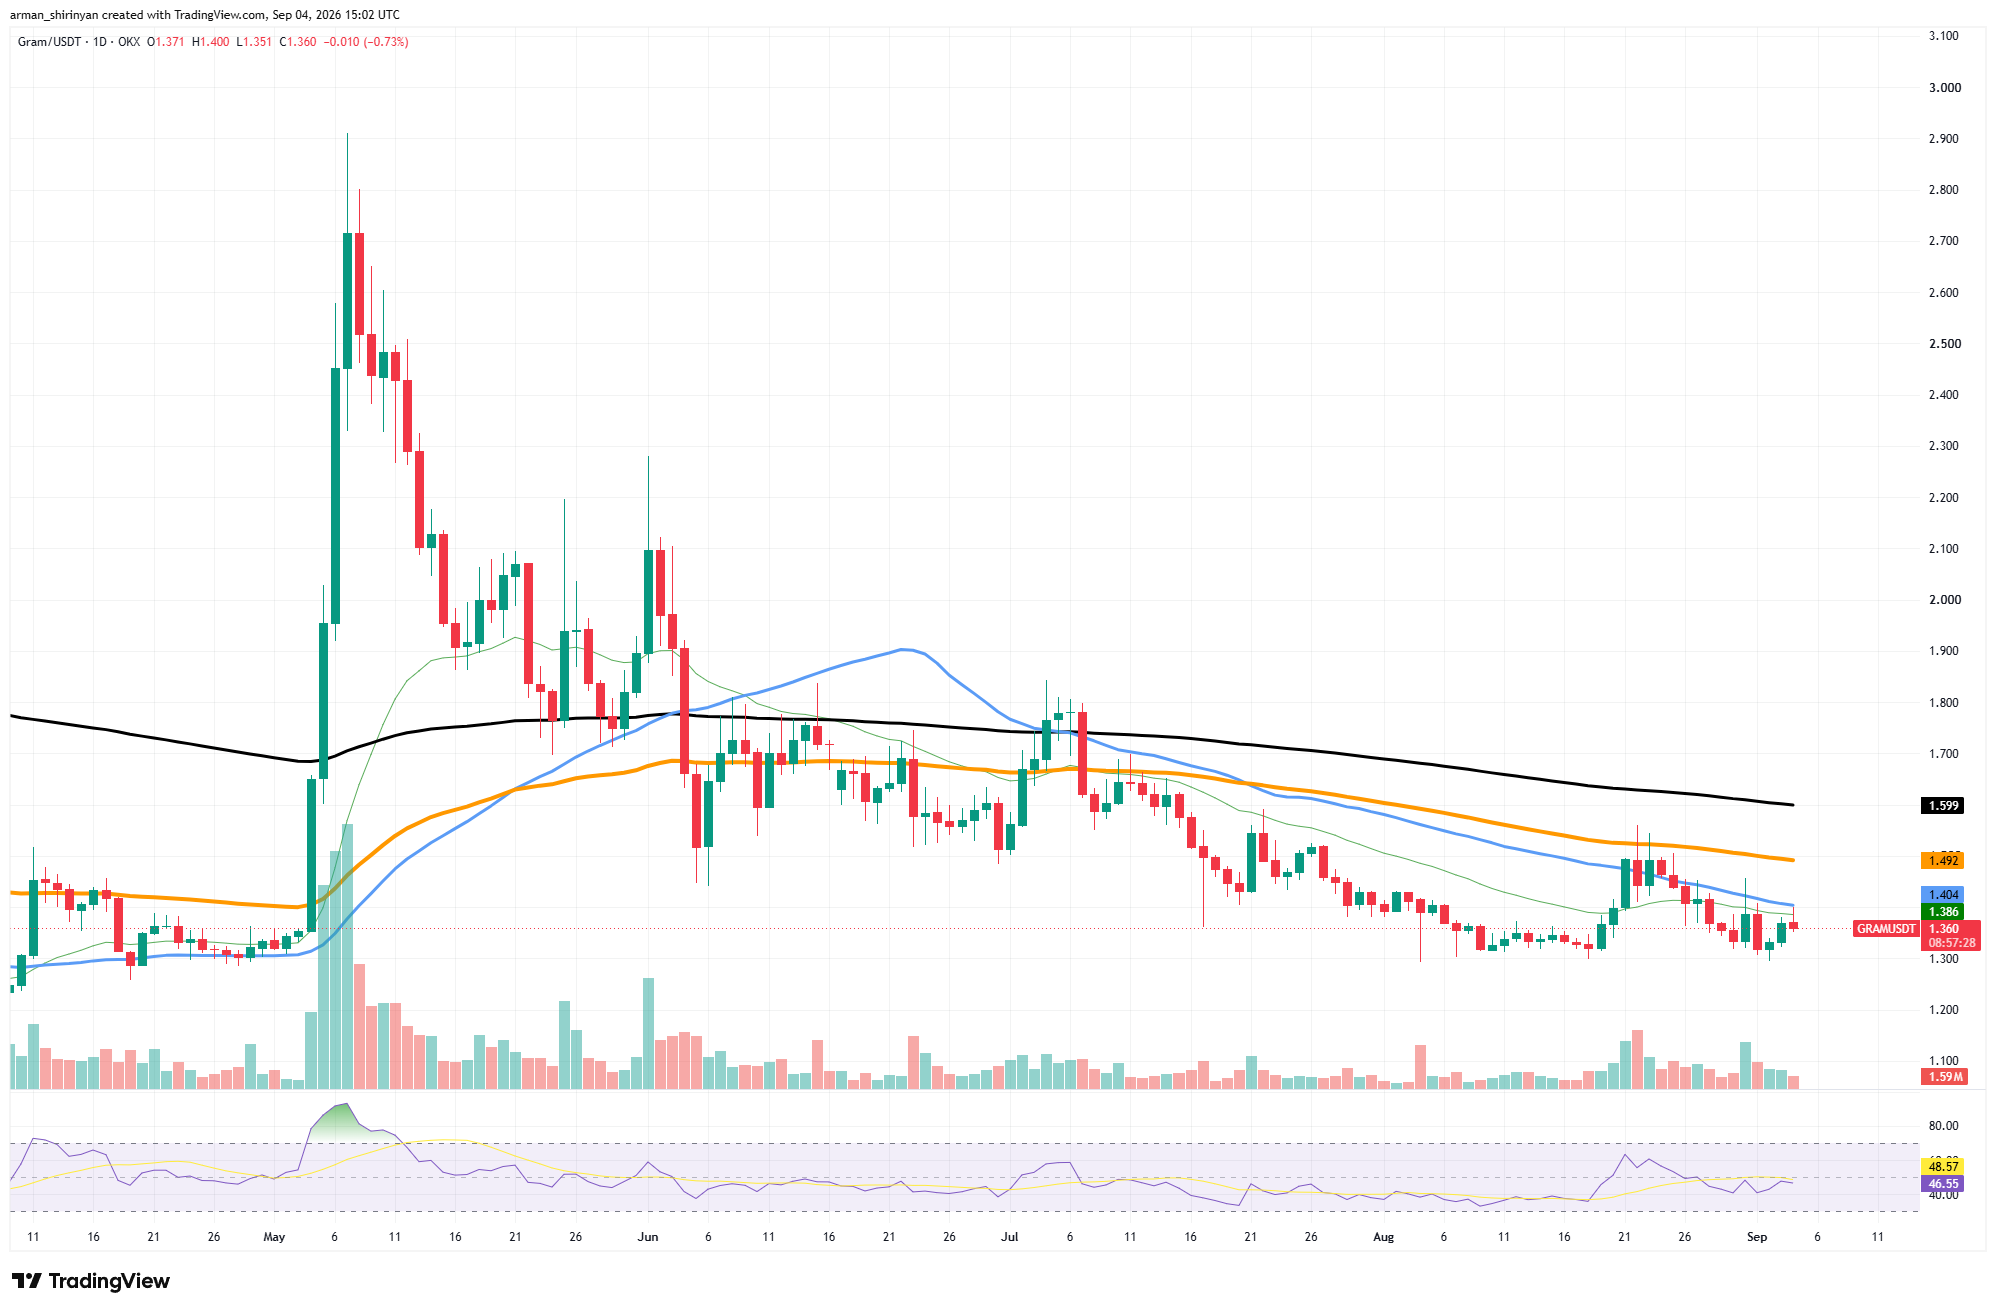
The closest technical barrier is the 20-day EMA at $1.39, which is closely followed by another moving average at $1.40. In late August, GRAM made a brief comeback toward $1.50, but sellers rejected the move and drove the asset back toward its known support level. The August recovery appears to have been more of a relief rally than a broader trend reversal, based on the inability to sustain that breakout.

Momentum remains in a neutral to bearish position. The daily RSI is at about 47, which gives buyers plenty of room to move in either direction but indicates that they are not strong enough to take the lead right now. Additionally, volume has significantly decreased in comparison to the explosive activity during GRAM's May rally.
GRAM must first recover $1.40 and then break the $1.49–$1.50 resistance area in order to make a significant comeback. The 200-day EMA at $1.60 becomes the main technical target after that. On the downside, a further loss of $1.30 would reveal about $1.25 and possibly set new local lows.
Chainlink's Short Pause
After its explosive August breakout, Chainlink is continuing to maintain a much stronger technical structure. After rising from about $8.20 to over $12 in just two weeks, LINK is currently trading at about $11.58. LINK passed its major moving averages, including the 200-day EMA at $9.83, thanks to the rally. Instead of giving up the breakout right away, the price has since consolidated between roughly $11.00 and $12.00, which is positive after such a rapid expansion.
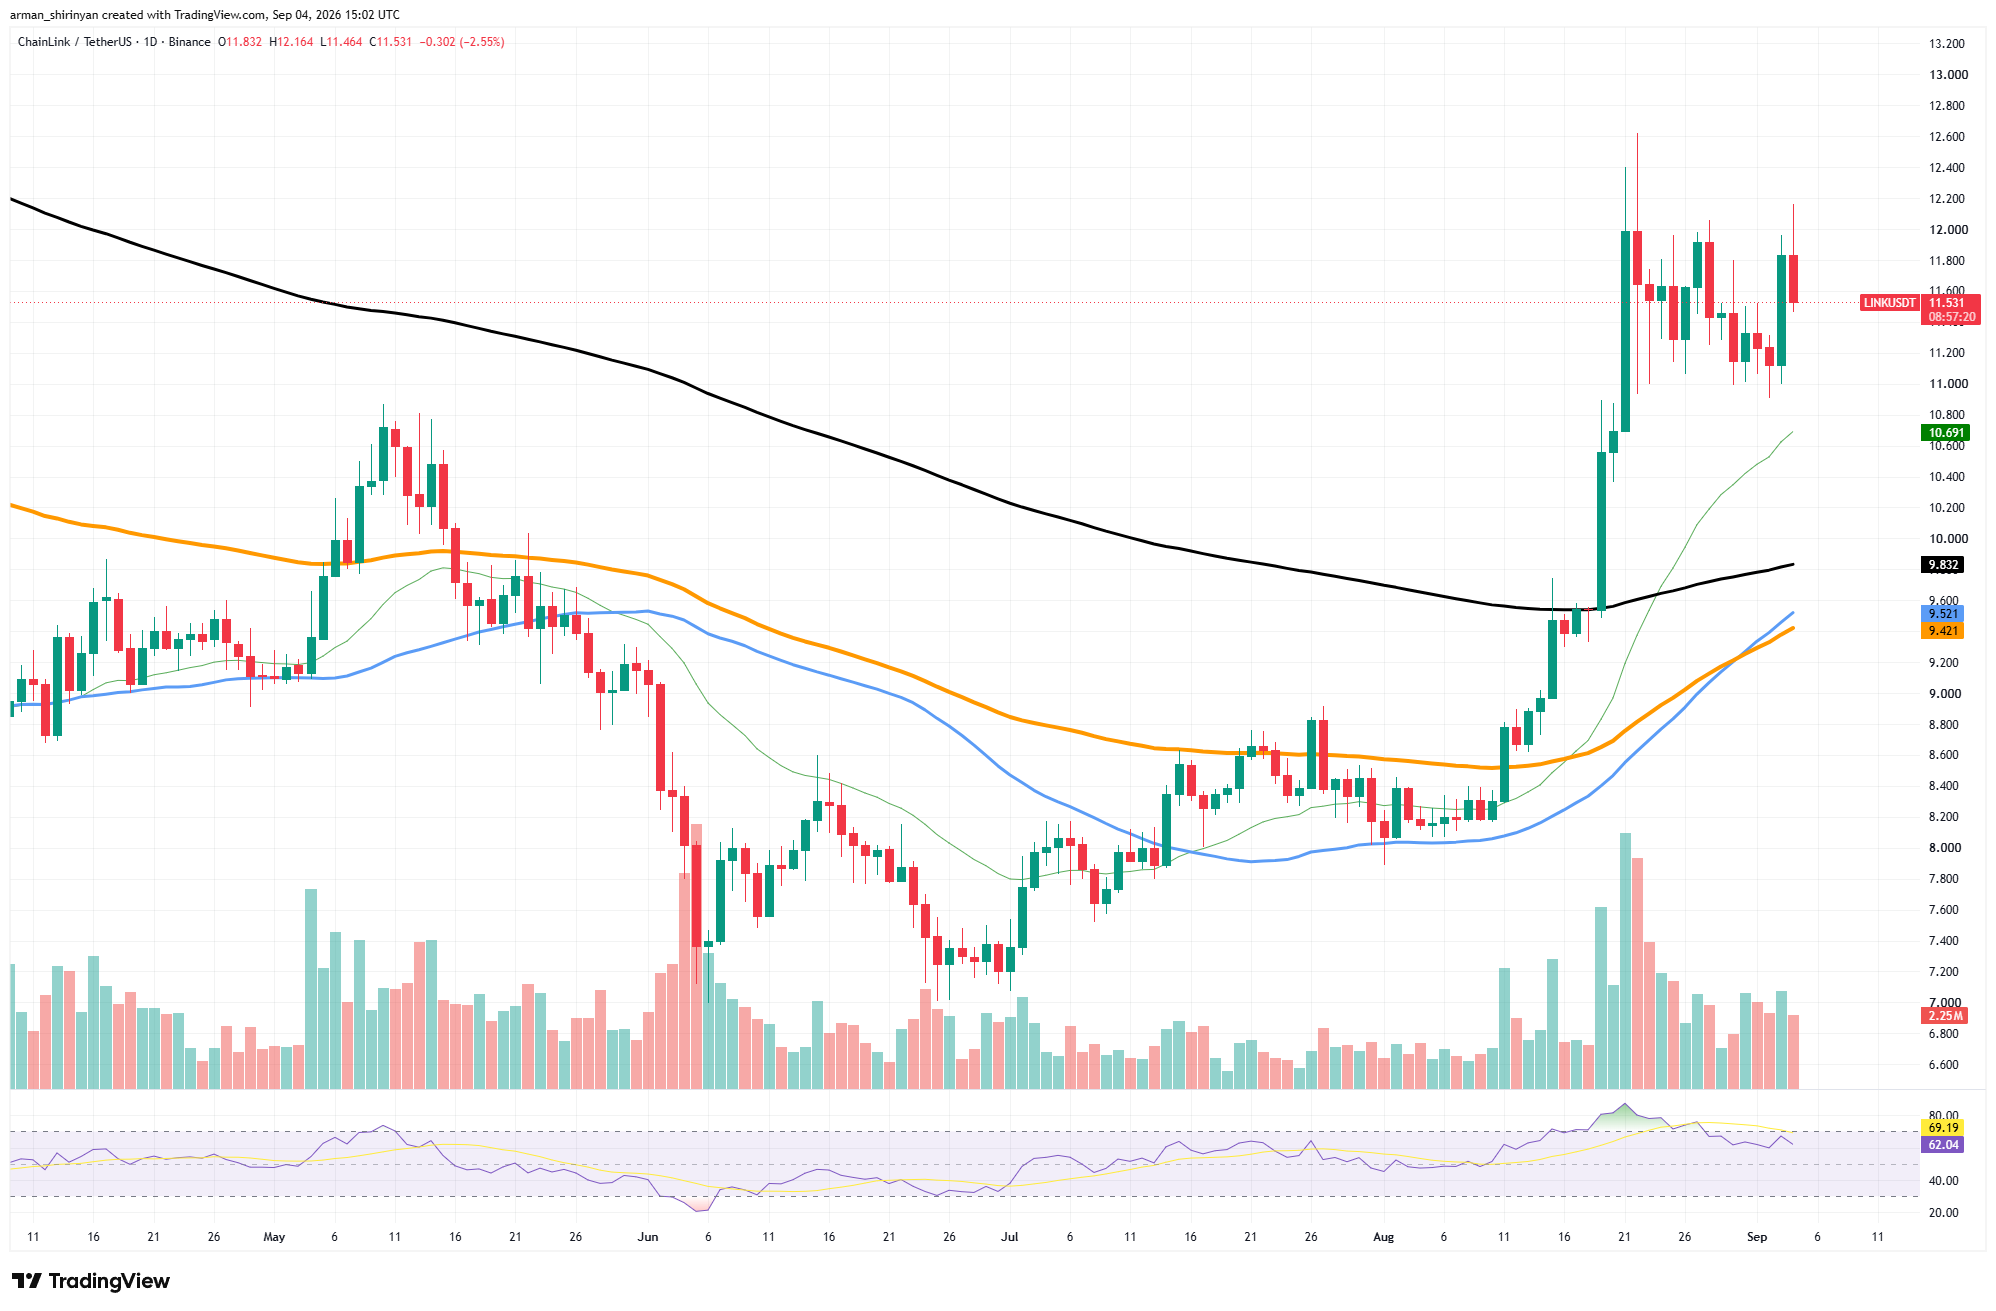
The price is still comfortably above the rising 20-day EMA at roughly $10.69, while the daily RSI has dropped from overbought territory toward 63. This maintains the bullish structure while mitigating some of the overheating produced during the initial breakout. Right now, the primary resistance is between $12.00 and $12.20.

With upper wicks reaching as high as roughly $12.60, LINK has frequently struggled in this area. Therefore, the path toward $12.60 and $13.00 could be reopened by a confirmed close above $12.20. $11.00 is the significant downside level. A retest of the 20-day EMA around $10.70 would become more probable if it were lost.
Below that, the stronger structural support zone around the reclaimed 200-day EMA is represented by $9.80–$10.00. The August breakout is still technically intact unless LINK drops back below that area.
 Dan Burgin
 U.Today Editorial Team
