Disclaimer: The opinions expressed by our writers are their own and do not represent the views of U.Today. The financial and market information provided on U.Today is intended for informational purposes only. U.Today is not liable for any financial losses incurred while trading cryptocurrencies. Conduct your own research by contacting financial experts before making any investment decisions. We believe that all content is accurate as of the date of publication, but certain offers mentioned may no longer be available.
With more than 100 billion SHIB tokens moving in a single day, Shiba Inu has seen a significant on-chain shift, resulting in a 26% increase in exchange netflows. The abrupt increase highlights a significant change in market activity, which reflects growing investor caution or repositioning, as well as the diminishing supply of SHIB on exchanges.
SHIB outflows
The exchange netflow chart illustrates how large this spike was. A net inflow of 23.1 billion SHIB was recorded on Sept. 30, following weeks of comparatively low flows. This was a dramatic change from previous negative readings. This implies that sizable amounts of SHIB were sent to exchanges, perhaps in anticipation of potential short-term volatility or opportunities for profit-taking.
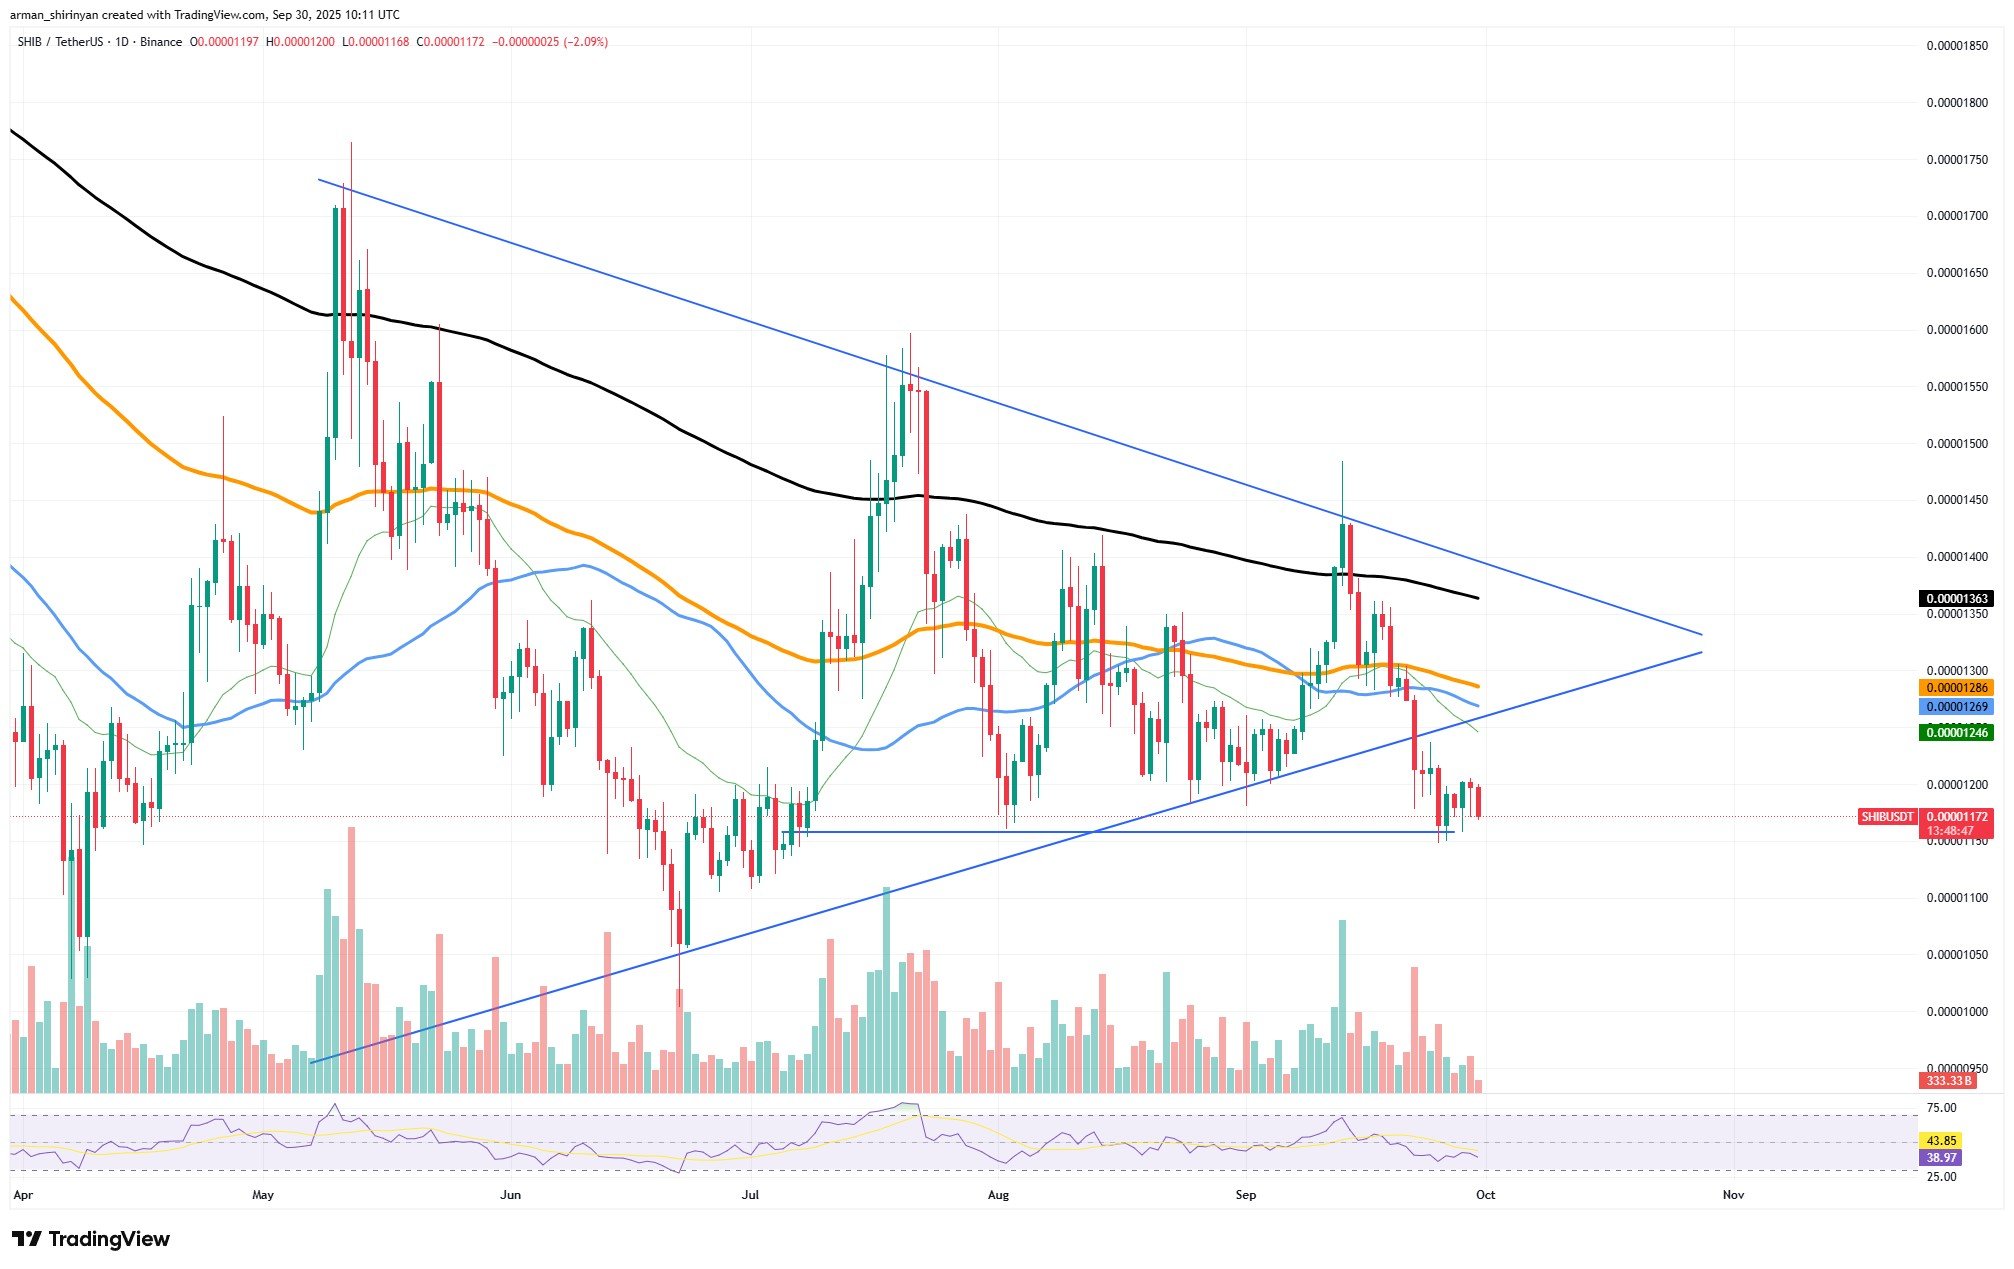
The overall trend, however, indicates that exchange reserves are steadily declining in spite of the inflow, which means that there are fewer tokens available on centralized trading platforms than there were in previous months. On the daily chart, SHIB is still trapped in a narrowing symmetrical triangle pattern, hovering around 0.0000117 from a price action perspective.
Shiba Inu not yet bullish
Despite sellers' repeated attempts to test support in the $0.0000110-$0.0000115 range, buyers have thus far avoided a malfunction. The $0.0000128-$0.0000136 zone continues to have strong overhead resistance, which is supported by significant moving averages, such as the 100-day and 200-day EMAs. However, there is not much evidence of bullish conviction in volume trends.
The RSI, which is located between 39 and 45, indicates waning momentum and the lack of trading activity. The market may dip lower toward the $0.0000100 support area unless SHIB can recover its moving averages with more robust capital inflows.
On-chain, the story of thinning supply has two sides. The recent large inflow indicates that some investors are getting ready for short-term selling, even though fewer tokens on exchanges typically indicate stronger long-term holder conviction.
 Dan Burgin