

Disclaimer: The opinions expressed by our writers are their own and do not represent the views of U.Today. The financial and market information provided on U.Today is intended for informational purposes only. U.Today is not liable for any financial losses incurred while trading cryptocurrencies. Conduct your own research by contacting financial experts before making any investment decisions. We believe that all content is accurate as of the date of publication, but certain offers mentioned may no longer be available.

Exchange-flow data indicates that a significant number of SHIB tokens are moving toward trading platforms rather than away from them, indicating that Shiba Inu may be under additional selling pressure. At a time when SHIB is already having difficulty maintaining its recent recovery, the most recent data indicate an unfavorable short-term imbalance. The key figure is derived from average exchange flows.
SHIB inflows are here
At the moment, the mean exchange outflow is only 364.95 million SHIB, while the mean exchange inflow is roughly 1.4396 billion SHIB per transaction. This means that, on an average transaction basis, inflows are nearly four times greater than outflows. Similar conclusions can be drawn from the top-10 flow data.
The total value of the ten biggest inflow transactions is approximately 5.98 billion SHIB, while the largest outflows total only 2.33 billion SHIB. Additionally, the volume of exchange inflows is approximately 401.26 billion SHIB, while the volume of outflows is 317.72 billion SHIB. When coins enter exchanges, they are not always immediately sold. SHIB may be transferred by investors for collateral, trading, or other purposes.

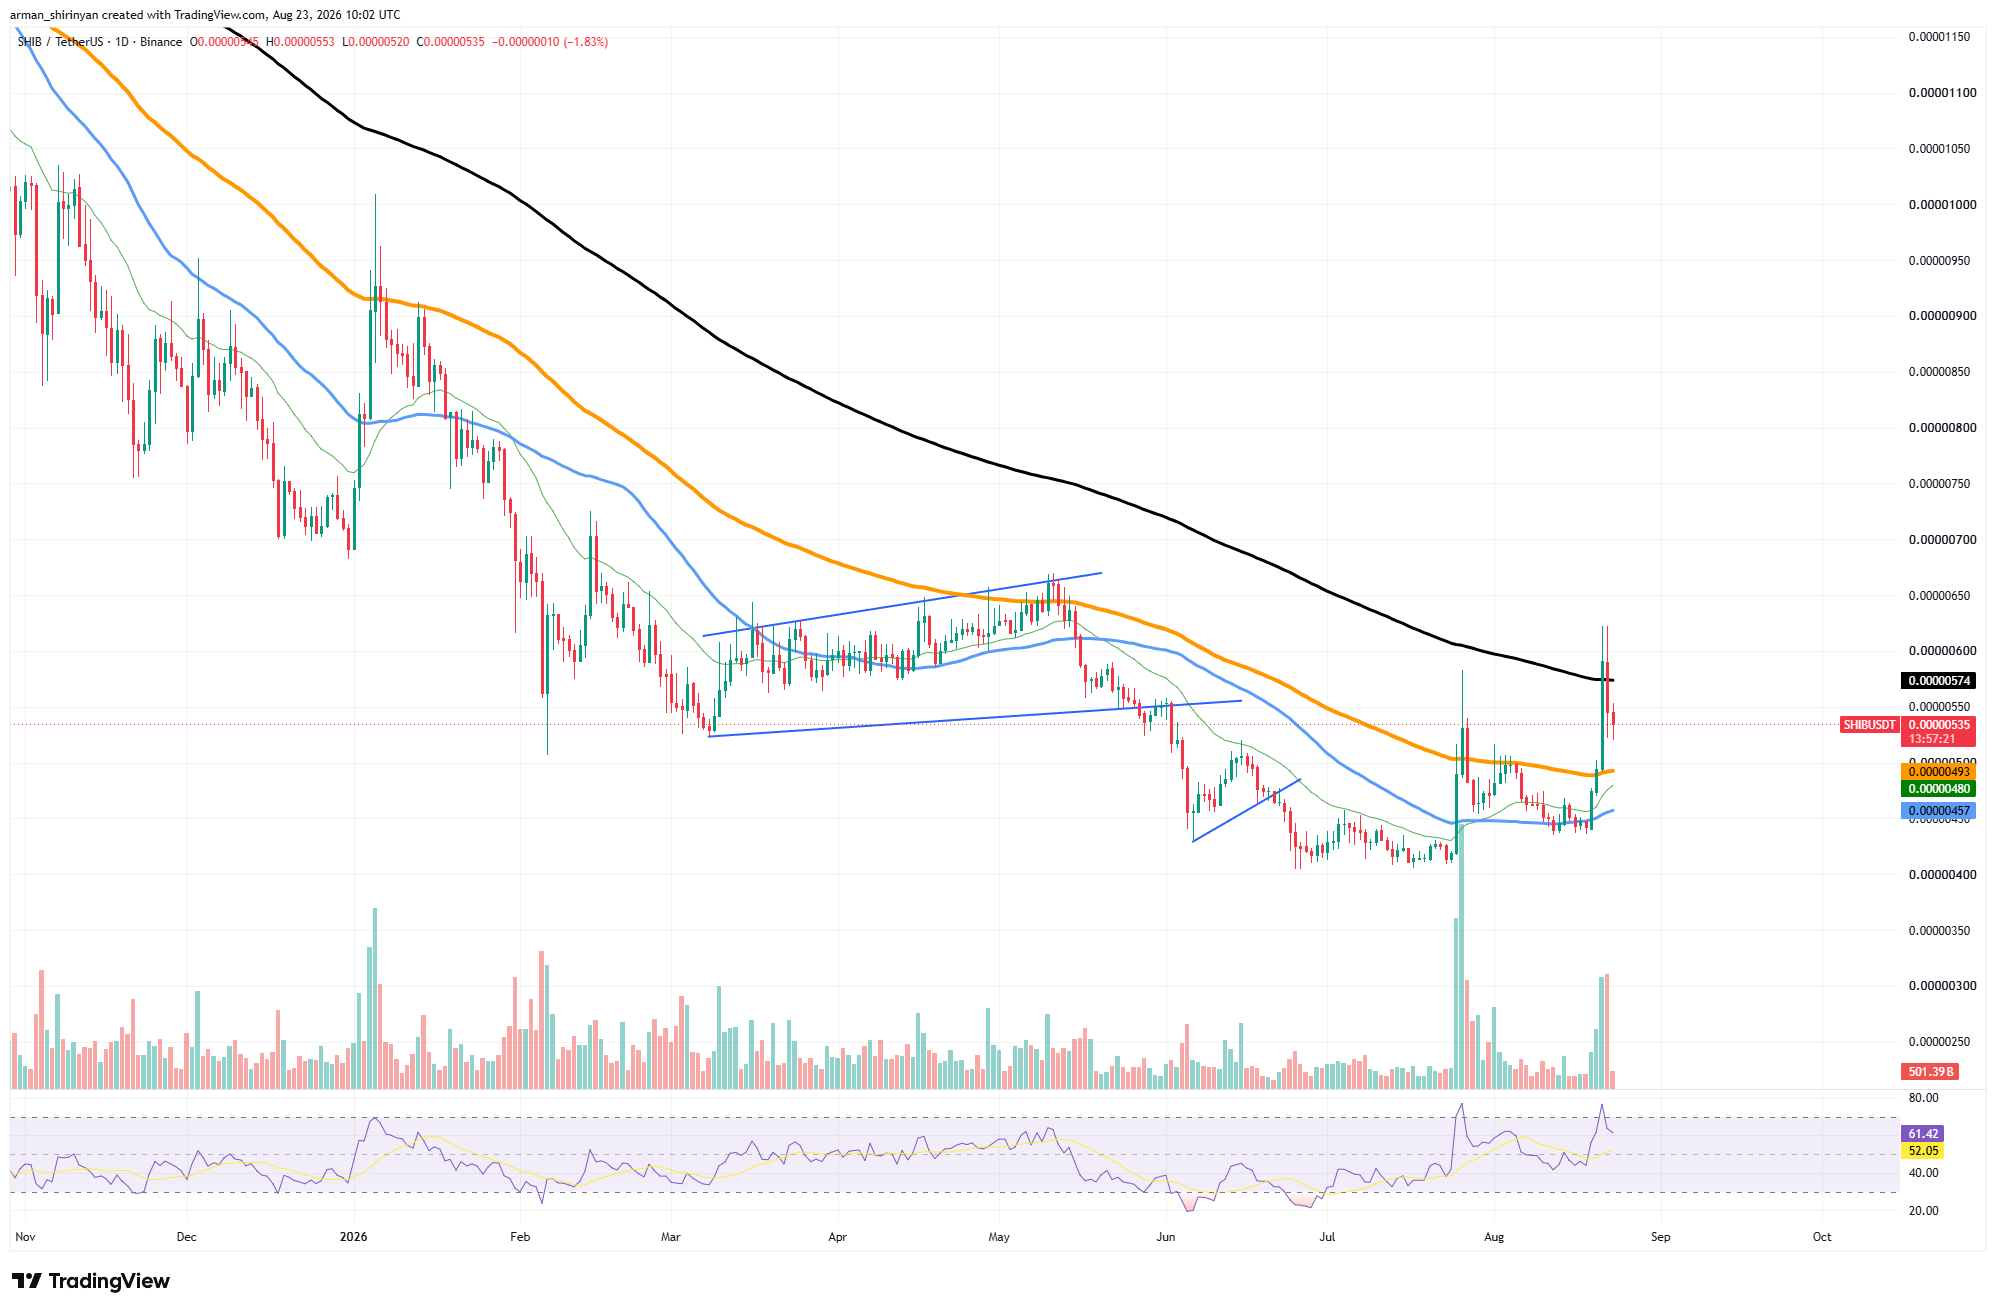
On the other hand, when inflows significantly outpace outflows, expanding exchange availability typically increases potential sell-side liquidity. The price chart underscores the significance of that imbalance. SHIB failed to sustain its recent surge above $0.000006. Since then, the token has returned to about $0.00000534, with the current daily candle down roughly 2%.
SHIB unable to breakthrough
Additionally, SHIB was unable to break above the long-term moving average around $0.00000574, which continues to be the main technical barrier. Despite the recent recovery, this rejection leaves the larger trend unresolved. Some positive signs remain, however.
While an RSI near 61 suggests that momentum is still somewhat bullish rather than exhausted, SHIB stays above the shorter moving averages around $0.00000457–$0.00000493. For bulls, the breakout structure would be restored by reclaiming $0.00000574 and then $0.000006. If this is not achieved, exchange-side pressure could become more significant.
Around $0.0000049 is the first significant downside support area, followed by roughly $0.0000046. Exchange flows are currently skewed toward deposits, meaning SHIB will need to absorb the extra supply that could become available for sale.
 U.Today Editorial Team
 Dan Burgin
