
Disclaimer: The opinions expressed by our writers are their own and do not represent the views of U.Today. The financial and market information provided on U.Today is intended for informational purposes only. U.Today is not liable for any financial losses incurred while trading cryptocurrencies. Conduct your own research by contacting financial experts before making any investment decisions. We believe that all content is accurate as of the date of publication, but certain offers mentioned may no longer be available.
After one of its biggest drops in 2026, XRP is making an effort to stabilize, but pressure remains on the larger trend. The asset is currently attempting to establish a local bottom close to the $1.10 area after breaking out of a multi-month consolidation pattern and falling below a number of important support levels.
According to the daily chart, XRP recently lost the crucial support zone at $1.28, which served as a floor for the majority of March, April, and May. Before buyers intervened, sellers swiftly accelerated the decline after that level gave way, driving the token toward lows around $1.05. The resulting bounce has been modest thus far, indicating that despite the initial attempt at recovery, market participants are still cautious. Technically speaking, there is still significant resistance overhead for XRP.
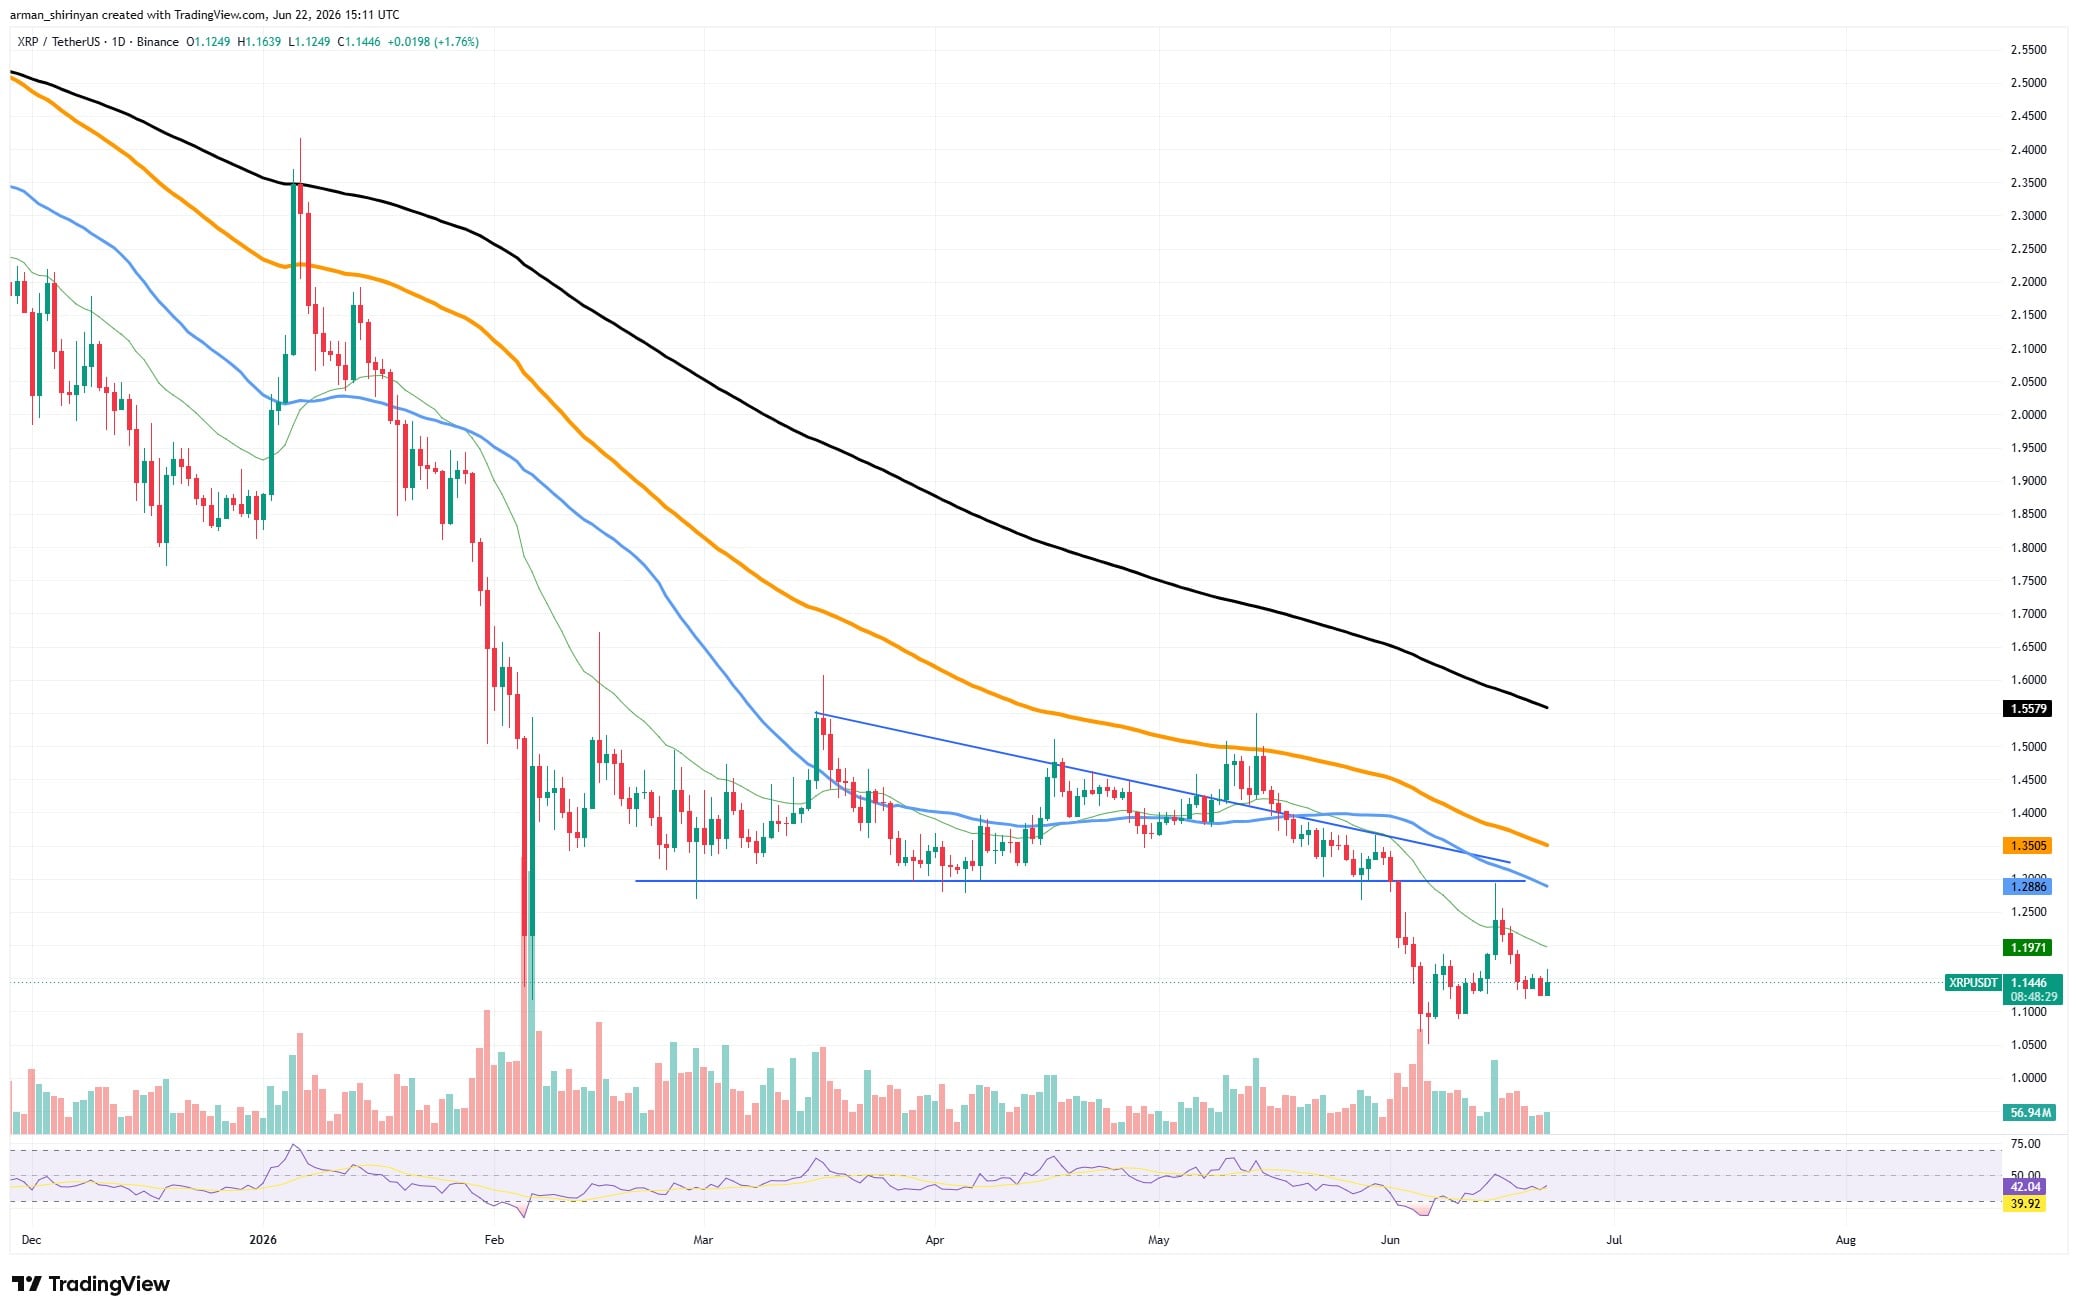
The 100-day and 200-day moving averages are still significantly higher at $1.28 and $1.35, respectively, while the 50-day moving average is close to $1.20. This alignment demonstrates that bears are still in control of the broader trend. XRP must regain these levels and turn them back into support for any significant recovery. A slightly more positive signal is provided by volume behavior.
A significant rise in trading activity coincided with the breakdown, suggesting that a significant amount of selling pressure may have already been absorbed. Volume has steadily returned to normal since hitting its most recent low, indicating that panic selling is waning. Additionally, momentum indicators suggest stabilization as opposed to ongoing capitulation. After emerging from oversold territory, the Relative Strength Index is currently making an effort to rise.
This suggests that the downward momentum has diminished in comparison to the initial selloff, but it does not ensure a reversal. The $1.20 region continues to be traders' immediate focus. The case for a more widespread relief rally toward $1.28 might be strengthened by a successful push above this level. However, XRP would be open to another test of recent lows if it failed to break higher.
Dogecoin's zero removal potential
Dogecoin, the well-known meme coin, may be getting close to a critical point where a "zero removal rally" becomes feasible, even though it is currently far below its cycle highs. DOGE's current price structure indicates that the asset is entering a zone where long-term investors are starting to pay attention again, even though such a move is not imminent.
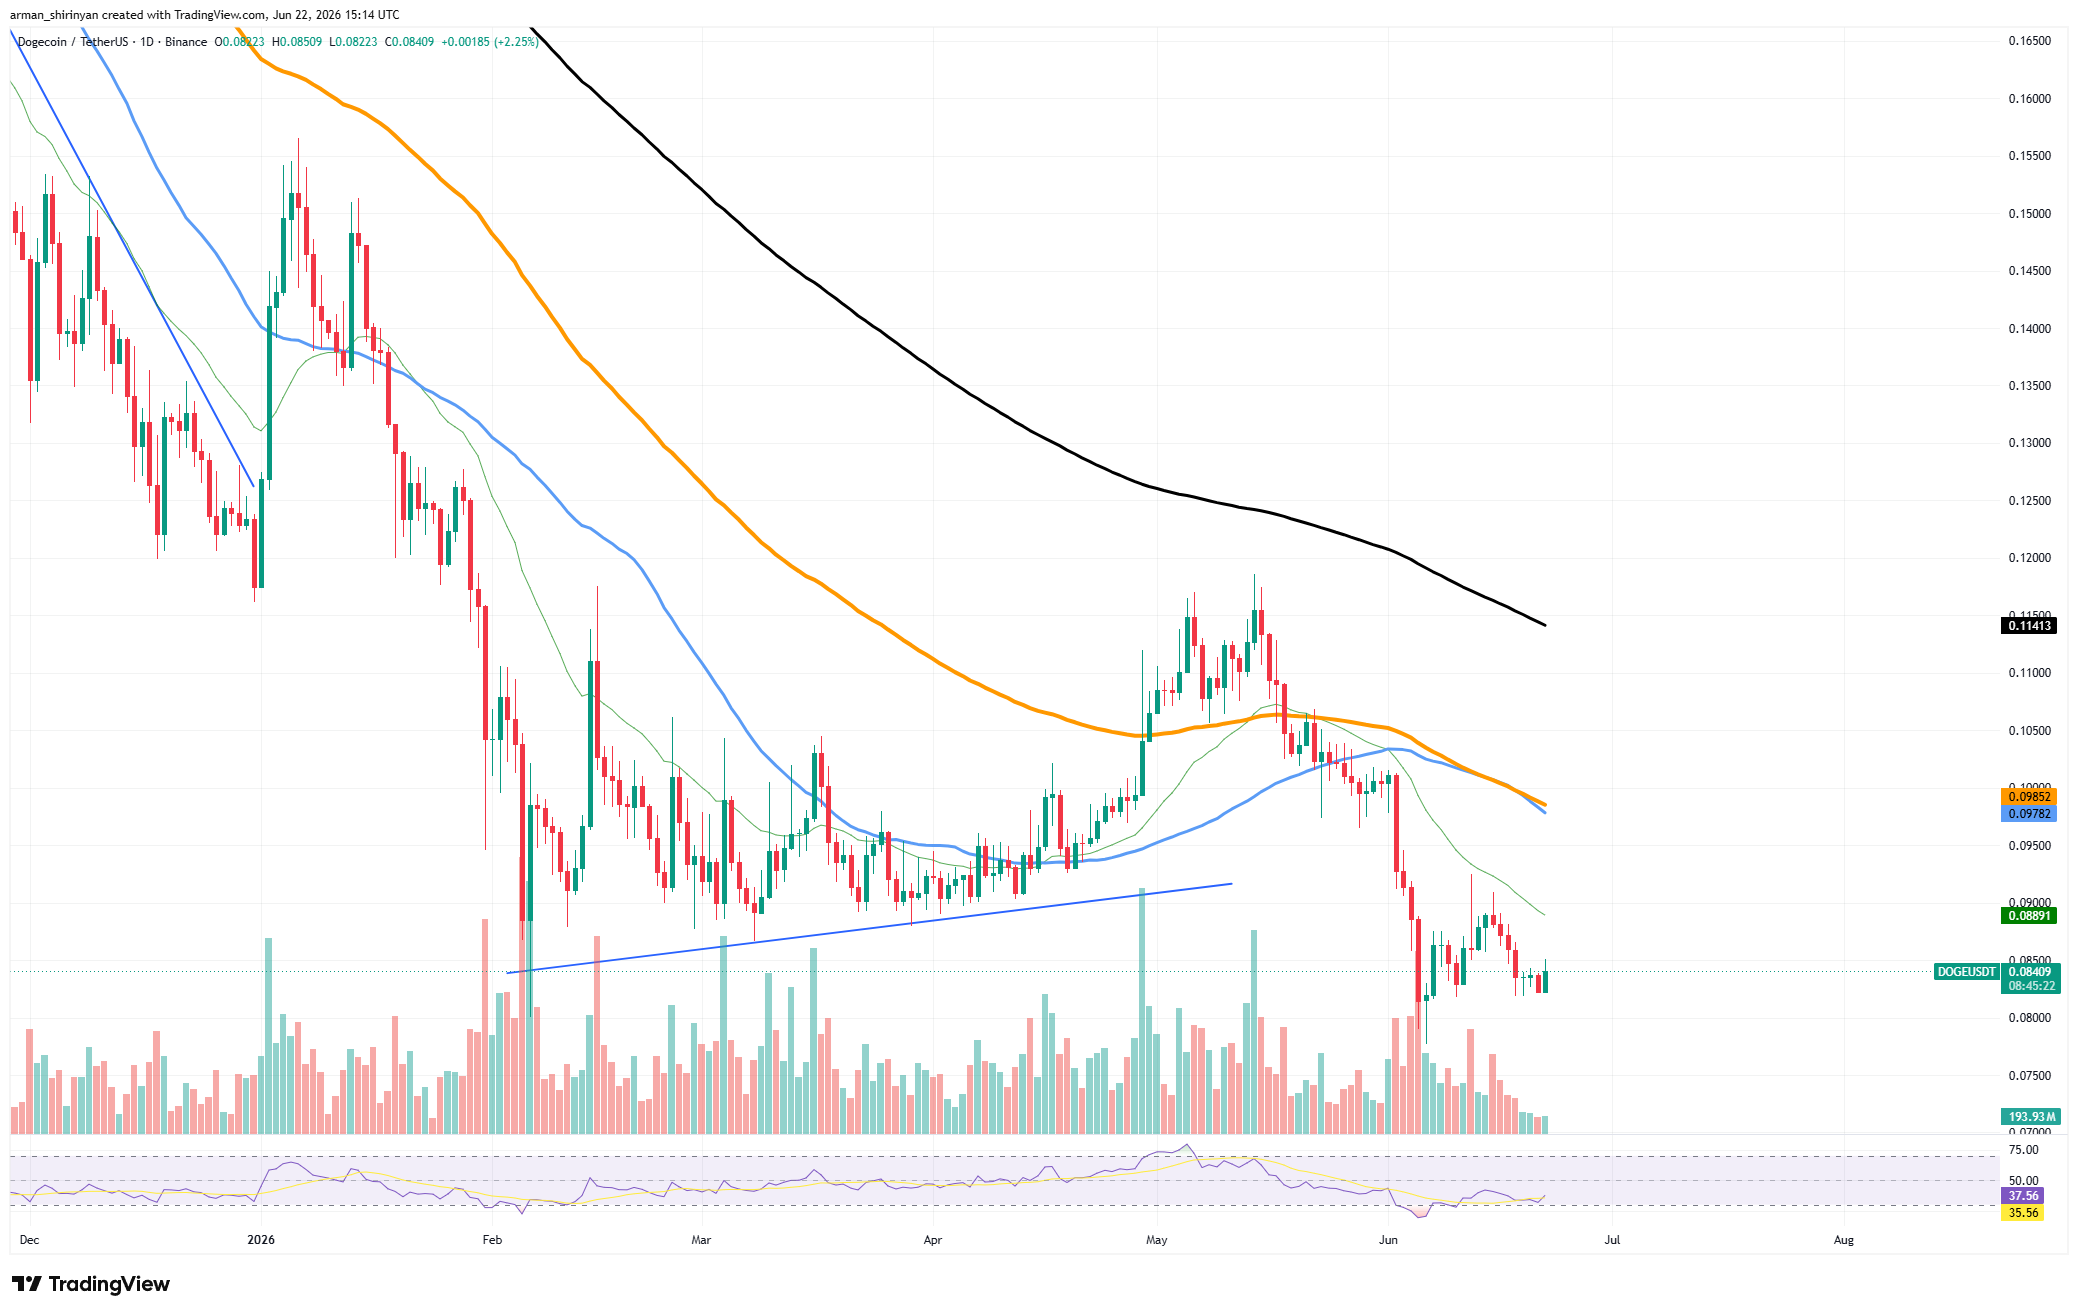
As of this writing, DOGE is trading close to $0.084 following a protracted decline that has largely eliminated the excitement that was present earlier in the year. Another round of selling pressure was triggered when the asset recently broke below a rising support trendline that had been forming since February.

Bears haven't been able to significantly push DOGE below the $0.08 area despite the breakdown, suggesting that buyers are still active at lower levels. Technically, the chart is still not very strong.
A classic indication that the overall trend is still negative is that DOGE is still trading below its 50-, 100-, and 200-day moving averages. Stronger barriers still exist around $0.098 and $0.114, but the 50-day moving average near $0.089 now serves as immediate resistance. There are some early indicators, though, that the selloff might be slowing down.
Following the recent crash, the Relative Strength Index approached oversold territory and has since stabilized. Additionally, there was a noticeable increase in volume during the decline, indicating that a considerable amount of weak-handed selling may already have taken place.
The term "zero removal rally" describes DOGE's eventual recovery of the psychologically significant $0.10 level, thereby eliminating one zero from the price structure.
Shiba Inu faces more risks
As its technical structure continues to deteriorate, Shiba Inu is under increasing downside pressure. SHIB remains one of the weaker large-cap meme assets, despite the fact that the overall cryptocurrency market has begun to stabilize after recent volatility. Several indicators point to continued elevated risks.
The daily chart gives a worrying impression. A multi-month rising channel that had been forming since March was recently broken by SHIB. Although that pattern had previously supported several rebounds, the most recent breakdown invalidated the bullish structure and led to a precipitous selloff.

Since then, SHIB has found it difficult to generate sufficient buying pressure to recover lost ground. SHIB is still below all major moving averages, currently trading close to $0.0000047. The 100-day and 200-day averages are even higher, at $0.0000055 and $0.0000057, respectively, than the 50-day moving average, which is located around $0.0000050.
This bearish alignment shows that sellers continue to benefit from both short-term and long-term momentum. After the recent crash, a small rising wedge has emerged, which is one of the more concerning developments. When such formations emerge during broader bearish trends, they more often resolve to the downside, though they can occasionally support recovery attempts.
Since SHIB is currently testing that pattern's lower bound, the upcoming sessions are especially crucial. Additionally, volume does not produce a strong bullish signal. Despite an increase in activity during the initial decline, buying volume has not significantly increased during the recovery attempt.
This implies that traders are still cautious and that short covering rather than genuine accumulation may be the primary driver of recent upward movements. Even though the Relative Strength Index recovered from oversold conditions earlier this month, it is still below the neutral 50 level. Although this indicates waning bearish momentum, a sustained trend reversal has not yet been confirmed.
The immediate goal for SHIB bulls is to hold above $0.0000050 and regain the 50-day moving average. The token remains susceptible to another decline toward recent lows in the absence of that rebound. The bearish trend that has dominated much of 2026 could be reinforced if SHIB breaks below the current support.
 U.Today Editorial Team
 Dan Burgin