
Disclaimer: The opinions expressed by our writers are their own and do not represent the views of U.Today. The financial and market information provided on U.Today is intended for informational purposes only. U.Today is not liable for any financial losses incurred while trading cryptocurrencies. Conduct your own research by contacting financial experts before making any investment decisions. We believe that all content is accurate as of the date of publication, but certain offers mentioned may no longer be available.

A major XRP breakout may be approaching after a difficult first half of the year, during which the token lost 27.1% in Q1 and another 22.4% in the second. Technical charts and seasonal data have now produced a rare alignment for the breakout to happen.
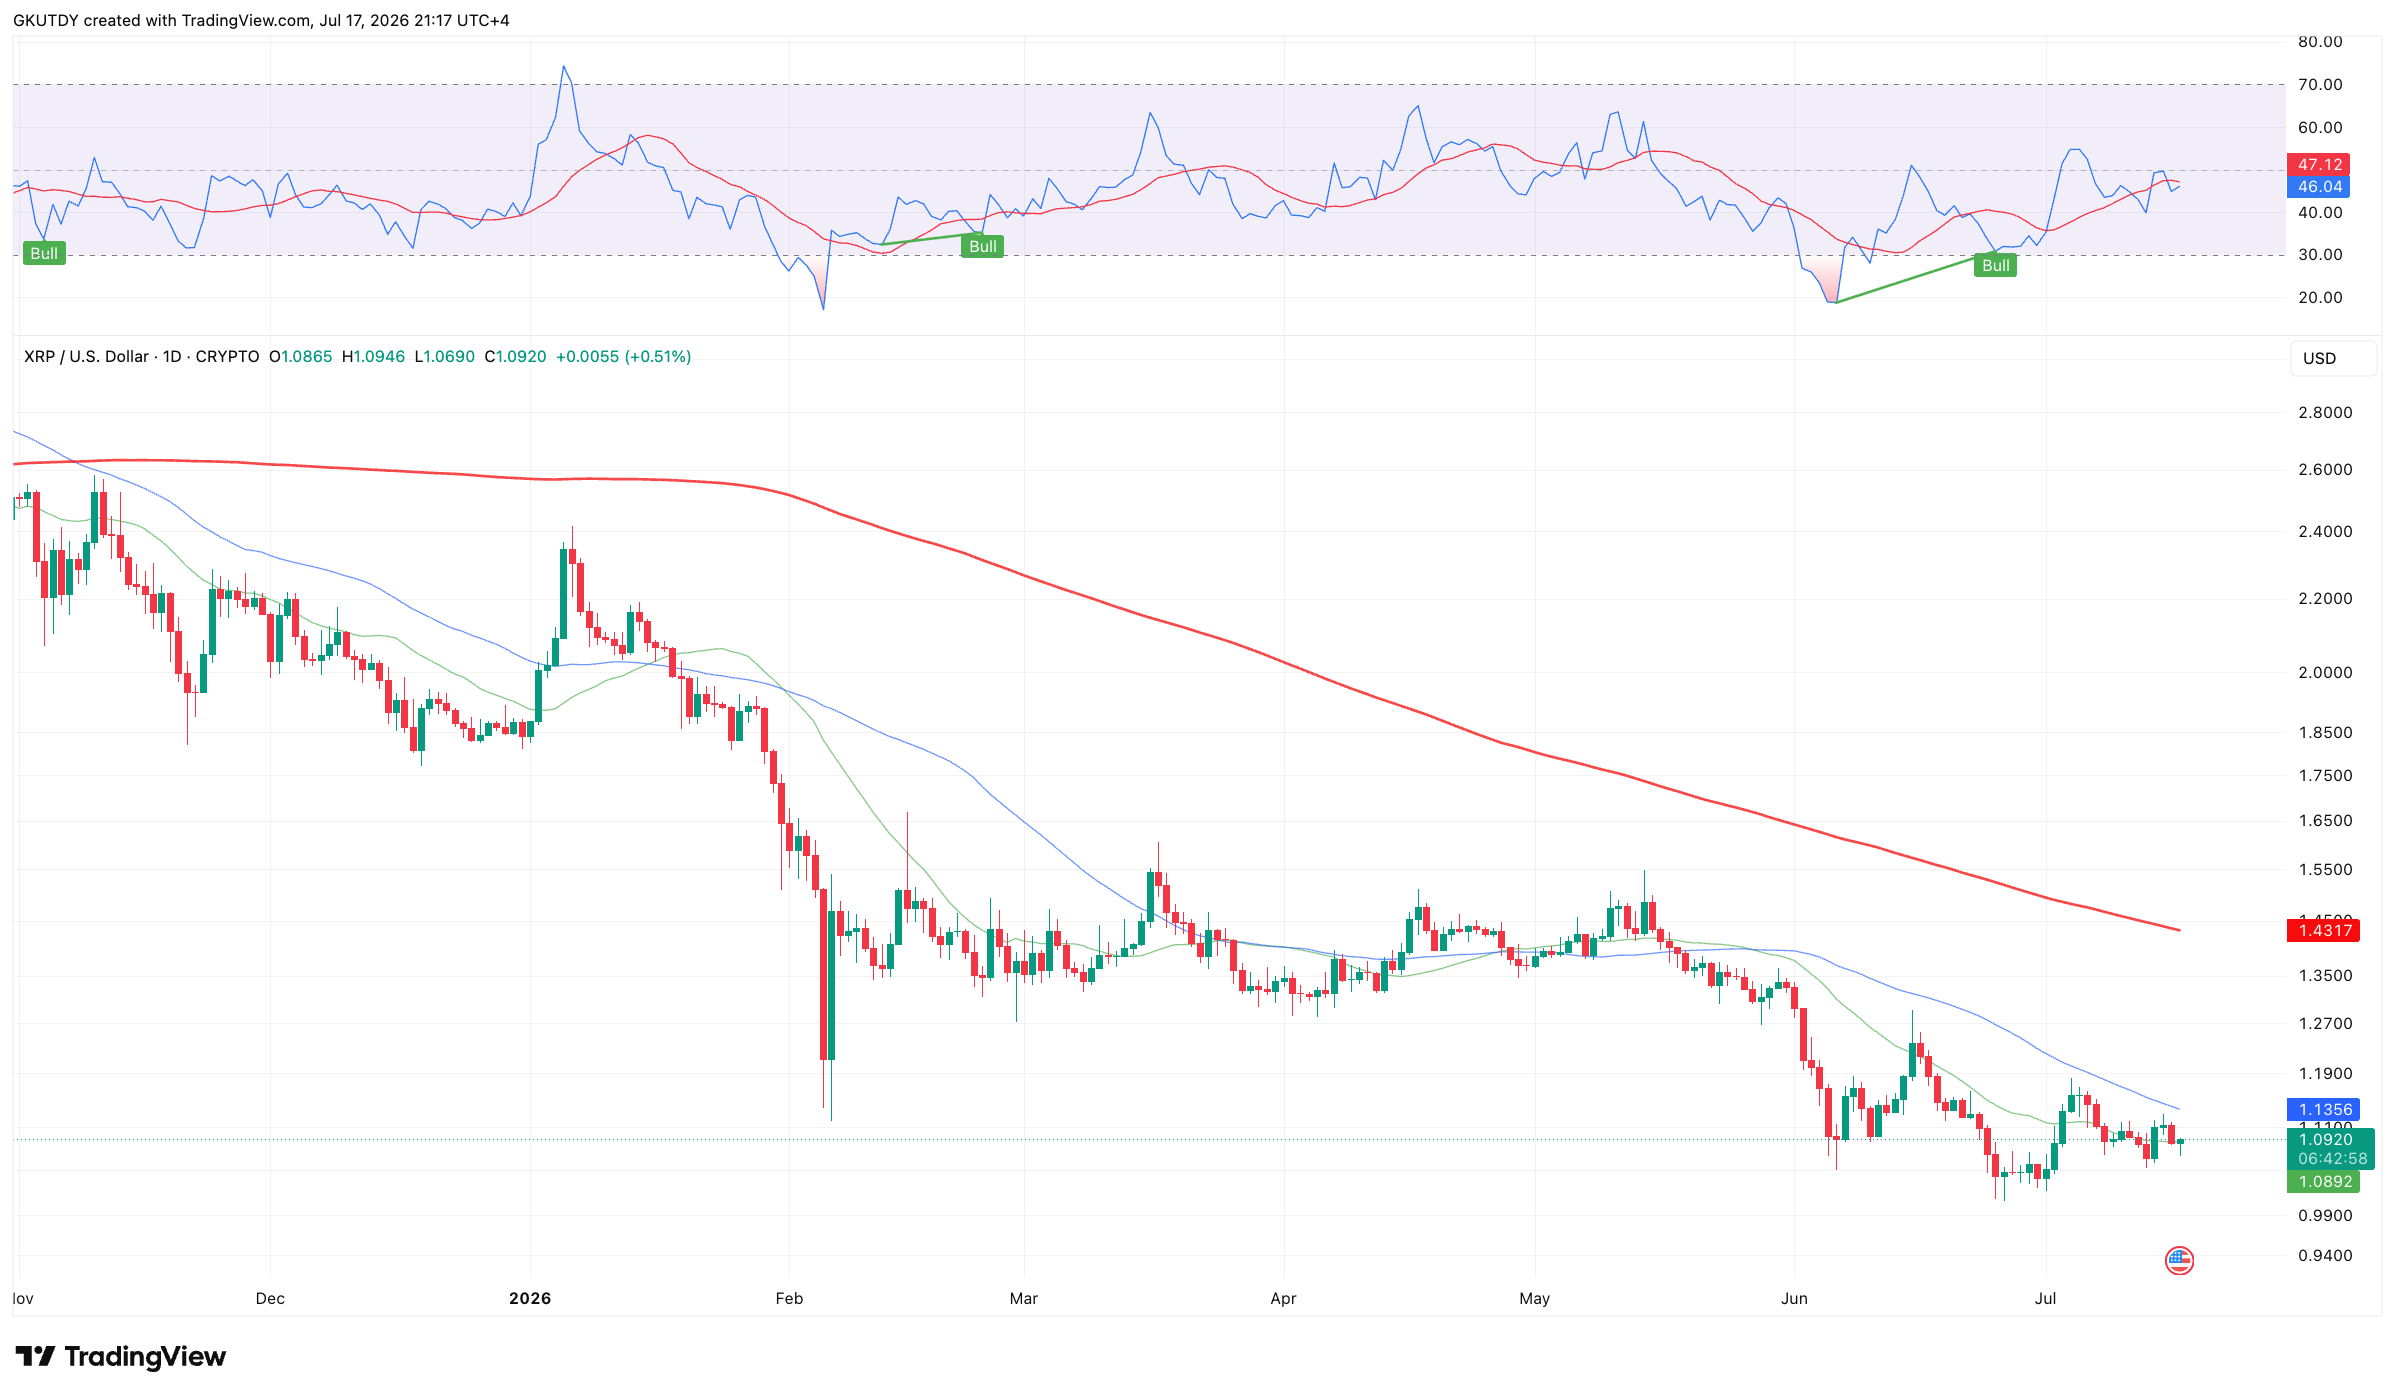
On the daily TradingView chart, XRP is trapped inside a descending broadening wedge, a pattern considered a classic late-stage accumulation formation. The exhaustion of selling pressure is also confirmed by the RSI indicator, which has formed a bullish divergence, while buyers continue to defend the local bottom at $1.05.
Historical data from CryptoRank confirms that Q3 has traditionally been the most stable period of the year for XRP. Over the past seven years, Q3 has not closed in negative territory once.

July's current return remains a modest 4.19%, but historical cycles show that the token regularly uses the middle of summer to recover from sharp June declines. XRP fell 22.1% in June 2026. In July 2023, following an early-summer decline, the token delivered a 47.6% rally, while a similar reversal in July 2025 generated a 35% return for investors.
Given the median Q3 return of 25.8%, the price spring compressed over the past six months has accumulated significant mathematical upside potential.
XRP road to $1.60: What could stall the reversal ahead of Q4
XRP is currently trading near $1.08 and, to confirm a breakout from the wedge and trigger a new growth wave, buyers must break through and secure the price above the $1.12–$1.18 resistance zone.
A successful breakout above this wall would open the way toward medium-term targets in the $1.45–$1.60 range, representing projected upside of roughly 50%.
An immediate move higher could be limited by broader market stagnation and a temporary slowdown in inflows into US spot XRP ETFs. Nevertheless, the current consolidation inside the wedge is creating a strong base ahead of Q4, when XRP's average historical return reaches a record 133.3%.
 Dan Burgin
 U.Today Editorial Team
