

Disclaimer: The opinions expressed by our writers are their own and do not represent the views of U.Today. The financial and market information provided on U.Today is intended for informational purposes only. U.Today is not liable for any financial losses incurred while trading cryptocurrencies. Conduct your own research by contacting financial experts before making any investment decisions. We believe that all content is accurate as of the date of publication, but certain offers mentioned may no longer be available.

After losing its short-term ascending channel support, Shiba Inu is still stuck in a structurally vulnerable setup. Even though the downward momentum has somewhat slowed near local lows, the most recent breakdown demonstrates that sellers still control the overall trend.
In April and early May, price action was supported by a narrow recovery wedge, which SHIB recently failed to hold above. The token swiftly fell below the short-term moving averages after the lower boundary broke, losing the small bullish structure it had managed to establish during the recovery effort.
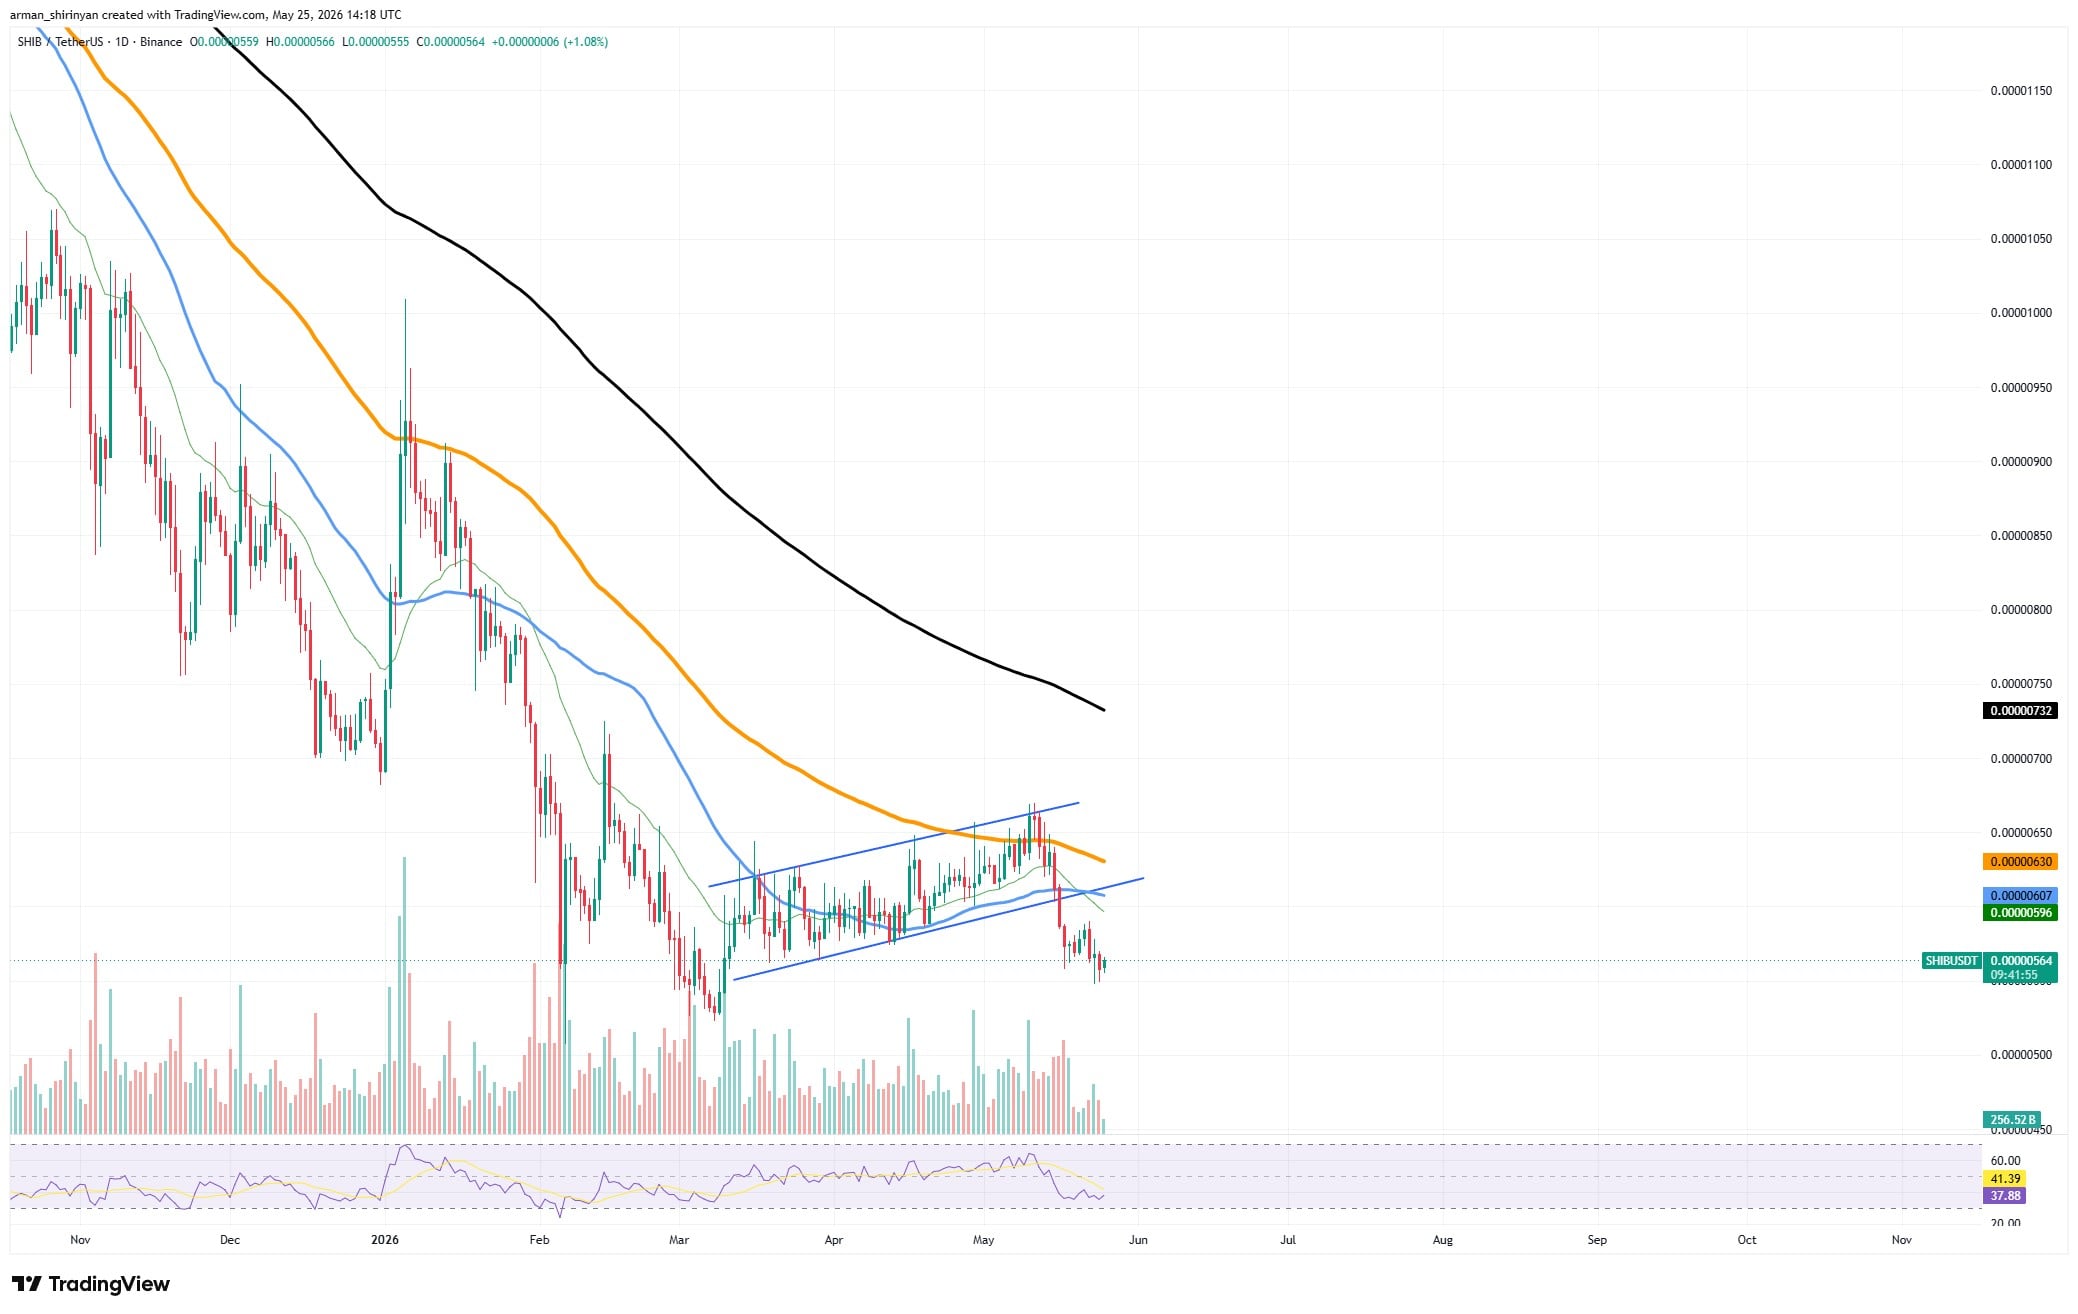
The market is currently looking for support in the vicinity of $0.00000550. For bulls, the issue is that volume is still lackluster. The rapid fading of bounce attempts indicates that traders are still using rallies as chances to lower exposure rather than make aggressive accumulations. Additionally, the RSI is in weak territory, close to the low 40s, indicating that momentum is waning but not yet reaching fully oversold levels.
In theory, SHIB is now at risk of going into a more extensive reset phase. The token may return to previous accumulation zones close to the psychological $0.00000500 area if sellers continue to apply pressure below the broken channel. That level becomes crucial because SHIB would be vulnerable to a much greater structural decline if it were to disappear.
Reclaiming the moving average resistance cluster around $0.00000600-$0.00000630 and rebounding inside the previous ascending structure are necessary for any bullish reversal to become feasible. Bears are still favored by trend continuation until that point.
XRP's momentum wanes
After failing to maintain momentum above falling resistance, XRP is getting close to a crucial support test. Although the asset is still consolidating within a compressed range, the chart is starting to look more like a bearish continuation structure than a recovery breakout.
Repetitive rejection close to the 50-day moving average at $1.47 is the main problem. Lower highs continue to form beneath the declining trendline, and every attempt at a rally into that zone has rapidly weakened. Concurrently, the price continues to move in the direction of horizontal support in the $1.30 area.
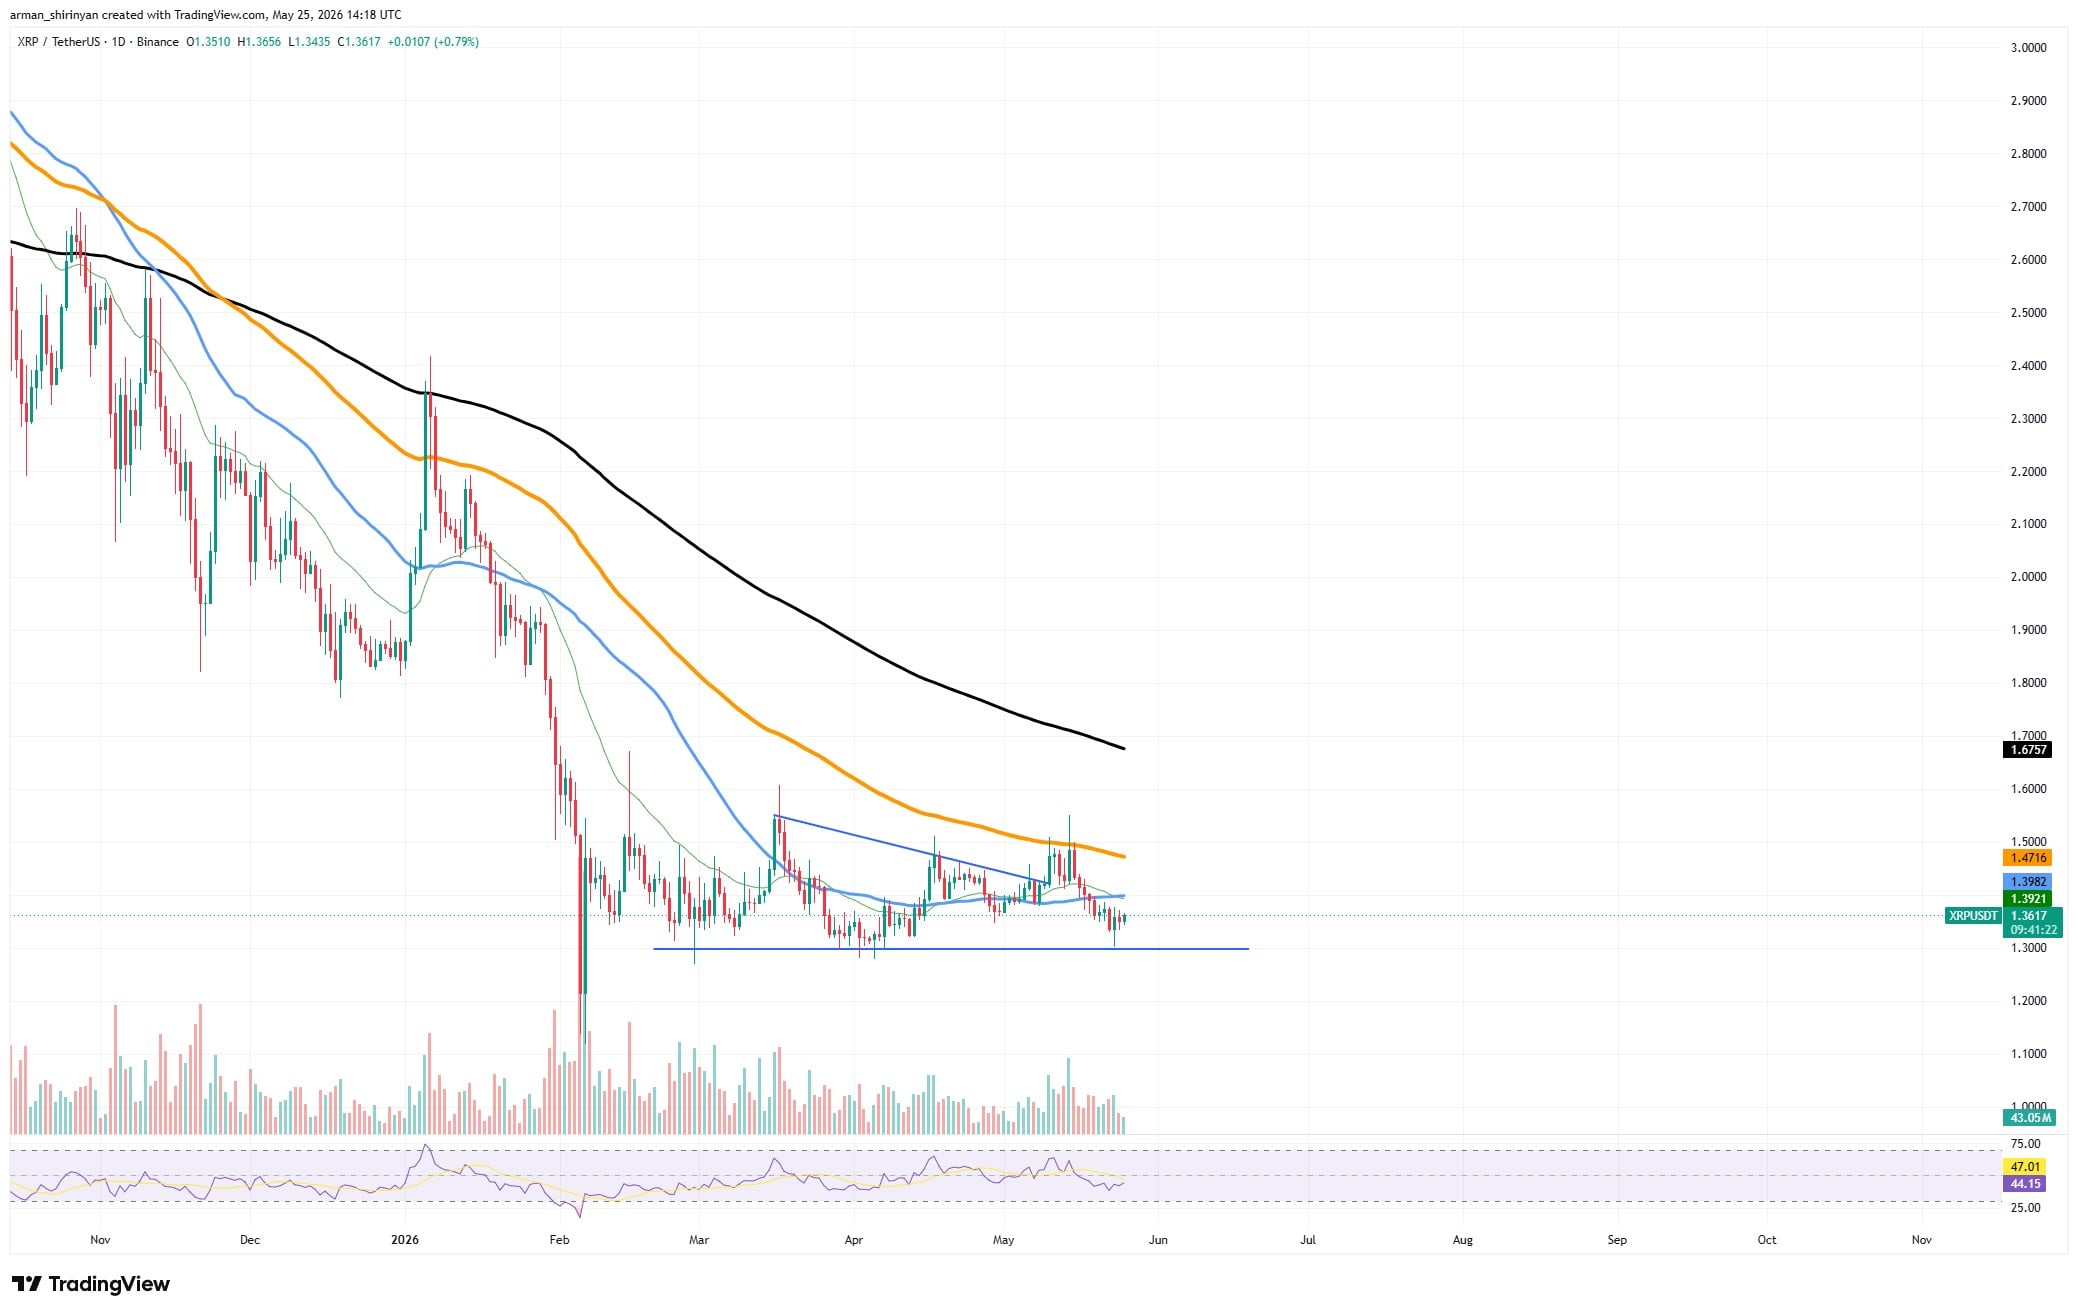
This sets up a risky situation. The market may initiate a breakdown from the entire multi-month consolidation range if XRP decisively loses the $1.30 floor. During the sideways movement, which frequently precedes greater volatility expansion, volume has also steadily decreased.
Right now, momentum indicators are not very reliable. RSI is still trapped below neutral territory, exhibiting neither aggressive bullish momentum nor significant accumulation. XRP hasn't entirely collapsed yet, though. One of the most significant technical zones on the chart is the $1.30 support level, which held several times in March, April, and May.
Instead of going into a new leg lower, XRP may stay trapped inside consolidation if buyers defend it once more and recover resistance around $1.45-$1.50. However, the structure continues to lean bearish until the contrary is demonstrated.
Hyperliquid's performance looks unmatched
Although Hyperliquid is still one of the best-performing assets in the cryptocurrency market, the chart is starting to overheat following its near-vertical breakout above the $60 mark. Overall momentum is still in favor of bulls, but after such an aggressive expansion phase, traders should not overlook the growing risk of a violent correction.
It has been an amazing rally structure. In just a few sessions, HYPE shot up from the mid-$40 range to new all-time highs, cutting through resistance levels with hardly any significant consolidation. The price is currently trading well above all of the major moving averages, and the 20-day average is rapidly rising below the current trend. Extreme momentum and unstable market conditions are typically reflected in that.
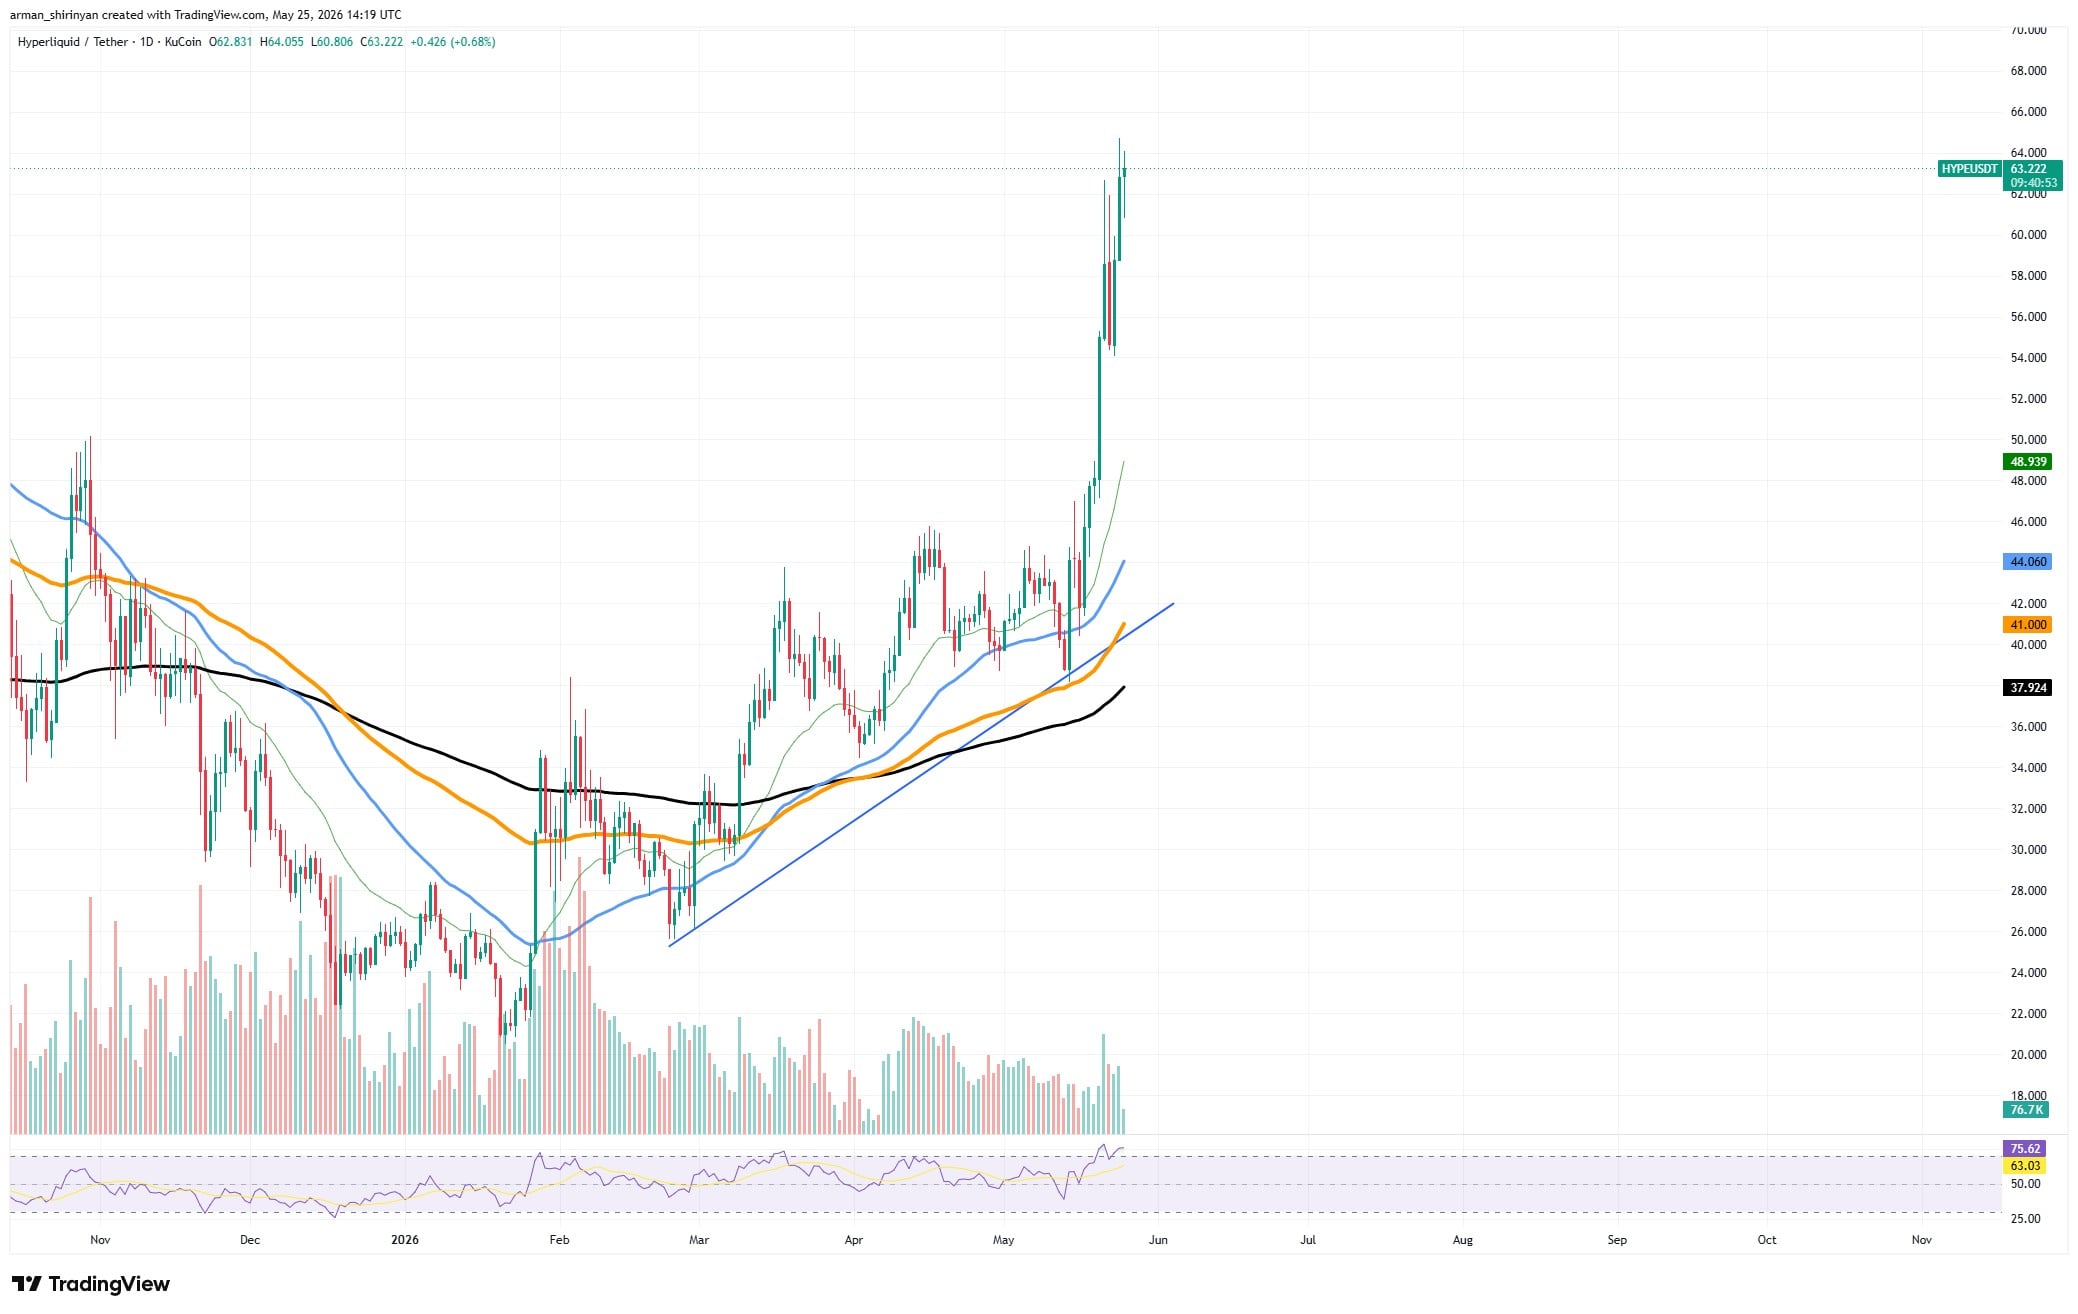
Recent candles began printing longer upper wicks close to the highs, and RSI had already pushed far into overheated territory during the breakout. When late momentum buyers start chasing stretched price action, that frequently indicates early profit-taking.
Bears still face a challenge, though, as there is hardly any remaining nearby resistance. The overall structure remains firmly bullish as long as HYPE stays above the prior breakout zone, which was around $55-$57. Dip buyers continue to act aggressively because the market continues to treat Hyperliquid more like a high-growth exchange ecosystem than a speculative altcoin.
Psychological resistance around $70 becomes the next likely upside target if momentum persists. However, a correction toward the 20-day moving average close to the upper-$40 range would not be shocking at all if the current acceleration fails.
Bitcoin hits the ceiling
Bitcoin is directly below one of its most significant resistance zones of the year as it enters a pivotal macro week. Although the asset made a significant recovery from its April lows, its momentum has begun to wane just below the 200-day moving average at $81,000. Technically, that rejection is significant.

After failing to maintain upward continuation above local highs, Bitcoin recently lost its short-term ascending support trendline. Since then, the price has returned to the cluster of the 50-day and 100-day moving averages around $76,000-$77,000, where buyers are currently attempting to stabilize the market.
Instead of showing strength, momentum indicators show indecision. After rising for weeks during the recovery rally, the RSI cooled back to neutral. Additionally, volume significantly decreased during the most recent consolidation, indicating that traders are awaiting macro catalysts, especially the impending U.S. GDP and inflation data, before making a more significant directional shift.
As long as Bitcoin stays above the mid-$70,000 range, the current structure remains cautiously bullish. The market may swiftly turn toward another attempt at a breakout if Bitcoin successfully reclaims the $80,000-$81,000 resistance range. However, Bitcoin runs the risk of returning to lower liquidity zones close to $72,000 if macro pressure increases and support fails.
 U.Today Editorial Team
 Dan Burgin
