Disclaimer: The opinions expressed by our writers are their own and do not represent the views of U.Today. The financial and market information provided on U.Today is intended for informational purposes only. U.Today is not liable for any financial losses incurred while trading cryptocurrencies. Conduct your own research by contacting financial experts before making any investment decisions. We believe that all content is accurate as of the date of publication, but certain offers mentioned may no longer be available.
Shiba Inu is still having trouble as the meme asset moves further into a decline, with price levels now getting close to levels last observed in 2021. The worst part is that there is a good chance that it has not yet reached the bottom, and neither has the rest of the market, including Bitcoin and XRP.
Shiba Inu in danger zone
SHIB has failed to create a strong support base despite multiple brief attempts at stabilization over the past few months, raising doubts that the market has yet to reach its actual bottom.
Shiba Inu is currently trading close to $0.0000053, which is a sharp drop from the highs seen in earlier market cycles. The asset’s current valuation essentially returns it to pre-explosive rally levels that previously elevated SHIB to the forefront of the larger cryptocurrency market.
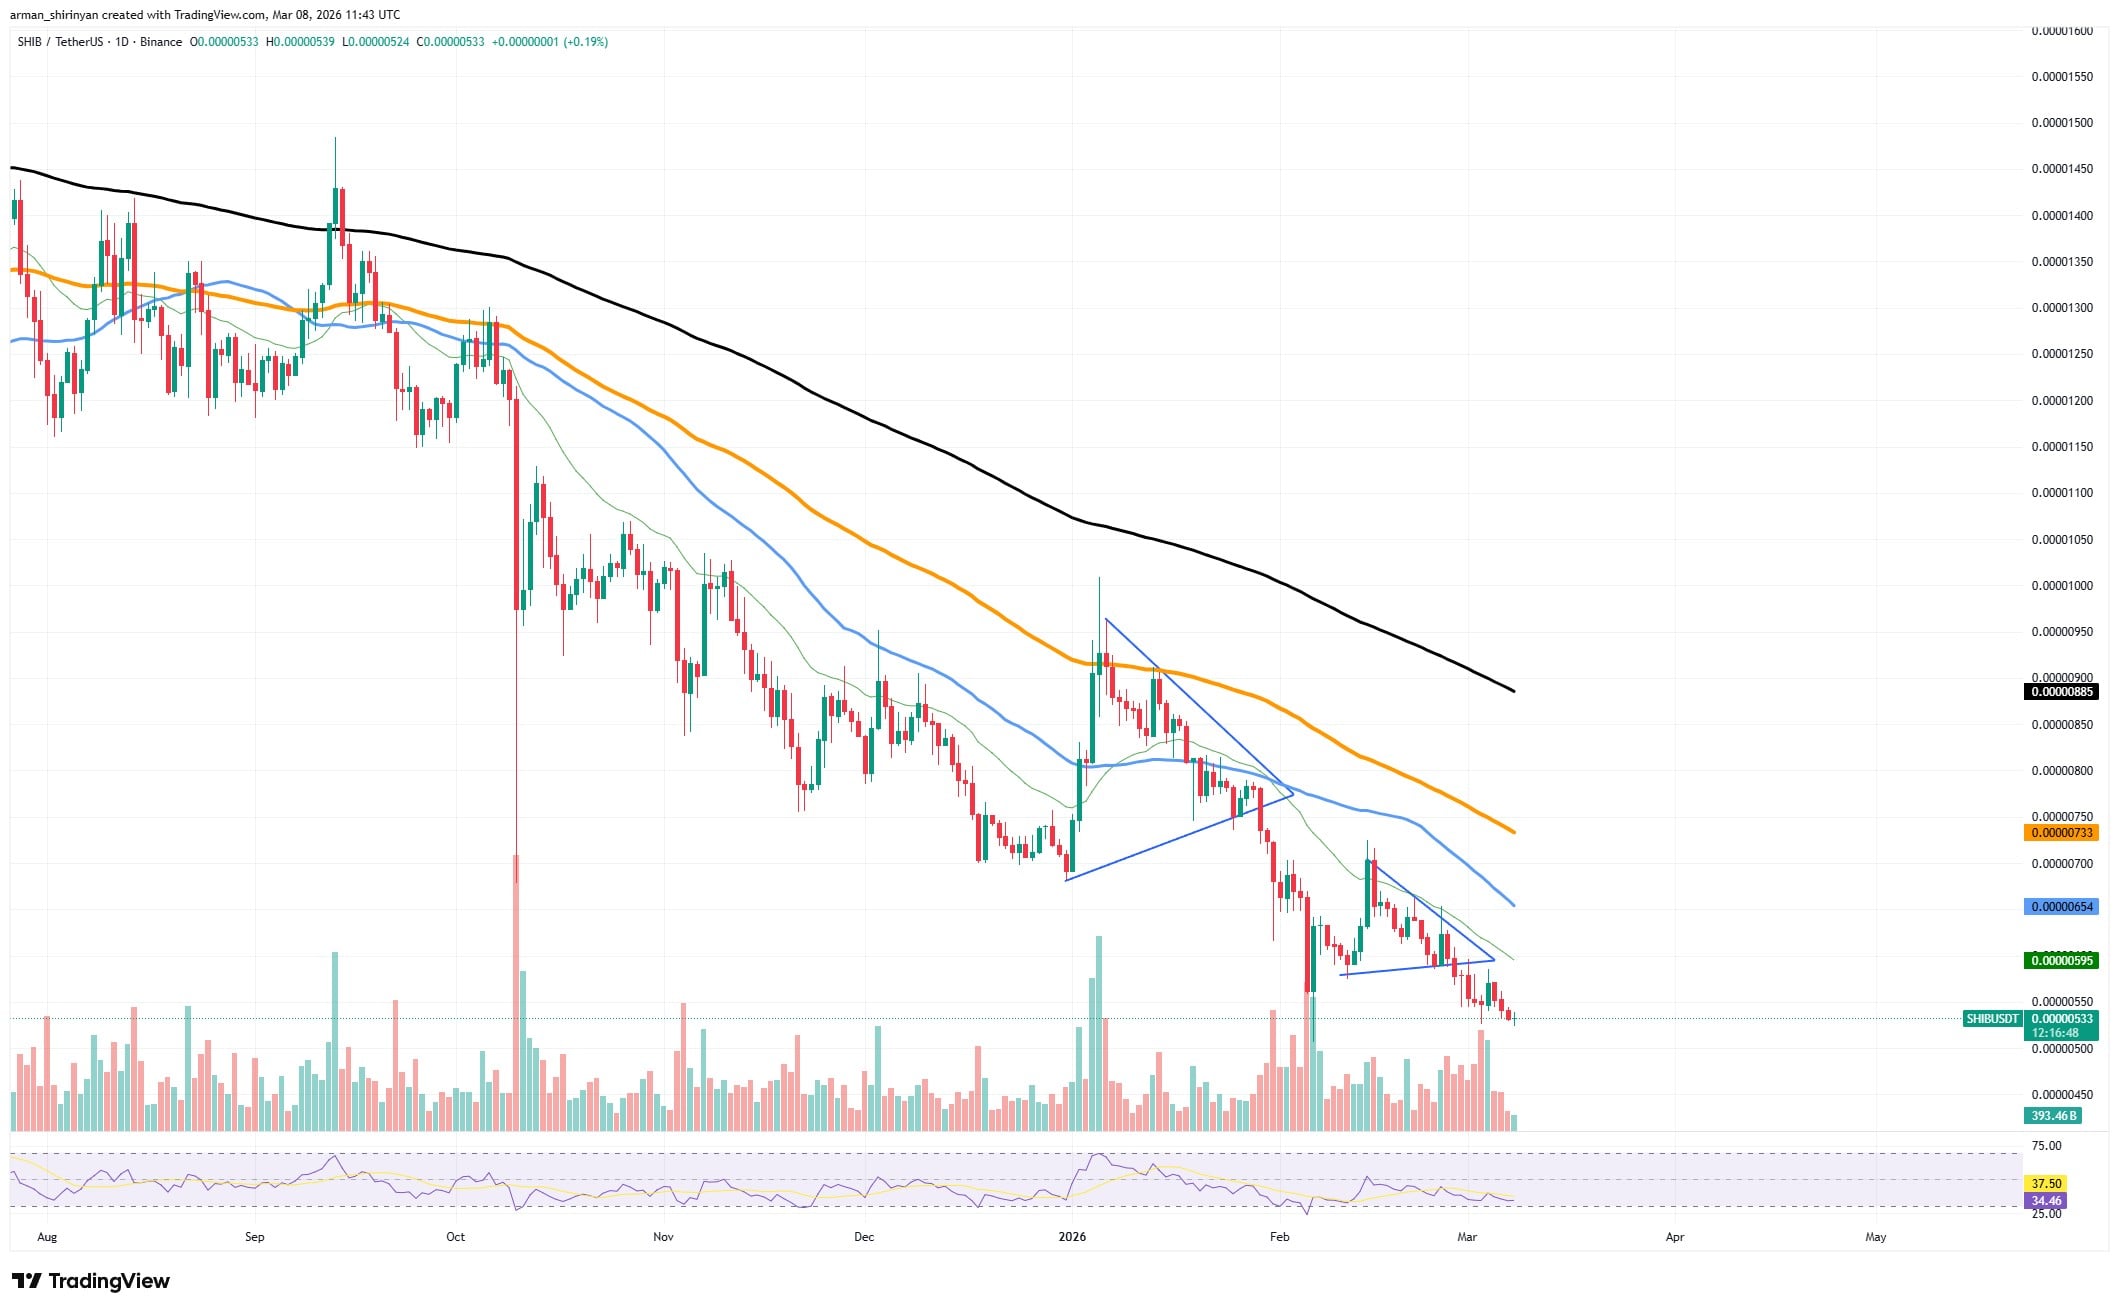
The structure is still clearly bearish from a technical standpoint. Selling pressure still dominates market behavior, as evidenced by the chart’s steady pattern of lower highs and lower lows. The overall negative momentum has been strengthened by the eventual breakdown of every consolidation pattern that develops during the downtrend.
The current market structure’s weakness is further highlighted by the moving averages. Shiba Inu is still significantly below its primary trend indicators, such as the longer-term trend lines that are still sloping downward and the 26-day exponential moving average. This arrangement usually indicates that the market is still in the process of correcting itself and that any short-term gains will probably encounter significant resistance.
Behavior is intact
The absence of a distinct accumulation zone is another worrying aspect. As assets get closer to a real market bottom, they frequently start to form stable horizontal support levels along with an increase in buying activity. However, the market has not yet shown such behavior in the case of SHIB.
Rather, the asset keeps declining steadily, and volatility is still quite low. The magnitude of the decline is highlighted by the fact that SHIB has already reached 2021 price levels.
While some long-term investors looking for cheap entry points may find this appealing, it also shows that the market has eliminated a significant amount of the speculative demand that once drove its rallies.
XRP in calamity
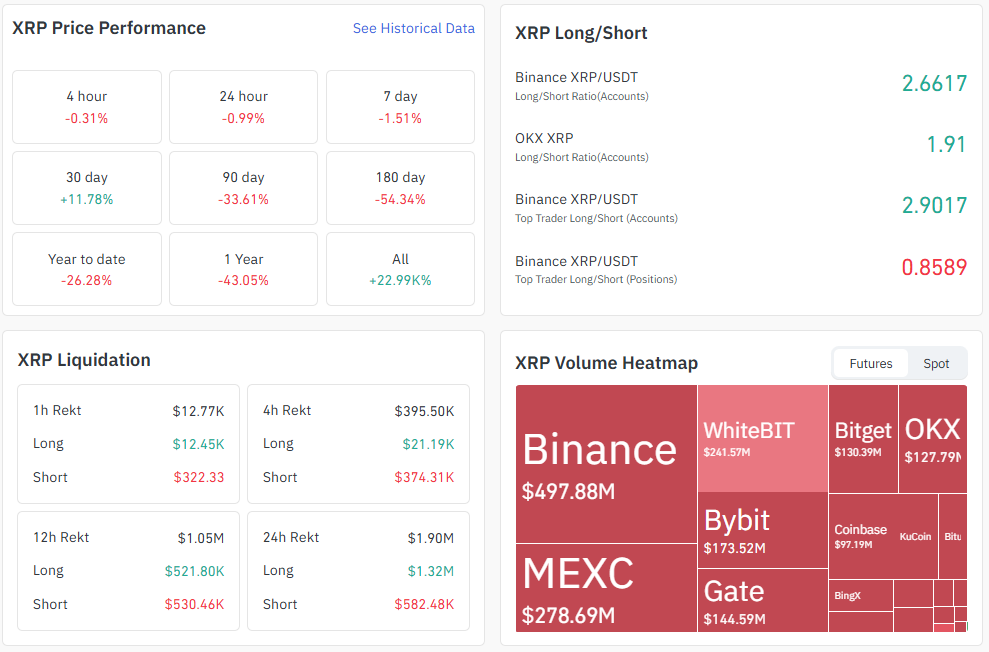
With price swings becoming less frequent and volatility significantly declining, XRP has entered one of its most stable periods of the year.
Although there was a lot of volatility in the asset earlier in 2026, the current climate points to a time of relative stability. This stability, however, does not necessarily mean that the market is strong, it might be the opposite; it indicates a lack of volatility and diminished momentum rather than an obvious bullish recovery.
As of this writing, XRP is trading at about $1.36, just above a support line that has been steadily rising since the market’s precipitous fall earlier this year. For a number of weeks, the asset has avoided more breakdowns, and price fluctuations have gotten more constrained. One of the most stable trading periods XRP has seen since the beginning of the year is the outcome of this tightening range.
Technically speaking, there is still caution in the market structure. The 26-day exponential moving average and longer-term trend indicators that are still sloping downward are among the major moving averages that XRP is still trading below.
Stronger upward moves have been repeatedly rejected by these resistance levels, which has limited the asset’s capacity to develop sustained momentum.
Even though XRP has recently shown a slight upward drift, the movement is still quite small. Along the rising trendline, the asset has been making minor higher lows, but these gains have not been significant enough to overcome the moving averages’ overhead resistance.
This kind of stability could be deceptive to investors. The lack of volatility suggests that the market lacks the strong liquidity and buying pressure normally necessary for a significant recovery, even though the price is no longer declining sharply.
Bitcoin enters recovery
After losing one of its most significant technical levels earlier this year, Bitcoin is back in the recovery phase.
After a sharp drop that destroyed weeks’ worth of gains and forced the market into a defensive stance, the cryptocurrency is currently trading at about $67,000 in an effort to stabilize.
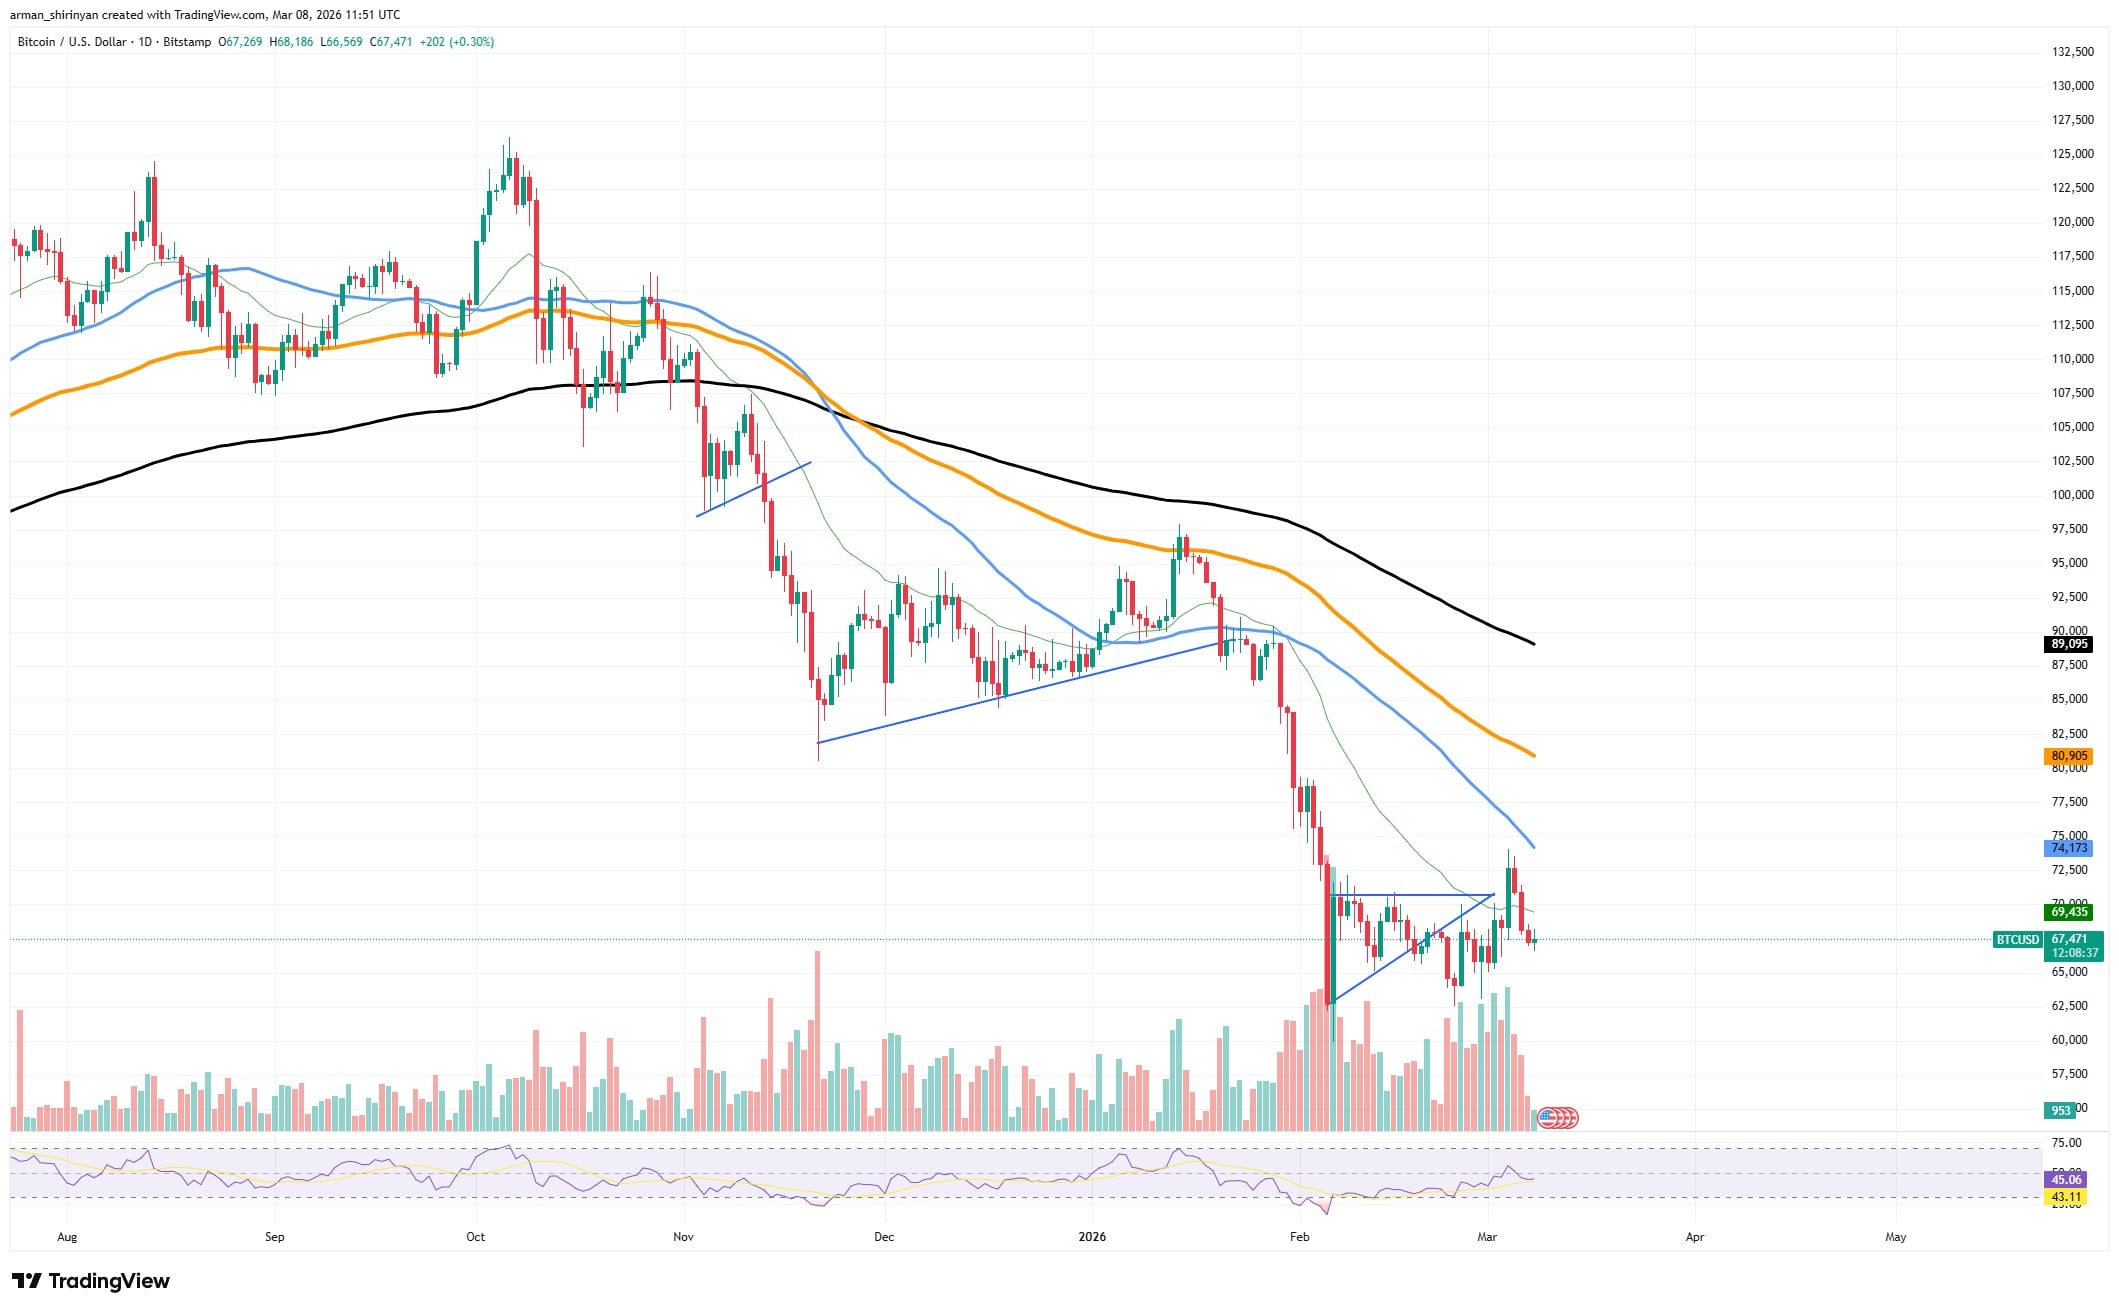
Although the price has managed to stay above the mid-$60,000 range for the time being, the market’s main concern is whether Bitcoin will be able to recover the $74,000 level that it lost so quickly.
There was a swift and decisive breakdown below $74,000. As selling pressure increased, what had previously served as a significant support zone failed to hold, setting off a chain reaction of liquidations and quickening the decline toward the $65,000-$68,000 range.
The path back toward that level is now more difficult because of the speed of the move, which left little structural support behind.
Technically speaking, Bitcoin is still under a lot of pressure. The asset is still trading below a number of significant moving averages, including the midterm and short-term trend indicators, which have declined since the recent correction.
These levels now serve as dynamic resistance, so before Bitcoin can even get close to the $74,000 region once more, any upward movement is probably going to face selling pressure.
After the steep decline, Bitcoin has begun to form a minor consolidation pattern despite the overall downtrend. It appears that the market is trying to establish a temporary base because the price has been moving within a tightening range around $67,000.
 Dan Burgin
 U.Today Editorial Team