

Disclaimer: The opinions expressed by our writers are their own and do not represent the views of U.Today. The financial and market information provided on U.Today is intended for informational purposes only. U.Today is not liable for any financial losses incurred while trading cryptocurrencies. Conduct your own research by contacting financial experts before making any investment decisions. We believe that all content is accurate as of the date of publication, but certain offers mentioned may no longer be available.

After its earlier rally failed to create a sustainable market structure, Cash Cat is still under a lot of pressure. At $0.098, which is below all three of the hourly chart's exponential moving averages, CASHCAT is trading hands. At roughly $0.105, the short-term EMA is the closest dynamic resistance.
Cash Cat slows down
Above that, the medium-term averages are located close to $0.125 and $0.133, forming a wide cluster of resistance that buyers would have to overcome before a plausible trend reversal could occur. The current bearish structure is strengthened by their downward slopes. Since hitting the $0.22-$0.23 range, CASHCAT has created a series of lower highs and lower lows.
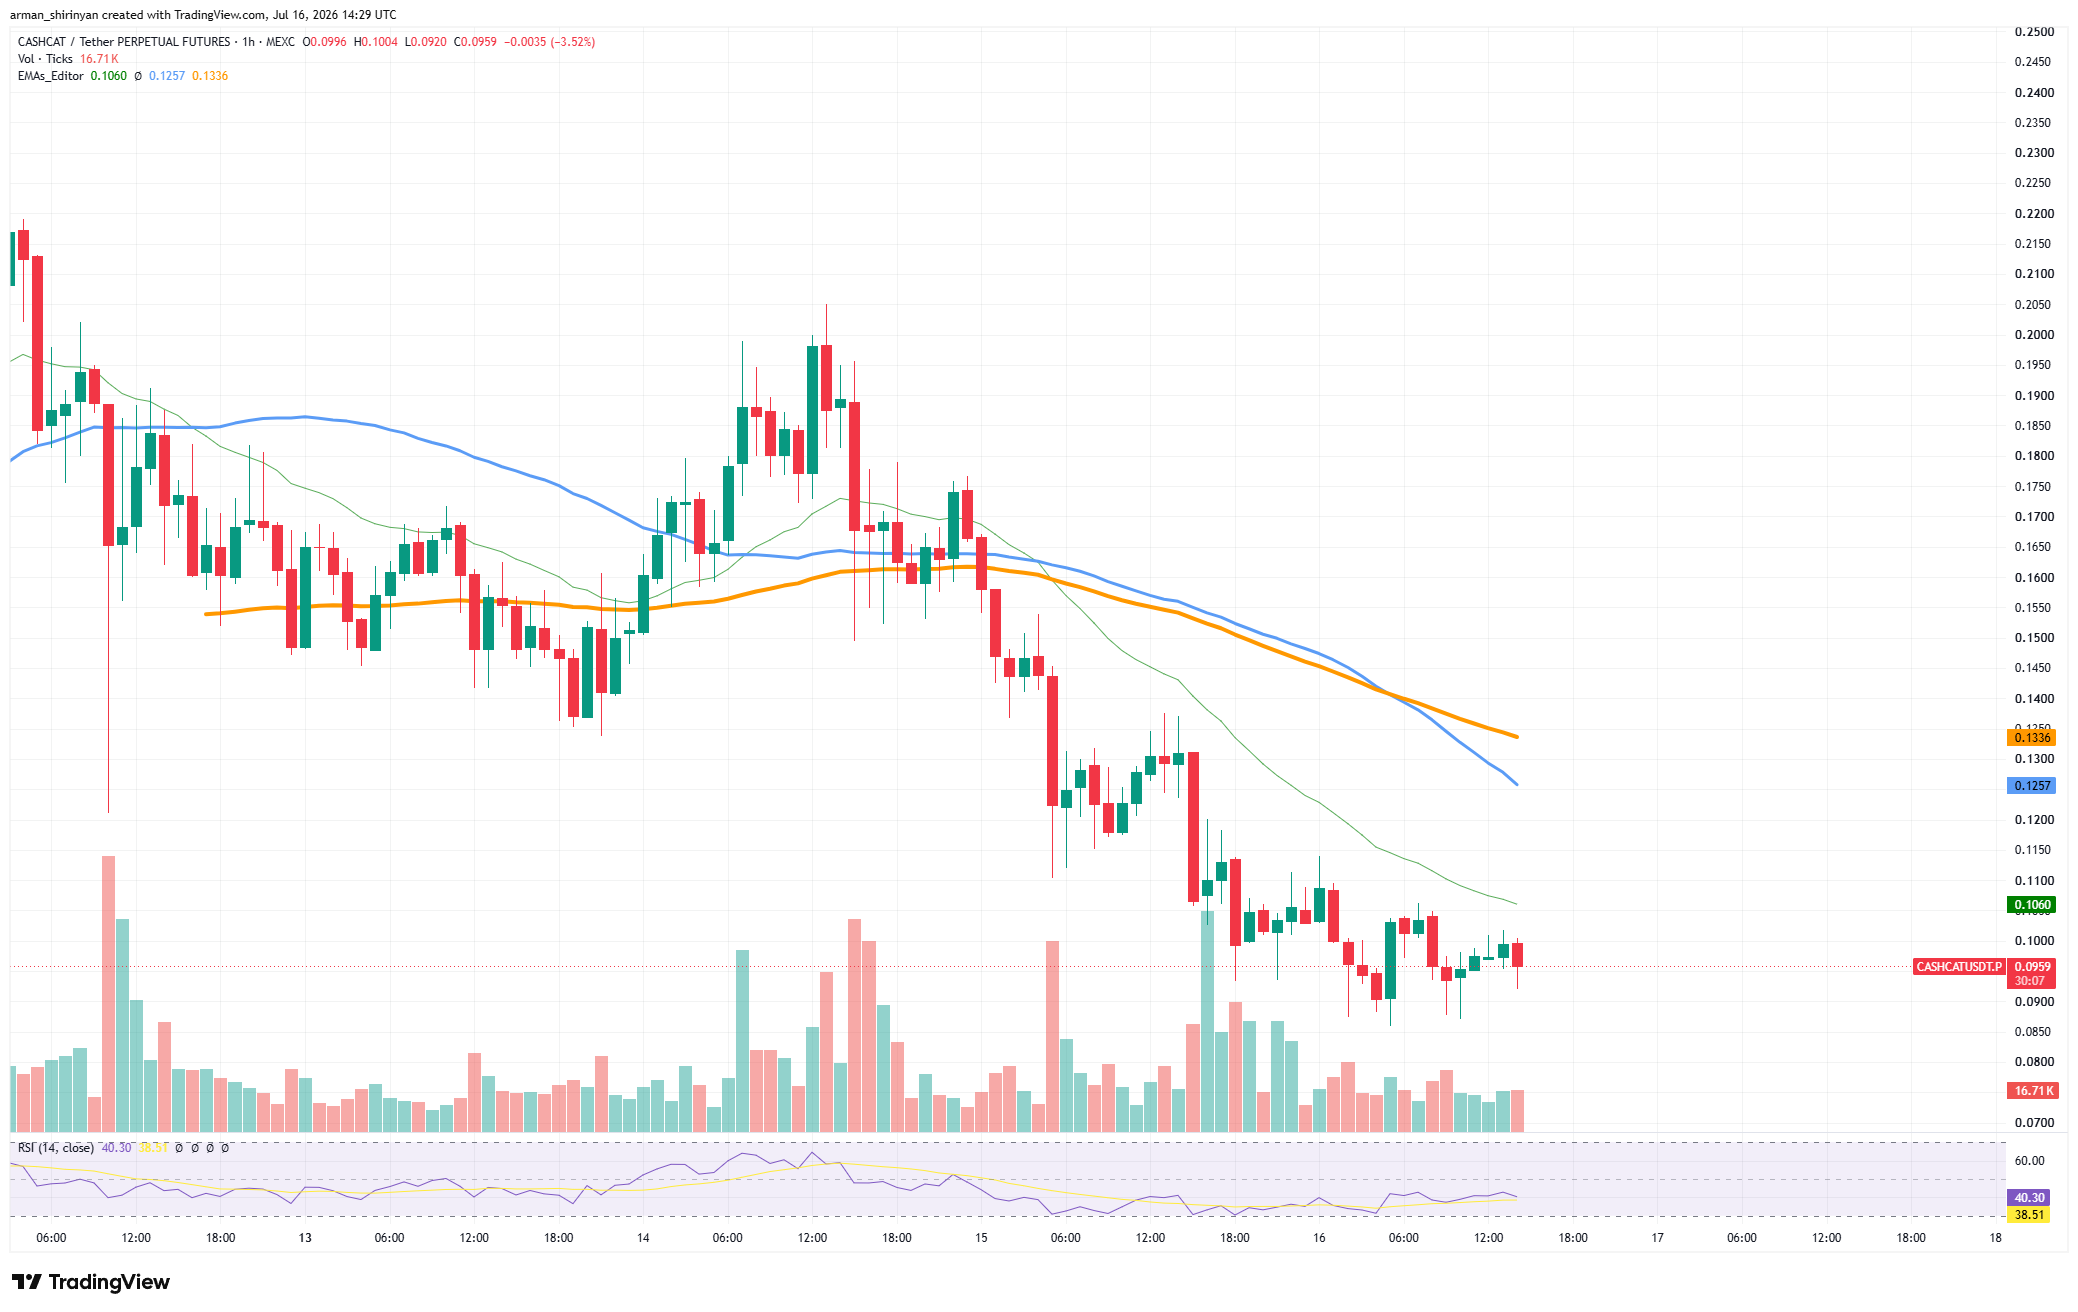
Following the token's loss of the $0.14 region and subsequent sharp decline toward $0.10, the strongest recent breakdown took place. The repeated failure of attempts to stabilize above $0.10 indicates that sellers continue to be active whenever the price experiences a slight rebound.
At the psychologically significant $0.10 level, the token is currently consolidating. There is immediate support between $0.093 and $0.095, where buyers have previously generated multiple rebounds. CASHCAT may be exposed to the most recent low of $0.087 if it moves decisively below this region.

Before about $0.08, losing that level would leave little technical support. The Relative Strength Index is still below the neutral level of 50, but it has recovered from oversold territory to close to 42. This suggests that bearish momentum has somewhat abated without giving buyers back control.
CASHCAT must first recover $0.105 and remain above the declining short-term EMA in order to improve its short-term outlook. It would be necessary to move above $0.125 for a more robust recovery. Until then, the current consolidation does not appear to be the start of a long-term reversal, but rather a brief stabilization within a broader downtrend.
Dogecoin's Most Recent Lows
Due to buyers' inability to create sufficient momentum for a significant recovery, Dogecoin is still stuck close to its recent lows. On the daily chart, DOGE is trading at $0.0737, near the lower edge of its current range and below all significant exponential moving averages.
The first immediate resistance level is the 20-day EMA, which is currently close to $0.0765. Stronger resistance is still present close to the 100-day EMA at $0.0893, while the 50-day EMA is situated around $0.0819. At about $0.1057, the 200-day EMA is significantly higher. The fact that all four averages are falling indicates that sellers are still in the lead overall.
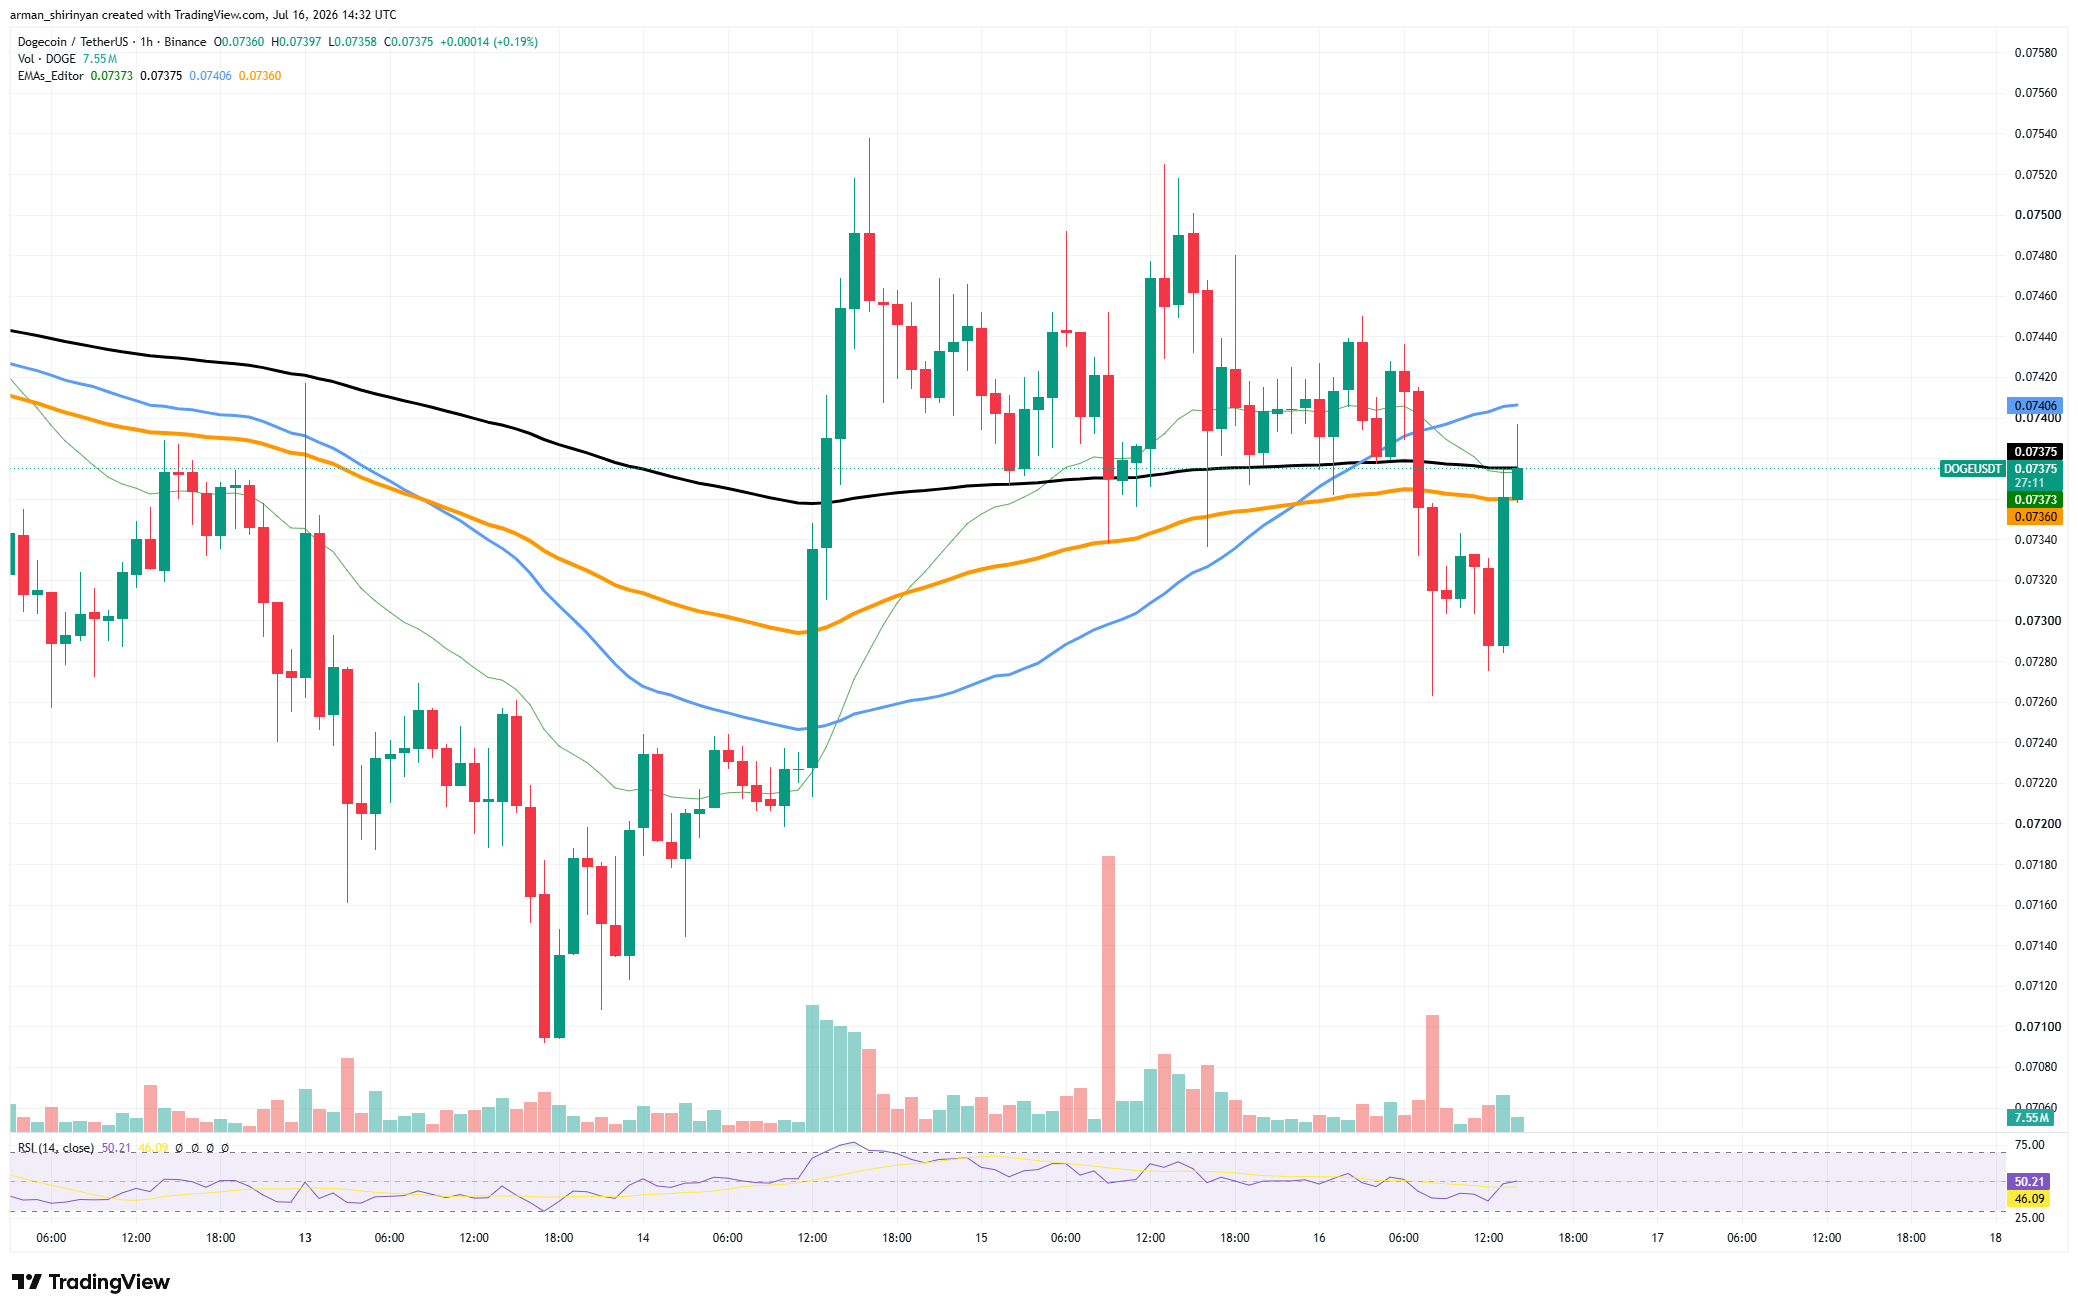
Dogecoin's most recent drop started in late May when the price was unable to stay above $0.10. The breakdown that followed forced DOGE through the $0.09 support area and below $0.08. The token has mostly moved sideways between roughly $0.071 and $0.078 since late June, indicating that selling pressure has decreased but buyers have not yet established a reversal.

The Relative Strength Index is nearly 40. Although it is still below 50, this is an improvement over earlier oversold readings and does not indicate a clear shift toward bullish momentum. During the consolidation, trading volume has also decreased, indicating less involvement as opposed to aggressive accumulation. The area between $0.070 and $0.072 is the most crucial support.
The psychological $0.06 level may then become significant if DOGE breaks cleanly below this range and moves toward $0.065. Recovering $0.0765 would be the first indication of improvement. The wider bearish structure would then need to be challenged by DOGE breaking above $0.082. The current sideways movement is susceptible to another downward extension until those levels are restored.
Ethereum's Comeback Fueled
From the June lows of about $1,500 to nearly $1,950, Ethereum has experienced one of its strongest comebacks in months. ETH's short-term structure has significantly improved as a result of the rally, but it is now getting close to a significant technical barrier that will decide whether this move is a relief rally or a complete trend reversal.
Ethereum's successful comeback above the 20-day and 50-day exponential moving averages is the most significant development. These averages, which are at roughly $1,776 and $1,746, respectively, have moved from resistance to support. Throughout early July, buyers consistently defended these levels, laying the groundwork for the most recent breakout.
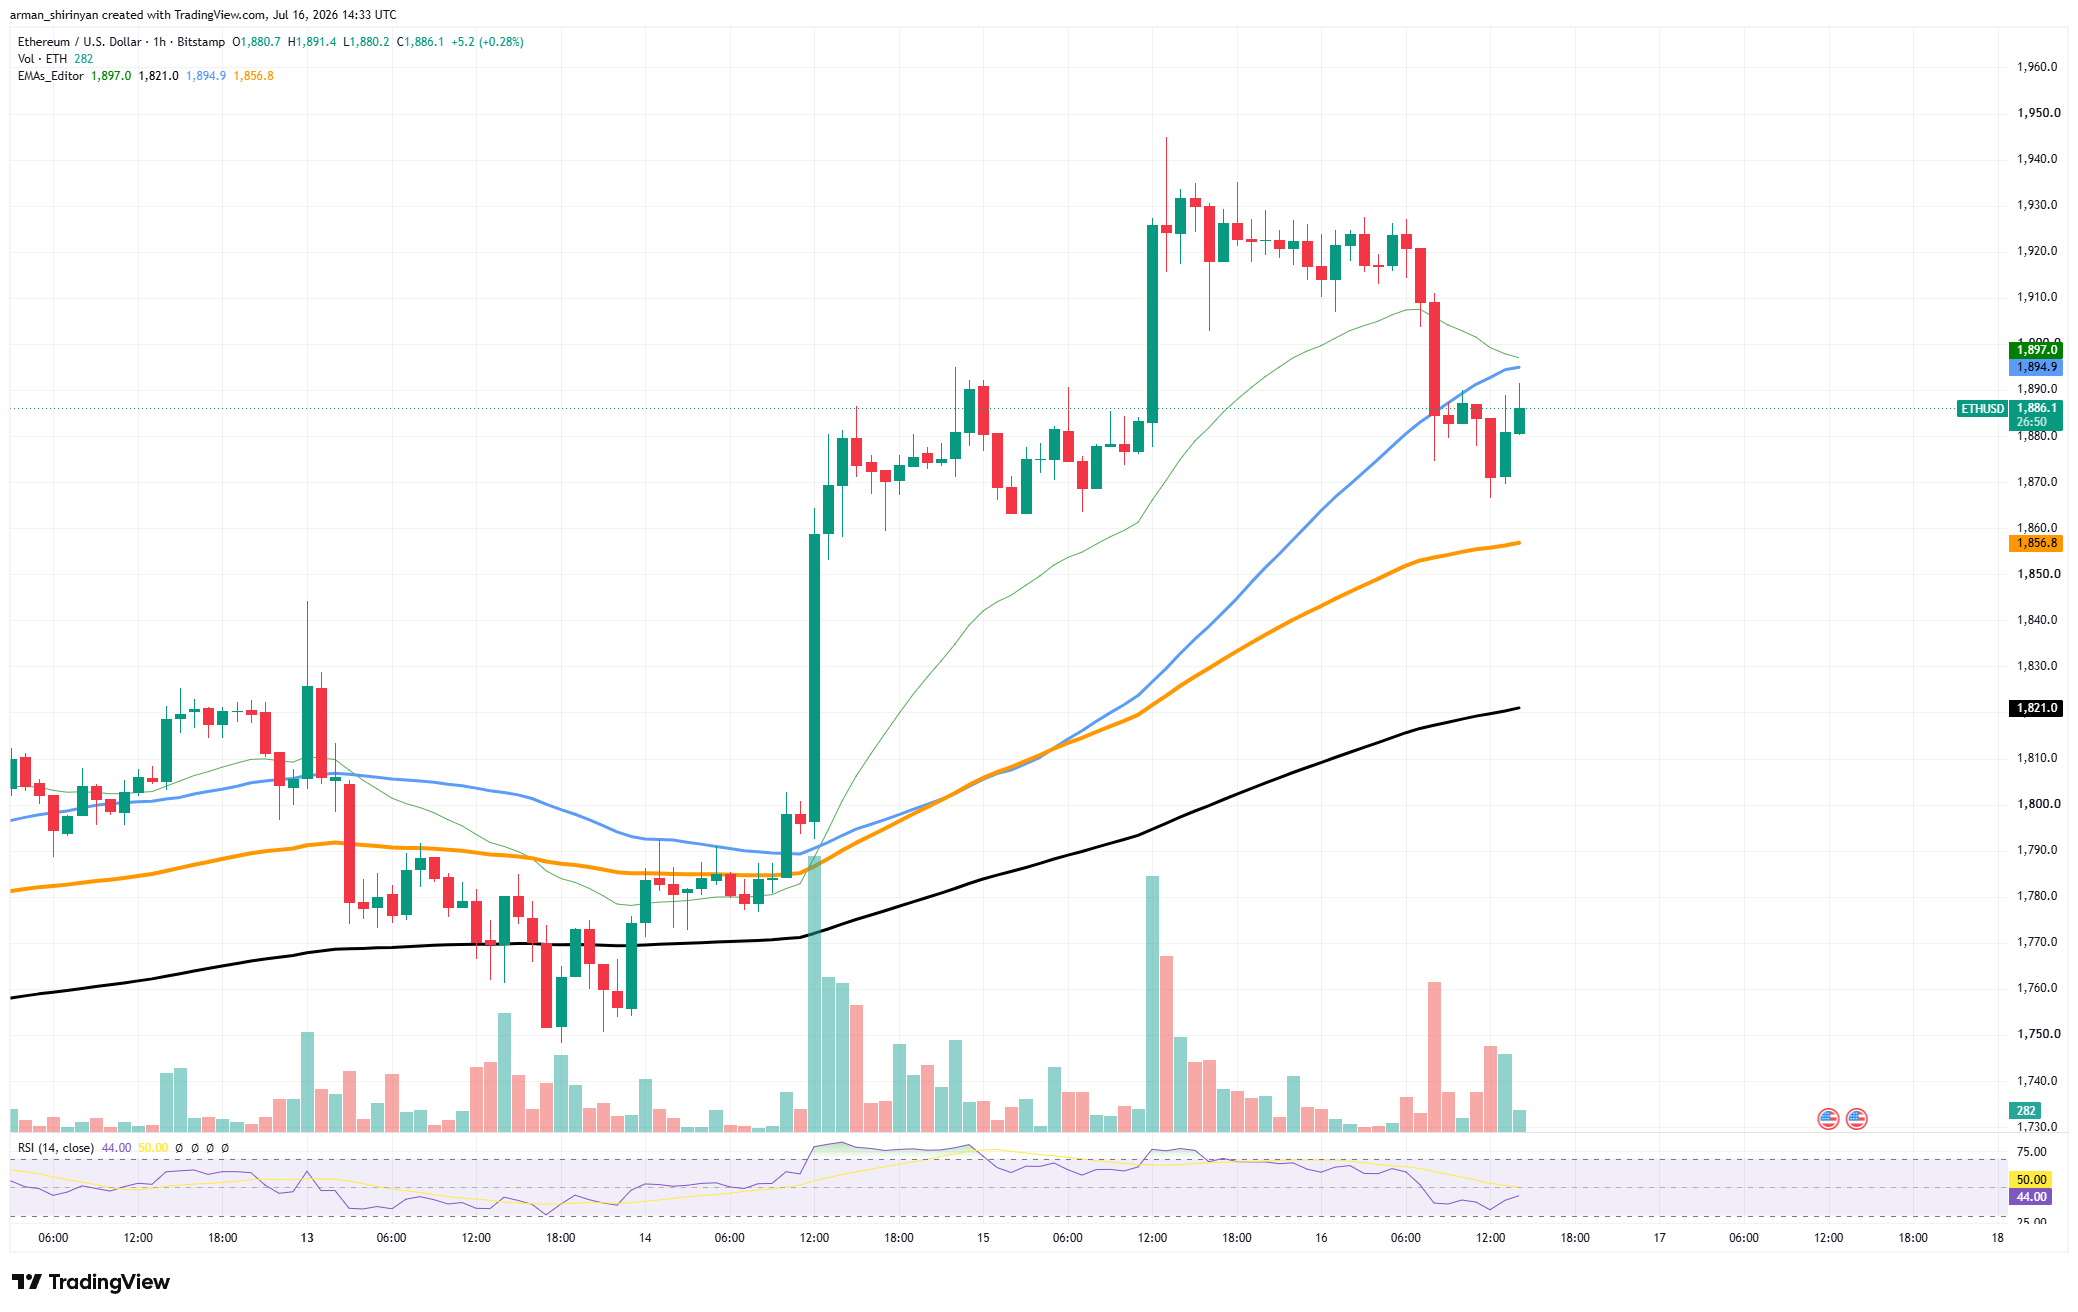
The true difficulty, though, is directly overhead. Recently, ETH tested the 100-day EMA close to $1,944 and faced selling pressure right away. Given that every significant attempt at recovery since the start of the wider decline has been capped by the 100-day average, the current rejection is not shocking. During the most recent push higher, volume has increased, which is beneficial.
This rally has drawn significant participation as opposed to merely short-covering activity, in contrast to earlier bounces. Simultaneously, the RSI has increased to roughly 63, indicating significant momentum without entering extremely overbought territory. The sessions that follow are crucial. The road to the psychologically significant $2,000 level opens up swiftly if Ethereum can recover and stay above $1,950.

The asset would be within striking distance of the 200-day EMA near $2,215, which continues to be the ultimate trend-defining resistance level, if it broke above $2,000. Support is currently between $1,775 and $1,800 on the downside.
Bulls maintain control of the short-term trend as long as ETH stays above that level. As of right now, Ethereum's chart appears to be in the best shape since the June crash. Before declaring a full trend reversal, the market must demonstrate that it can get past the dense resistance cluster around $1,950–$2,000.
Stellar's Important Setup
Among the bigger altcoins, Stellar is quietly developing a strong technical setup. XLM is currently trading right inside a significant moving-average cluster, which could be a volatility implosion point for the upcoming weeks, in contrast to many assets that are still stuck below important averages.
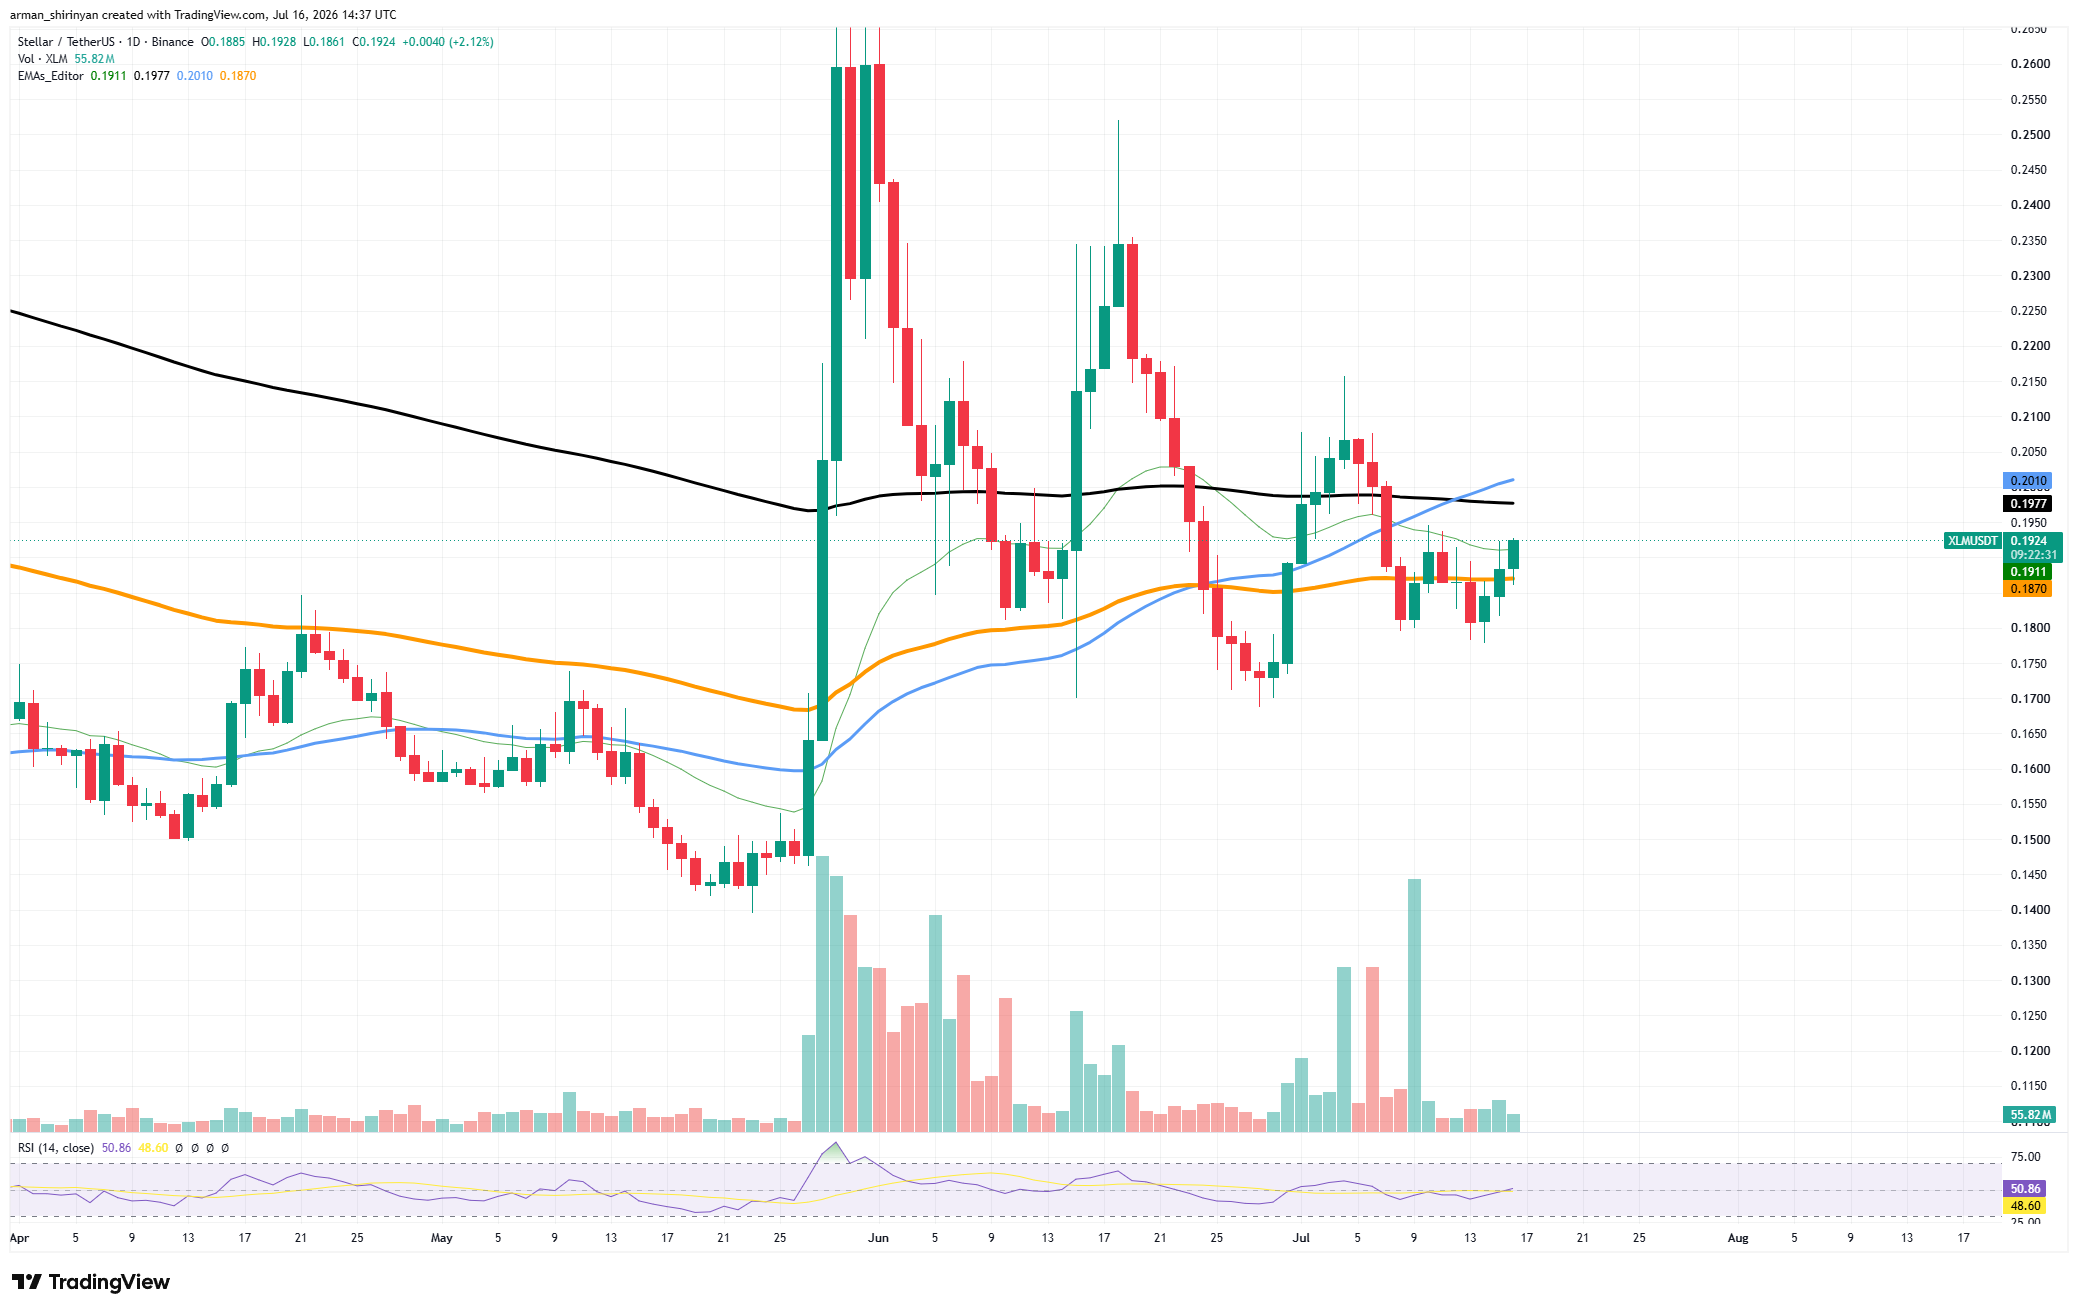
The token is trading around $0.192, comfortably above its 50-day EMA at $0.187 and above its 20-day EMA at $0.191. After months of consolidation, these levels are now providing support. More significantly, the 100-day and 200-day moving averages are currently being contested by Stellar in the vicinity of $0.198–$0.201.
Throughout June and July, advances have been repeatedly thwarted by that resistance zone. Sellers haven't been able to push XLM back below $0.18, but every attempt to create a breakout above $0.20 has failed. As a result, a larger directional move is frequently preceded by a tightening range.

With the RSI close to 51, the market is balanced and lacks a definite momentum advantage. Since it provides ample opportunity for momentum expansion in either direction, this neutral reading actually supports a breakout scenario.
The recent consolidation following Stellar's explosive rally in late May is one positive indication. Rather than completely reversing course, XLM has taken several weeks to absorb gains while holding onto the majority of its higher price range. In general, this behavior is healthier than a sharp retracement.
The key level is still $0.20 for bulls. Stellar would be above both its 100-day and 200-day moving averages at the same time if it maintained a close above that area. This would create a strong technical signal that might lead to a move toward $0.22 and possibly $0.24.
Support stays close to $0.187 and then $0.18 if resistance holds again. Stellar continues to have a positive outlook and is one of the few altcoins that actively challenges long-term resistance rather than trading significantly below it, as long as those levels remain intact.
 U.Today Editorial Team
 Dan Burgin
