Disclaimer: The opinions expressed by our writers are their own and do not represent the views of U.Today. The financial and market information provided on U.Today is intended for informational purposes only. U.Today is not liable for any financial losses incurred while trading cryptocurrencies. Conduct your own research by contacting financial experts before making any investment decisions. We believe that all content is accurate as of the date of publication, but certain offers mentioned may no longer be available.
Shiba Inu's inability to break through the 50 EMA is a problematic situation for the asset as it limits the potential SHIB had in the current market recovery phase. Unfortunately, the lack of trading volume and inflows suggests we are not going to see any changes in the foreseeable future whatsoever.
Analyzing the chart, Shiba Inu has been struggling to maintain upward momentum. The 50 EMA, which acts as a significant resistance level, has proven to be a formidable barrier. SHIB's repeated failures to surpass this level indicate a weak buying pressure, which is crucial for any sustained rally.
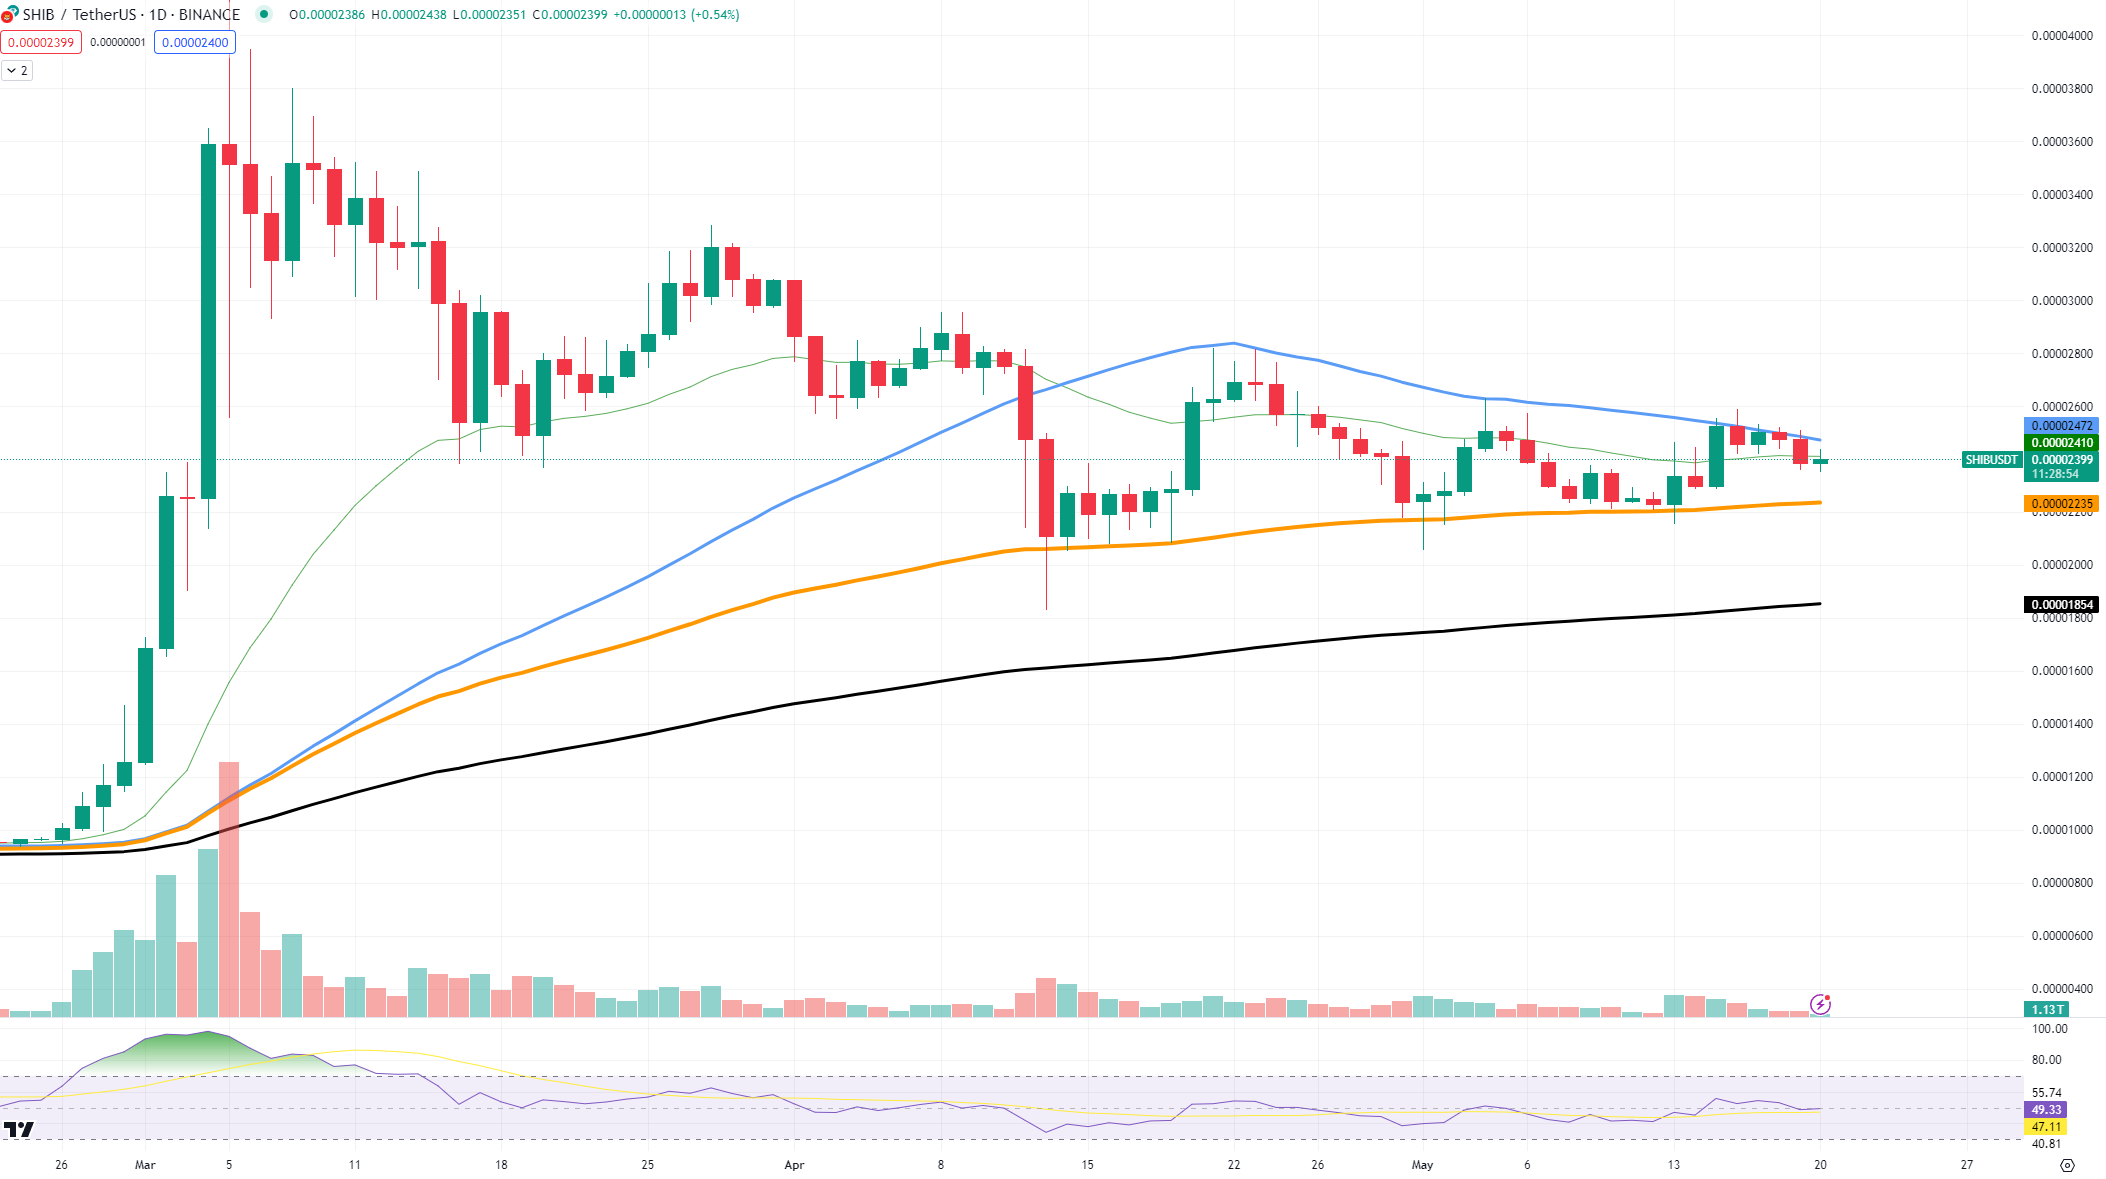
Additionally, the Bollinger Bands show that SHIB is trading within a narrow range, reflecting low volatility. This lack of movement is further compounded by the low trading volumes, as seen in the volume bars. The MACD histogram is also in the red, indicating bearish momentum.
One of the critical issues for Shiba Inu is the absence of significant inflows. The market appears to be lacking confidence in SHIB, which is crucial for driving up the price. Without new capital entering the market, the asset is unlikely to see any substantial gains.
Solana gains strength
Solana has finally broken through the local resistance level at $172, signaling a potential upcoming surge for the cryptocurrency. Fortunately, the current market conditions appear favorable for a sustained reversal. This breakthrough could set the stage for further bullish momentum in the coming days.
The chart shows that Solana has been steadily climbing, with strong support from the 50 EMA and the 200 EMA, which are acting as significant support levels. The recent price action indicates a strong bullish trend, with SOL gaining momentum as it broke through the $172 resistance level. This move is critical as it opens the door for Solana to aim for higher targets, possibly reaching $200 in the near future.

The volume profile also supports this bullish outlook, with increasing buying volume accompanying the price surge. This indicates strong demand for SOL, which is essential for maintaining the upward trajectory. The RSI is currently in the neutral zone, suggesting that there is still room for further price appreciation before entering overbought territory.
Bitcoin and Ethereum are also showing strength. This overall bullish sentiment can provide additional tailwinds for Solana, helping it sustain its upward movement. Potential targets for SOL are $190 and $200.
Ethereum needs another push
Ethereum didn't deliver the performance the majority expected from it, but in reality, it's really close to entering a substantial bullish trend if the 50 EMA gets finally broken. Obviously, some serious inflow of buying power is needed for that.
Analyzing the chart, Ethereum has been struggling to maintain upward momentum for several weeks. The 50 EMA has acted as a significant resistance level, preventing ETH from achieving a more substantial bullish trend. The current price level is hovering around $3,100, which is crucial for Ethereum to break through to signal a strong bullish move.

The Bollinger Bands indicate that Ethereum is trading within a relatively narrow range, reflecting low volatility. However, the recent green candles suggest that there is some buying interest, though not yet enough to push ETH past the 50 EMA. For Ethereum to enter a bull market, a significant increase in trading volume is necessary.
The RSI remains in the neutral zone, suggesting that there is still room for buying pressure without the asset becoming overbought. The MACD (Moving Average Convergence Divergence) histogram shows a slight bullish divergence, which could indicate a potential upward move if the buying interest continues.
Ethereum's performance has lagged behind expectations, especially compared to Bitcoin. The lack of significant inflows and investor confidence has kept ETH from reaching its full potential during the recent market recovery phase. However, the technical indicators suggest that Ethereum is on the verge of a breakout.
 Dan Burgin