
TRX/BTC pair price breaks through Senkou (First lead) line and enter the Ichimoku Cloud on daily chart for the first time in more than a year.
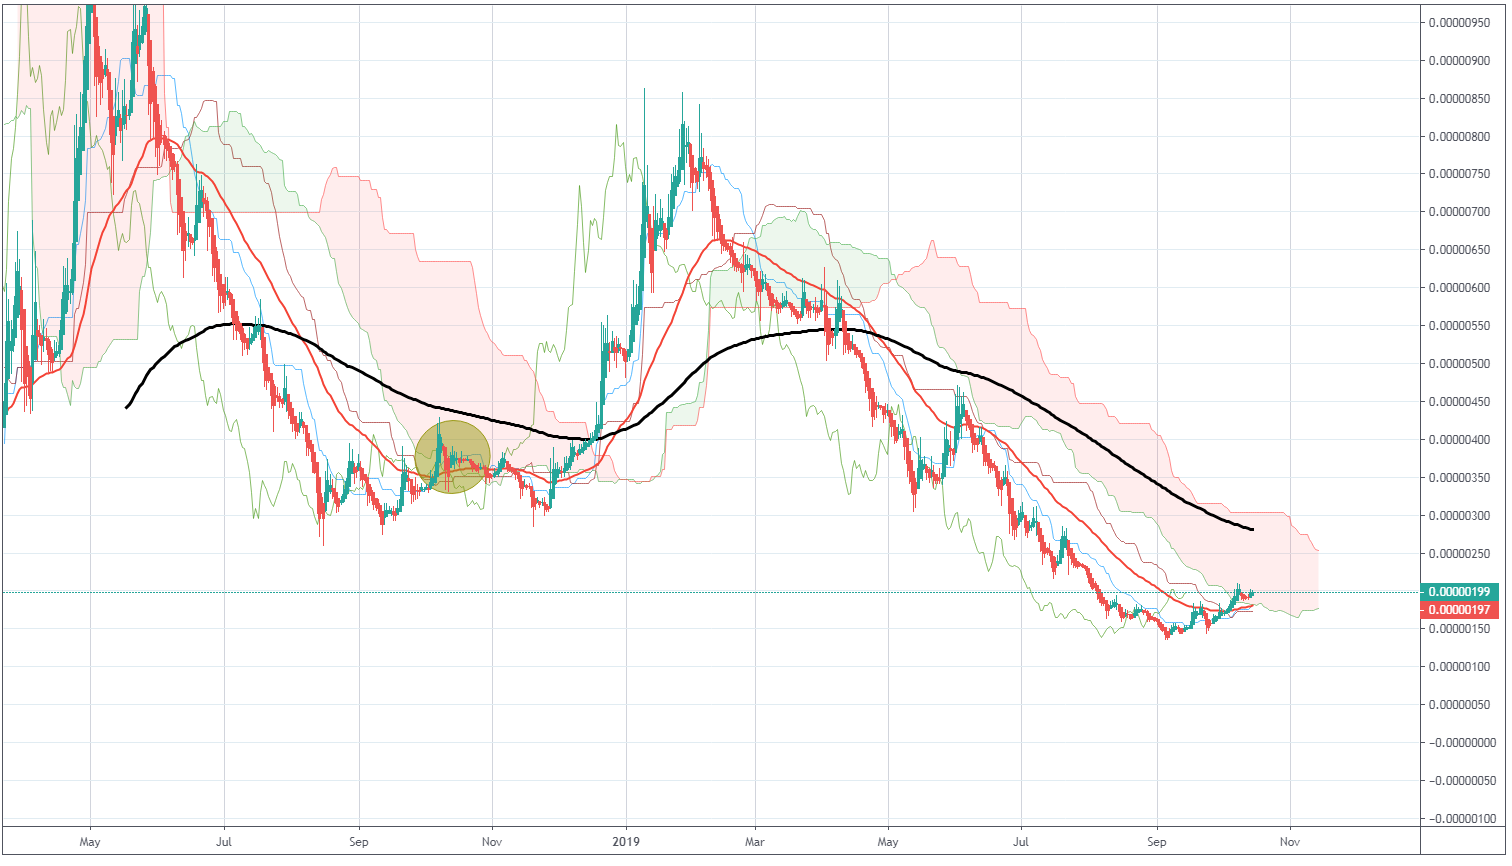
Cloud entry usually indicates the trend reverse and particularly being considered as a bullish indicator. Besides, on the more local timeframes we can see even more bullish indications:
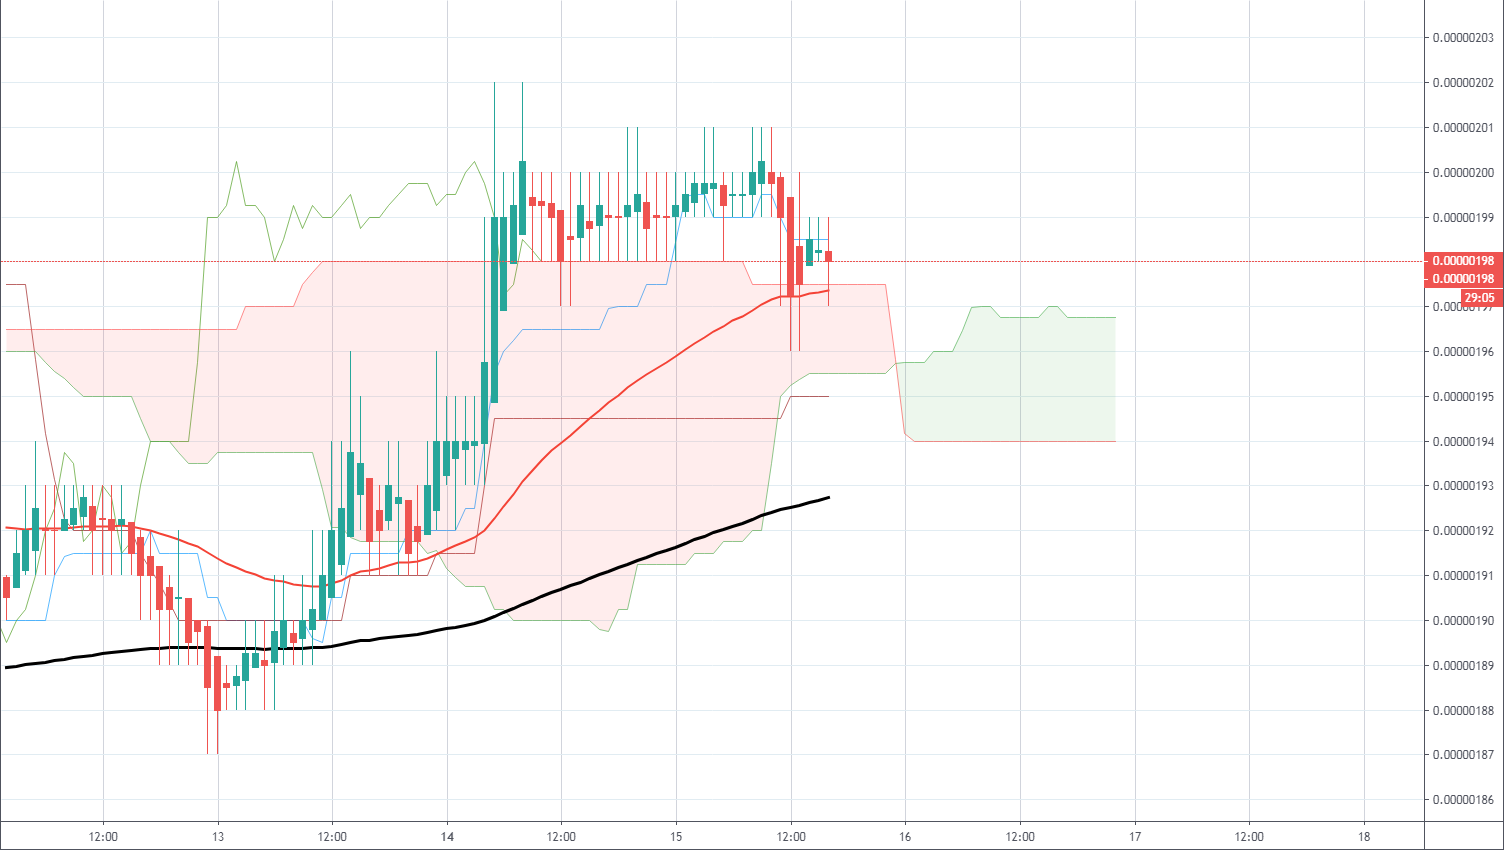
4 Hour Timeframe
Tenkan and Kaijun cross is a common bullish trend-reversal indication. On 4HR timeframe Kijun (Base) line will act as a support and exponential value for the price.
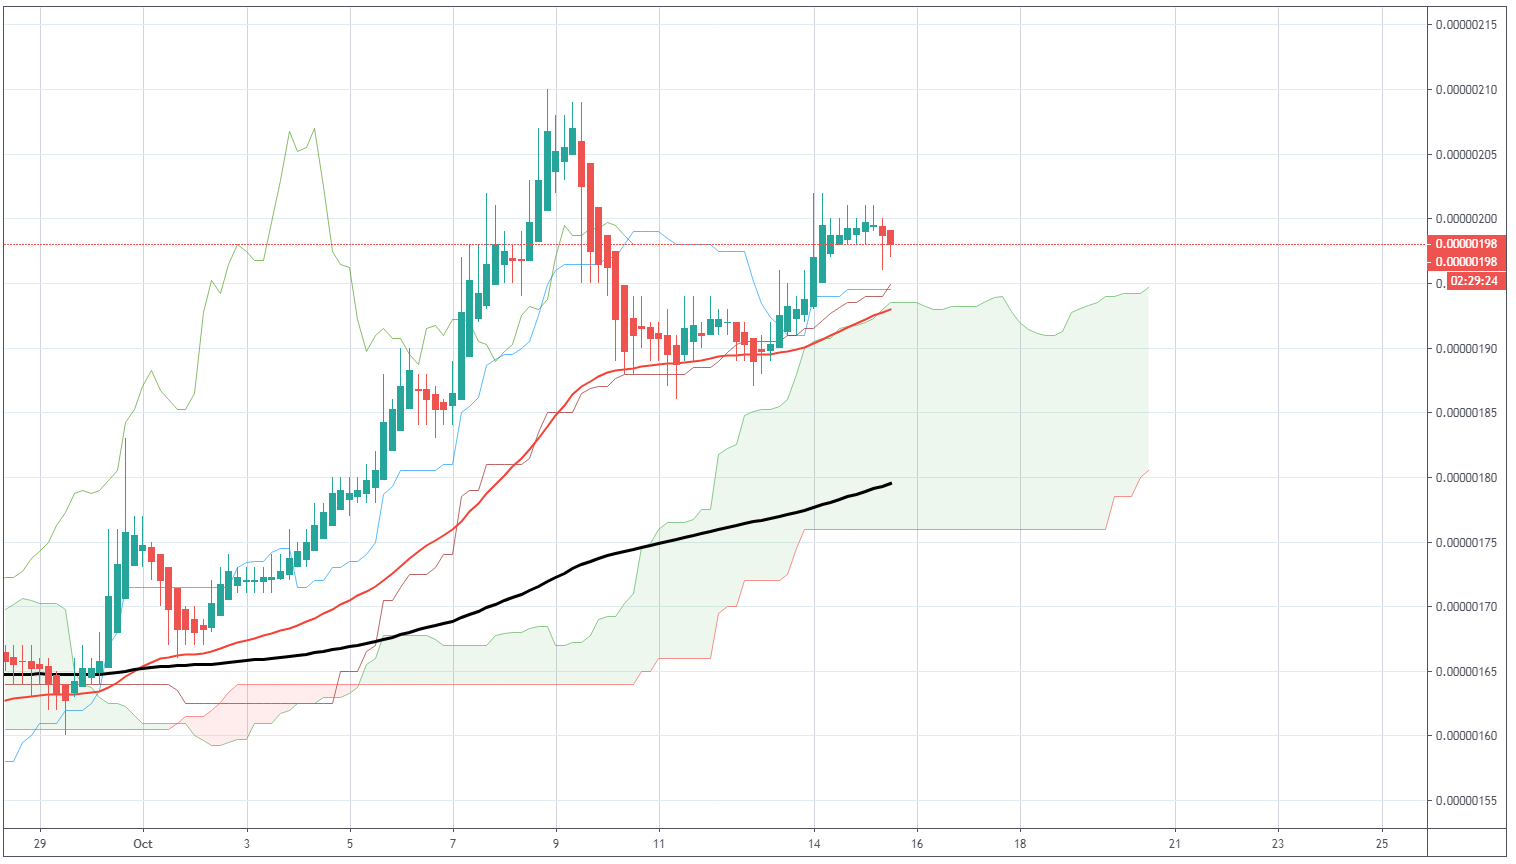
1 Hour Timeframe
On 1H timeframe we can see multiple support lines - second Senkou (Lead) line that acts as a cloud’s top support and 50EMA line. Both were tested multiple times as we can see on the chart.
Summary
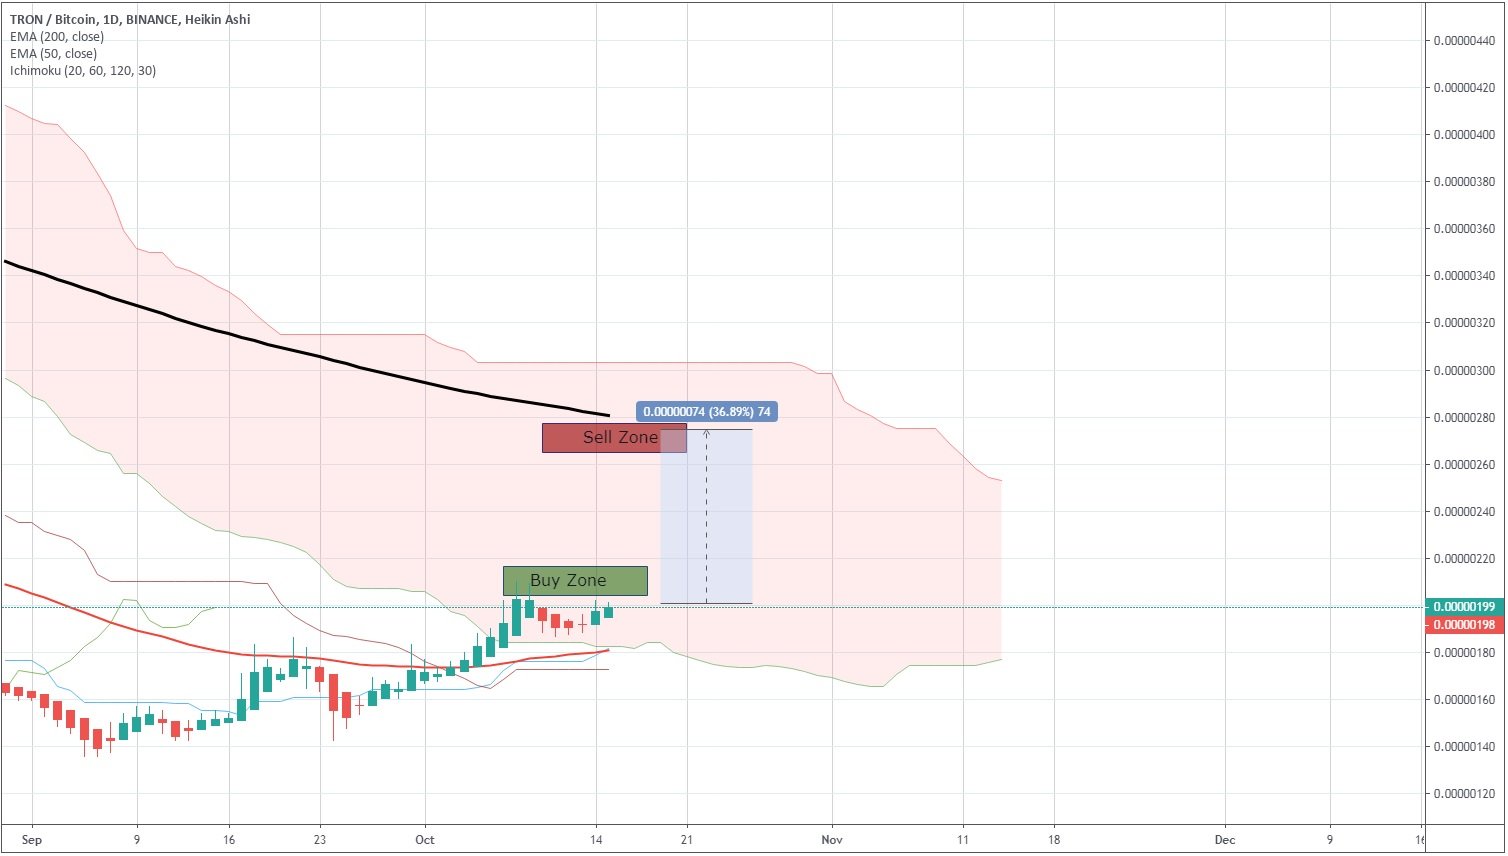
So, our buy orders are located at the top of the pattern resistance and will be executed as soon as the price breaks through 201 target and we will have the sell order right before the 200 EMA resistance line in 260-270 zone. Target is more than 30% above the current price, but that's where the next resistance is.
Do not forget to always watch the price movements since TRX/BTC is a highly volatile pair and can change its movement in any time.
 Dan Burgin
 U.Today Editorial Team