
Disclaimer: The opinions expressed by our writers are their own and do not represent the views of U.Today. The financial and market information provided on U.Today is intended for informational purposes only. U.Today is not liable for any financial losses incurred while trading cryptocurrencies. Conduct your own research by contacting financial experts before making any investment decisions. We believe that all content is accurate as of the date of publication, but certain offers mentioned may no longer be available.
After an explosive breakout pushed HYPE toward the $60 region, putting the token within striking distance of its all-time high, Hyperliquid is quickly emerging as one of the market's strongest momentum assets. Buyers are now accelerating into what looks more and more like a late-stage momentum expansion, following months of consistent accumulation and trend formation.
Technically, HYPE appears to be very powerful. The price is trading well above the 50-, 100-, and 200-day moving averages, and the structure as a whole is still in a clear upward trend that has persisted since March. Aggressive continuation buying was sparked by the most recent breakout candle, which successfully invalidated earlier resistance around $48-$50.
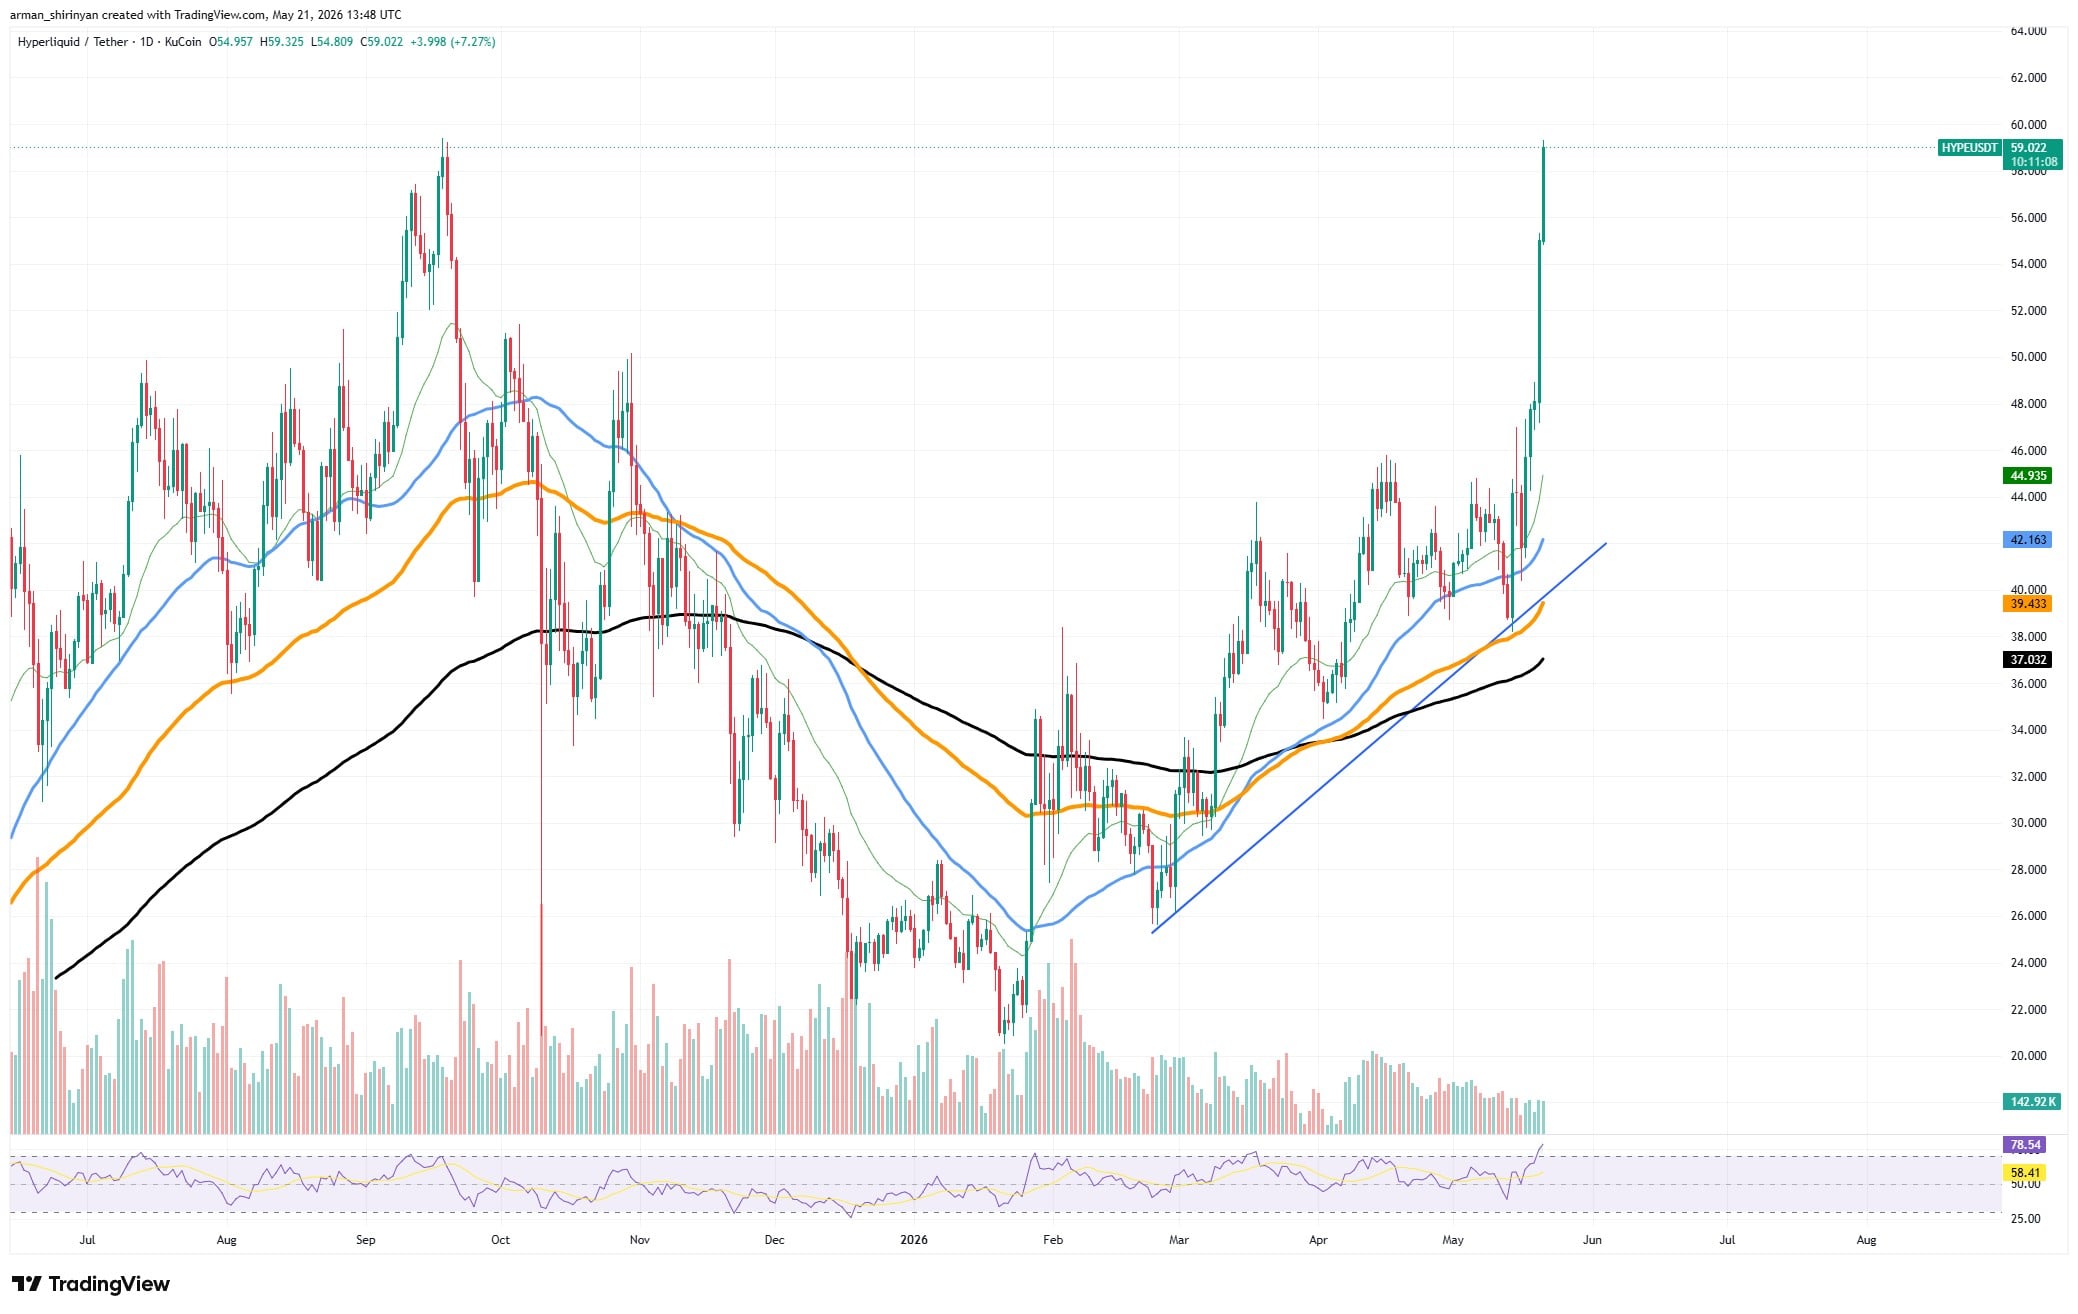
This is not a weak breakout, as volume expansion demonstrates. Instead of a low-liquidity spike, trading activity increased in tandem with the move higher, indicating genuine participation. Additionally, momentum indicators are still very optimistic, with the RSI approaching overheated territory above 75. This leads to a risky but still beneficial situation: momentum is still high, but the market is moving into a phase where volatility and sharp declines are more likely.
How well HYPE recovered from its recent decline below trend support earlier in May is one crucial detail. Bears tried to break the structure, but buyers quickly absorbed the selling pressure, pushing the price back above the important moving averages. Because trapped short sellers increase buying pressure during the recovery, such a failed breakdown frequently serves as fuel for continuation rallies.

Hyperliquid is also benefiting from the wider market environment. The focus of capital rotation has once again shifted to high-beta speculative assets, especially tokens linked to derivatives infrastructure and perpetual trading ecosystems. HYPE is firmly rooted in that story, which explains why traders persistently pursue momentum in spite of already high valuations.
The psychological $60 mark, and the potential all-time high area beyond it, are currently the locations of the next significant test. It becomes more likely that price discovery will continue if HYPE consolidates above $55 without a significant drop in volume. However, traders should not disregard this risk profile. Rarely do vertical rallies last forever without periods of retreat. The $48-$50 breakout area is the first significant support zone if momentum wanes.
Pressure on Shiba Inu eases
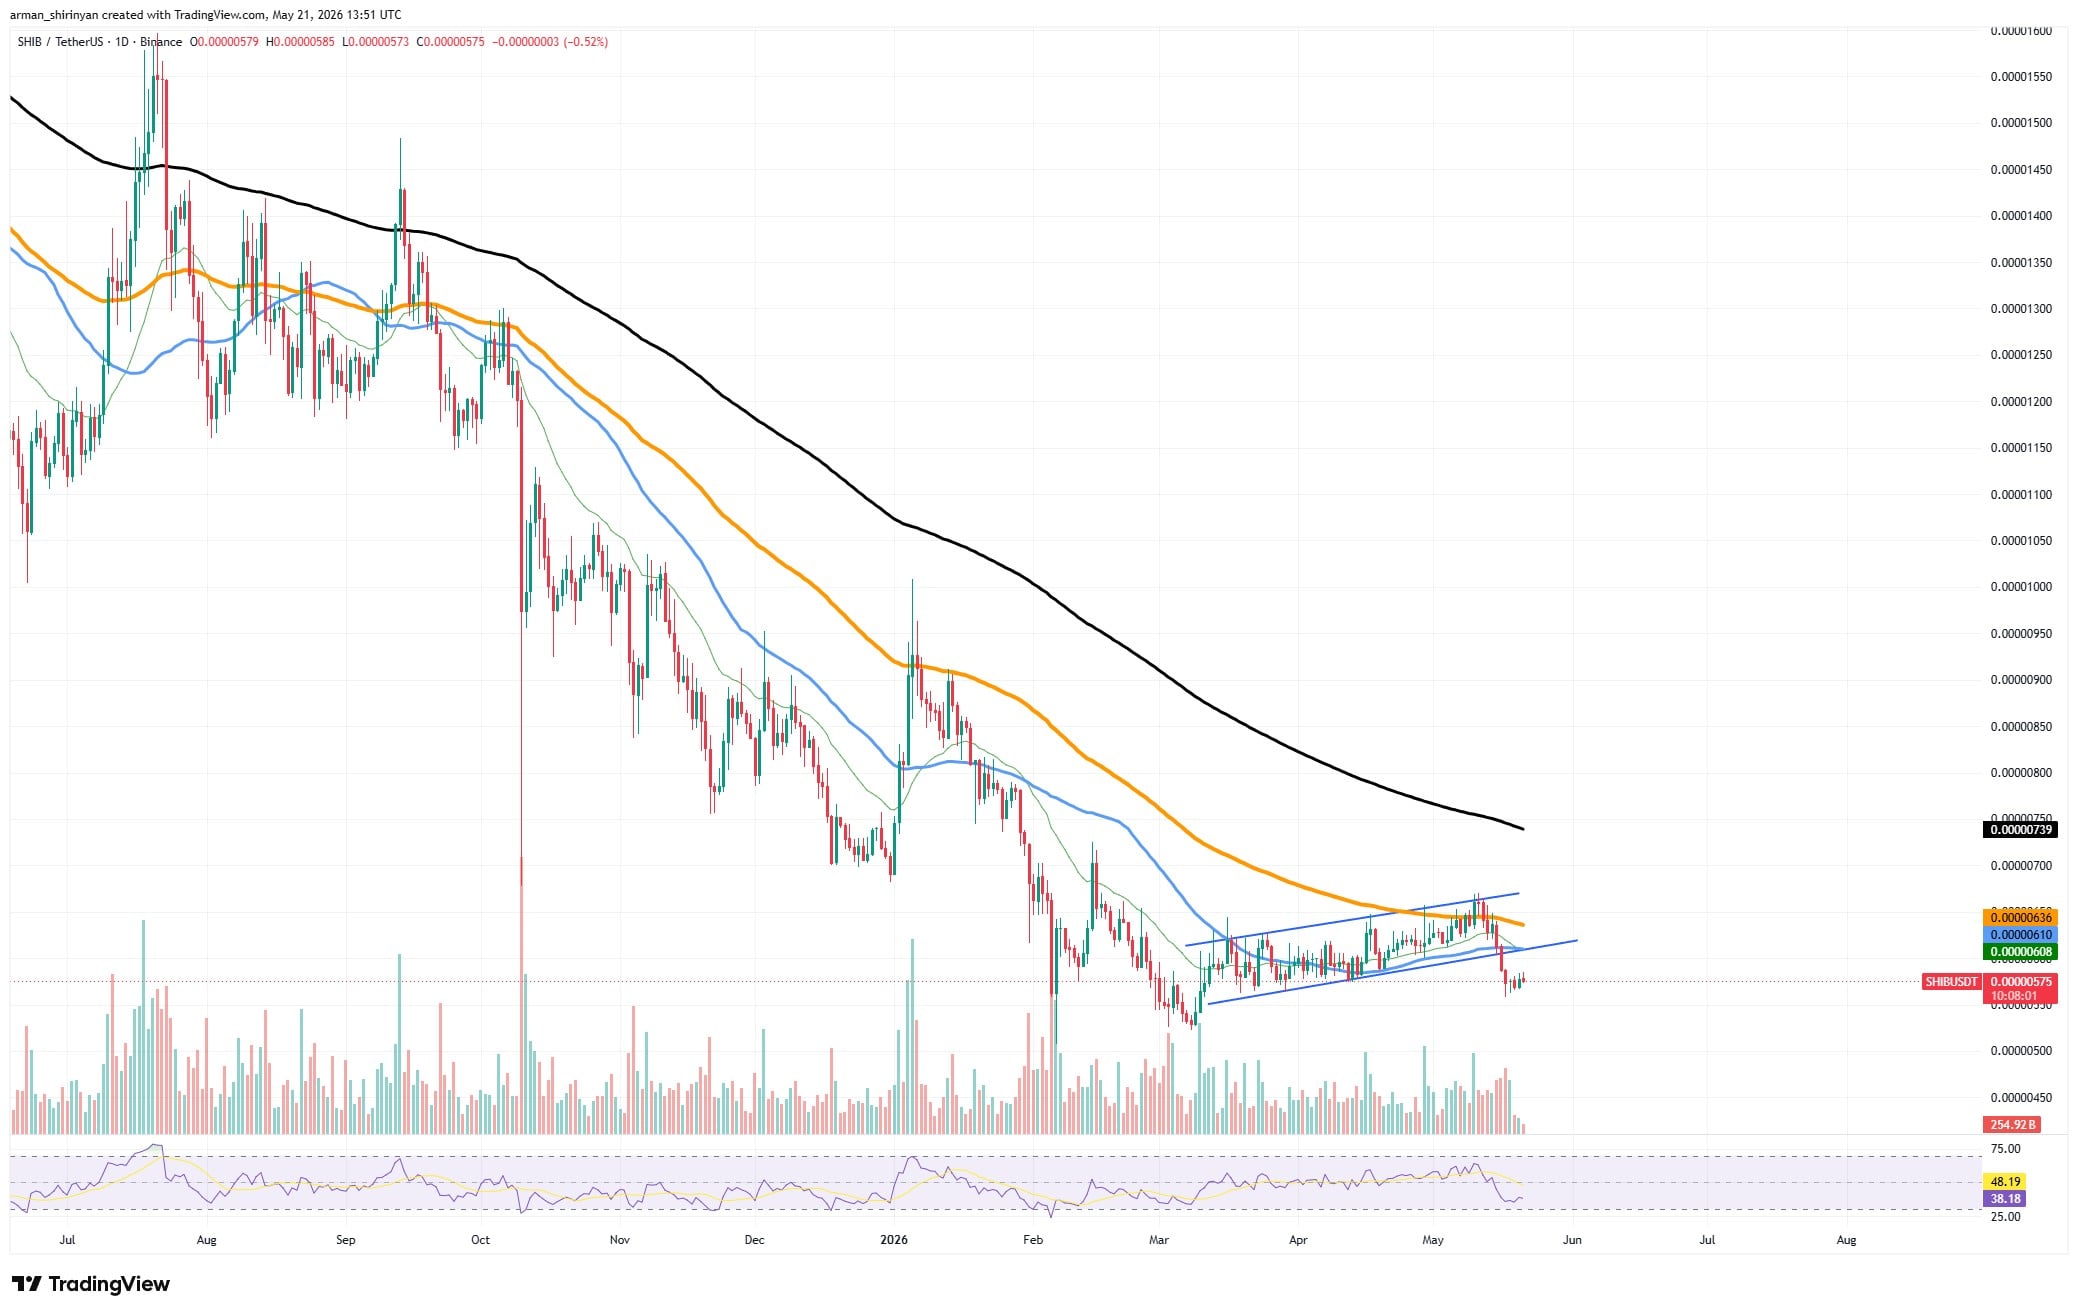
After failing to sustain its recent breakout attempt and increasing sell-side volume, Shiba Inu is under intense selling pressure, with technical indicators and volume structure now leaning more and more bearish. While some segments of the larger cryptocurrency market are still rising, SHIB is still stuck in a protracted downward trend that hasn't shown any clear indications of turning around.
The rejection from the ascending wedge structure that had been forming since March is the most worrisome development. SHIB made a brief attempt to break above declining resistance, but sellers quickly overpowered the move, pushing the price back below the important short-term moving averages and trend support. The unsuccessful breakout now risks becoming a traditional bull trap.
The situation is made worse by volume behavior. Participation in downside sessions is starting to outpace that of recovery attempts, indicating distribution rather than accumulation. Because meme assets like SHIB mainly rely on speculative momentum and retail enthusiasm, this distinction is important.
Technically speaking, SHIB is still trading below the 200-day moving average, which continues declining and supports the larger bearish structure. Additionally, the 50-day and 100-day moving averages are compressing above, forming a layered resistance zone that bulls have been unable to recapture on multiple occasions.
The same weakness can be seen in momentum indicators. The RSI is still declining and has rolled over below the neutral zone, indicating a decline in buying interest. SHIB is still trapped in low-conviction consolidation, with a deteriorating structure, in contrast to stronger assets that are currently entering phases of expansion.
The recent local lows in the 0.00000550 region are currently close to the important support area. If that level is not held, traders may abandon their positions and short-term holders may start to exit, causing SHIB to enter another phase of accelerated decline. On the upside, before any significant recovery narrative is credible, bulls would need to reclaim the wedge breakdown zone and push back above the 100-day moving average.
Toncoin recovers
Following a violent breakout from protracted consolidation, Toncoin has experienced one of its strongest short-term recoveries in months, regaining the psychological $2 level. The move represents a significant change in momentum for TON, which has been stuck in a grinding downtrend for the majority of the last year due to dwindling participation and frequent rejection from important resistance zones.
The actual breakout was violent. Before sellers imposed a cooldown phase, TON exploded from the $1.30 area toward almost $3. Buyers have so far protected the majority of gains despite the retracement, which has prevented the asset from completely collapsing back into its previous range and instead allowed it to stabilize around $2. This distinction is important because, when momentum is weak, failed breakout rallies typically retrace much deeper.

For the first time in a long time, TON is technically trading back above its 50-, 100-, and 200-day moving averages. The most significant structural support level on the chart is now essentially the 200-day moving average in the $1.75-$1.80 range. Bulls maintain medium-term control as long as TON stays above that range.
Additionally, volume shows that this was not a singular spike in liquidity. During the breakout phase, trading activity spiked sharply, indicating widespread participation as opposed to a thinly traded move. Despite the current consolidation, volume remains high, indicating that the market is actively repositioning rather than giving up on the asset.
Momentum indicators briefly entered overheated territory before starting to cool. By reducing the risk of immediate exhaustion, the RSI has already decreased from extreme levels, improving the structure. The market now seems to be moving from panic buying into a phase of decision-making, where traders decide whether TON should be repriced for an extended period of time or if there was only a brief short squeeze.
The $2.20-$2.30 area, where past breakdown structures and historical resistance overlap, presents the largest obstacle. The path toward $2.70 and possibly the recent spike high near $3 would be reopened by a clean breakout above that range. A wider correction toward the moving average cluster around $1.65-$1.75 could result from failing to hold above $1.90, which would seriously undermine the recovery narrative.
 Dan Burgin
 U.Today Editorial Team