The “war” for second place dominance continues between Ripple and Ethereum. The latter is winning the latest clash, surpassing Ripple once more to re-flip the standings. Lately we’ve seen multiple switches in rankings, but the gap remains relatively small between most tokens, including these two, not counting BTC: XRP market cap stands at $12,525,499,421 while the Ethereum circulating supply is valued at $12,918,588,656, a very narrow margin indeed.
A lot of the flippening is due to Ethereum’s solid performance over the last few days. The price jumped from $100 vicinity to $123 and comes on the back of news from the SEC. The SEC says a BTC ETF is inevitable and that means an ETH ETF is right being. The climb can also be attributed to short squeezing: a lot of people were short ETH on major crypto trading platforms and the initial climb “squeezed” them out and forced them to buy back their shares.
With these two catalysts in place, along with the long-anticipated Constantinople upgrade, a sustained move for higher for ETH/USD is all but assured.
Ethereum (ETH/USD) Price Prediction
Posting gains of almost 19% over the last 7 days, Ethereum is enjoying a sold climb but don’t let it fool you, the coin is still in a long-term bear market. However, the low at $100 seen on the 4-hour chart is a higher low compared to the previous one at $80 - $83 so we can hope for a stronger recovery in the long run.
The break of the bearish trend line seen on the chart, marked the beginning of the strong push north and was followed soon after by a bullish cross of the two moving averages. The 50 period Exponential Moving Average crossed above the 100 period EMA for the first time in a relatively long period, which could mark the beginning of an uptrend.
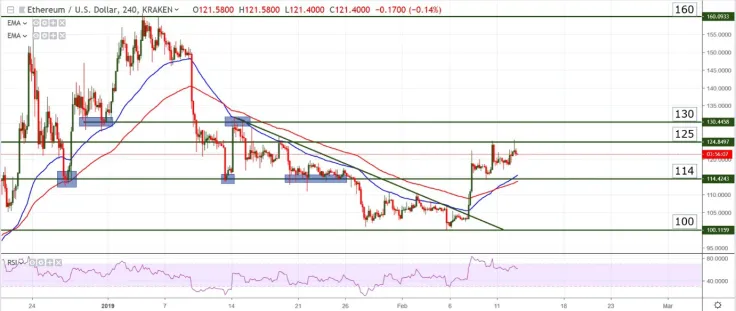
The first barrier is located at $125 and as we can see, the bulls already tried but failed to break it, so maybe it’s time for a small retracement lower which will allow for more bullish pressure to build up before a real break. Over the next 6 months I expect to see this token retest $160 at least.
Support zone: $114 and the moving averages
Resistance zone: $125 - $130 followed by the key level at $160
Most likely scenario: potential pullback or sideways choppy movement; another attempt to break resistance should follow soon
Alternate scenario: drop below $114 support
Litecoin looking to implement MimbleWimble
The Litecoin Foundation recently announced they are exploring a cooperation with Beam. The partnership could result in the implementation of the MimbleWimble protocol. This means, theoretically, users could change their existing, regular Litecoins into MimbleWimble variants, which would bring increased privacy and almost complete anonymity. The news spurred a huge climb for Litecoin, and the move may have legs, assuming the collaboration bears fruit.
Litecoin (LTC/USD) Price Prediction
The massive bull rally took the pair above $40 key resistance and stopped at $47 which is a level that has been support in the past, now successfully turned into resistance. It looks like the buyers will pause here as some of them are banking profits to limit risk, so we will likely see a period of sideways movement before price can travel to $50 psychological resistance and $56 technical level.
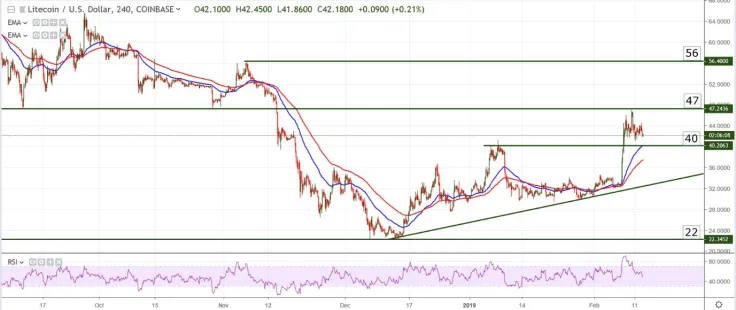
The medium-term outlook is bullish as long as the pair remains above the bullish trend line seen on the chart or even better, above $40 support. Additionally, the SEC news is another positive catalyst for this token as LTC, due to its top 3 status, can easily be lumped into any ETF containing BTC or ETH. I expect to see this token retest $56 at least, over the next 6 months.
Support zone: $40 and the bullish trend line
Resistance zone: $47, $50 and $56
Most likely scenario: minor pullback followed by break of resistance and move into $50
Alternate scenario: extended period of ranging movement with a bearish bias
 Dan Burgin