
Although, Ripple’s XRP didn’t live up to traders’ expectations and didn’t bring much profit in the last bull run, it seems to be resistant to the downtrend that’s coming.
At least, this is what crypto experts say. Let’s see why traders remain optimistic and still believe that XRP can reach $0.5 shortly. Read Ripple price forecasts from TradingView.
XRP is preparing for bullish outcomes
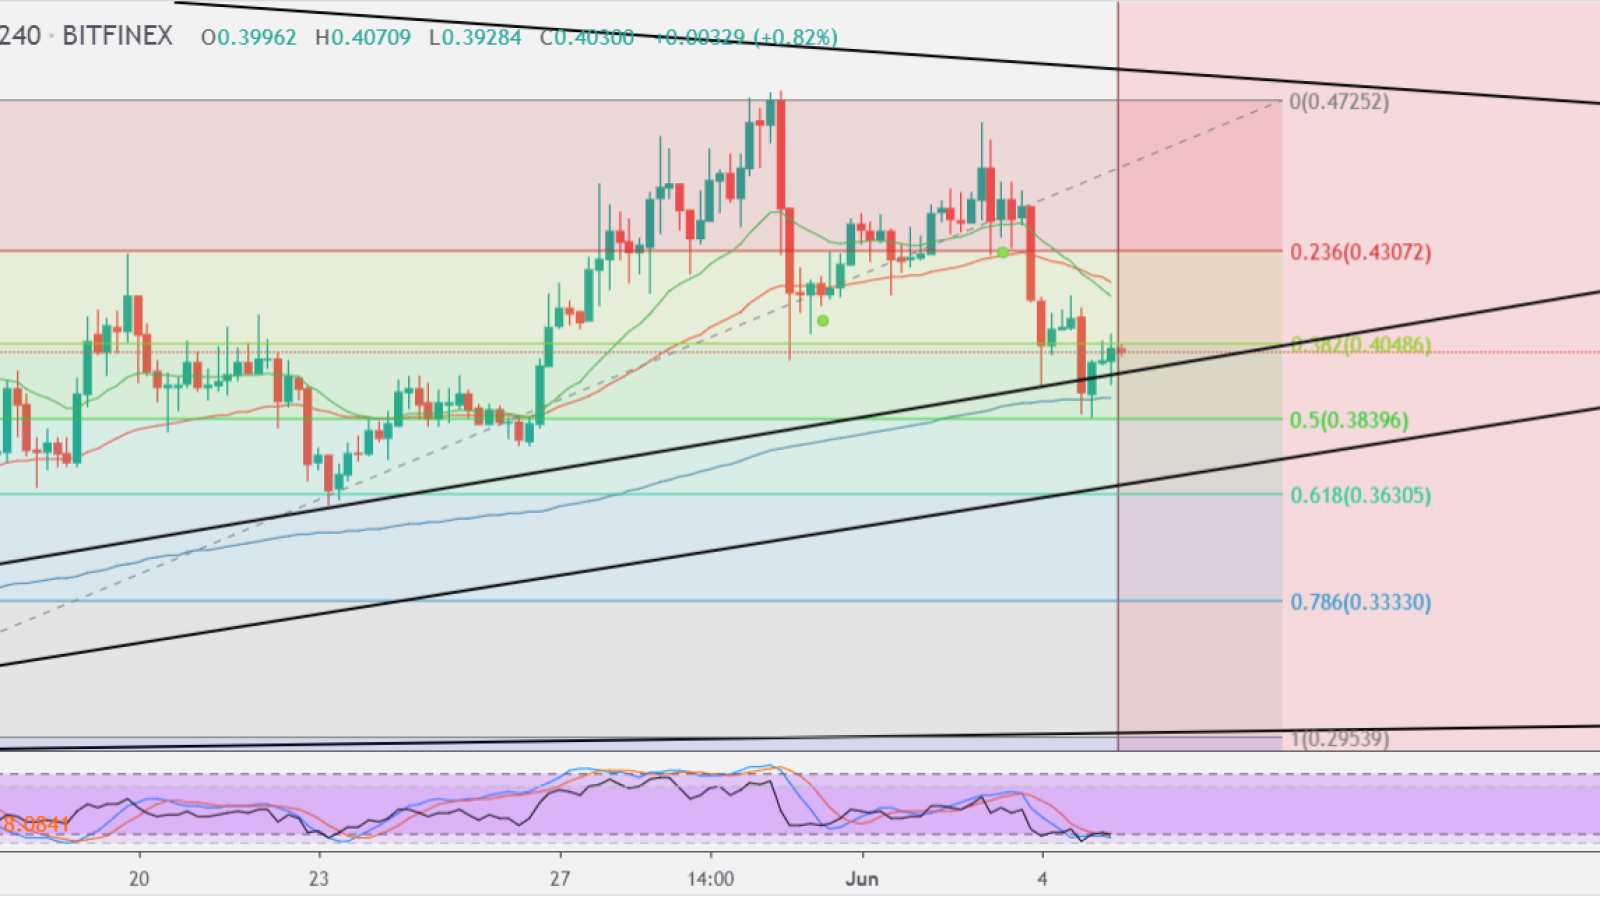
We have managed to stay at the upper trendline with the Daily candle. RSI is oversold, especially on under the Daily timeframe. On the Daily, RSI is on a neutral level (slightly oversold).
On the 4H 21EMA is crossing 50EMA to the downside, which means that we could still try to test the trendline at around 0.363$.
Generally, we are on a good way to prepping XRP for a bullish outcome. Let’s hope that we can close the weekly candle way up higher than now so that we don't get a bearish engulfing pattern on the weekly.
The price goes down, indicators show up
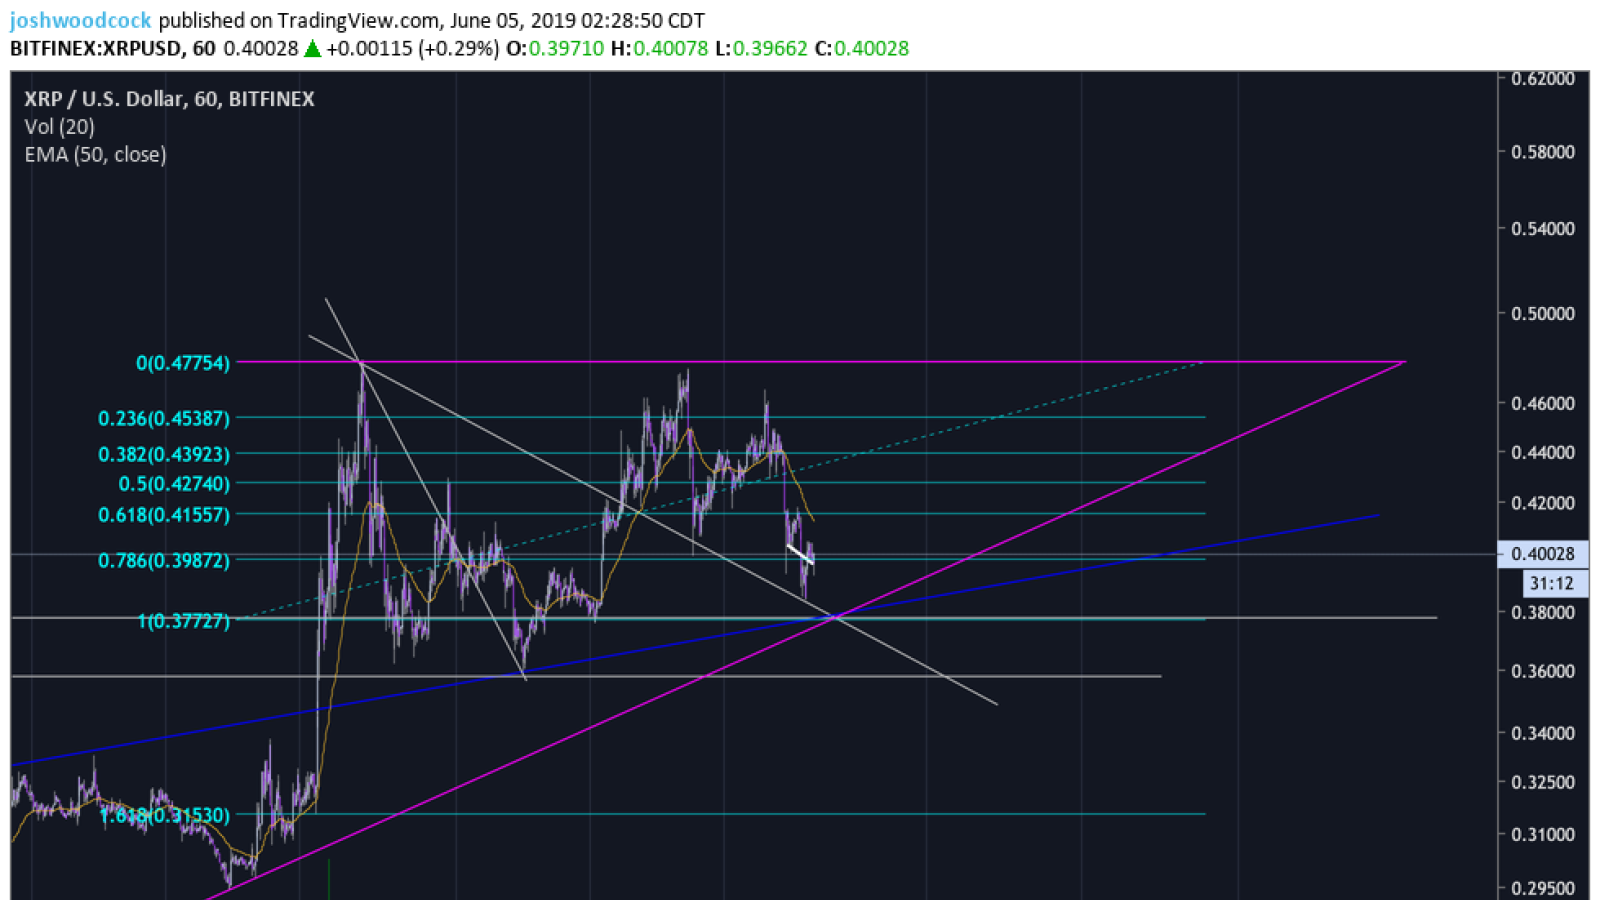
Right now, all indicators are going up while the price is going down on the 1-hour timeframe. We could see some further dipping but right now it shows there is a reversal towards the upside in play. RSI, MACD, CCI – all hint that Ripple can grow.
Also, look at the pink triangle forming: the bigger is the triangle, the bigger will be the breakout.
Volume vs Price disconnection
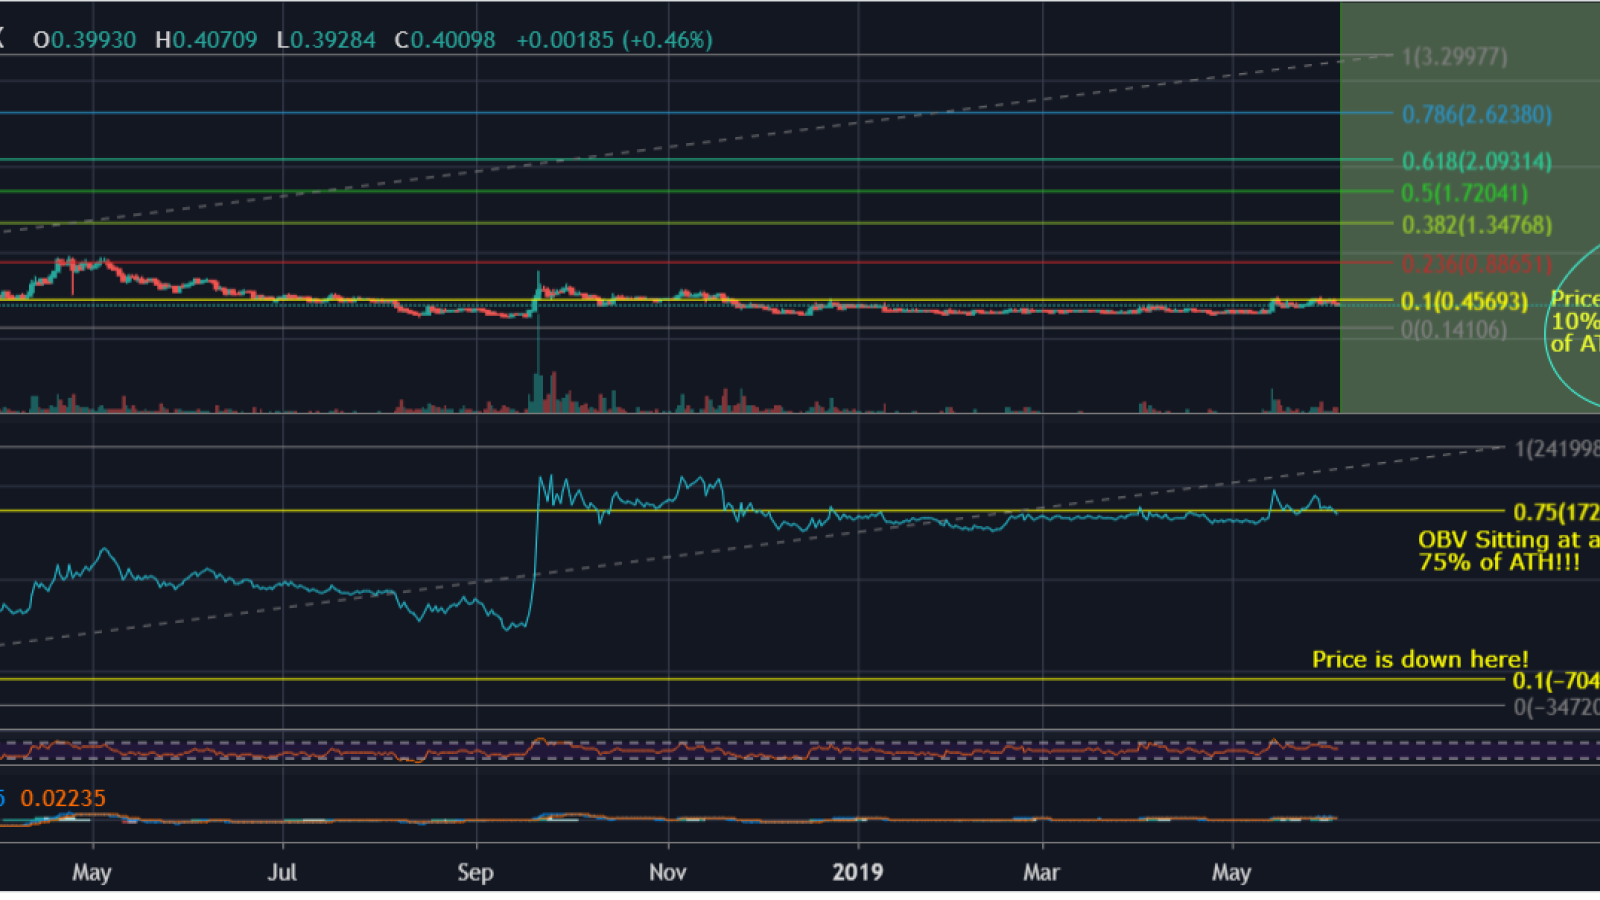
Here’s an interesting outlook at what’s happening with Ripple market. If we take a look at BITFINEX XRP/USD, we see that we are currently sitting at around 10% of the all-time high in price.
But if we compare this to On Balance Volume we see that we are currently sitting at 75% of the all-time high, this is a massive disconnect.
On Balance, Volume measures the net inflow vs outflow of money into an asset, as we can see in the last pump that BITFINEX XRP/USD has there was a huge amount of money that came into the asset, all while price only moved a little in comparison.
What does this mean?
It means that there are some HUGE bulls buying Ripple, these same bulls do not want the price going up meaning they are in the accumulation phase.
It also means that there is not a lot of money leaving BITFINEX XRP/USD and the same can probably be said for BINANCE XRP/BTC.
Thus, if people want Ripple to go up, it will go up.
Elliot wave 3 is coming
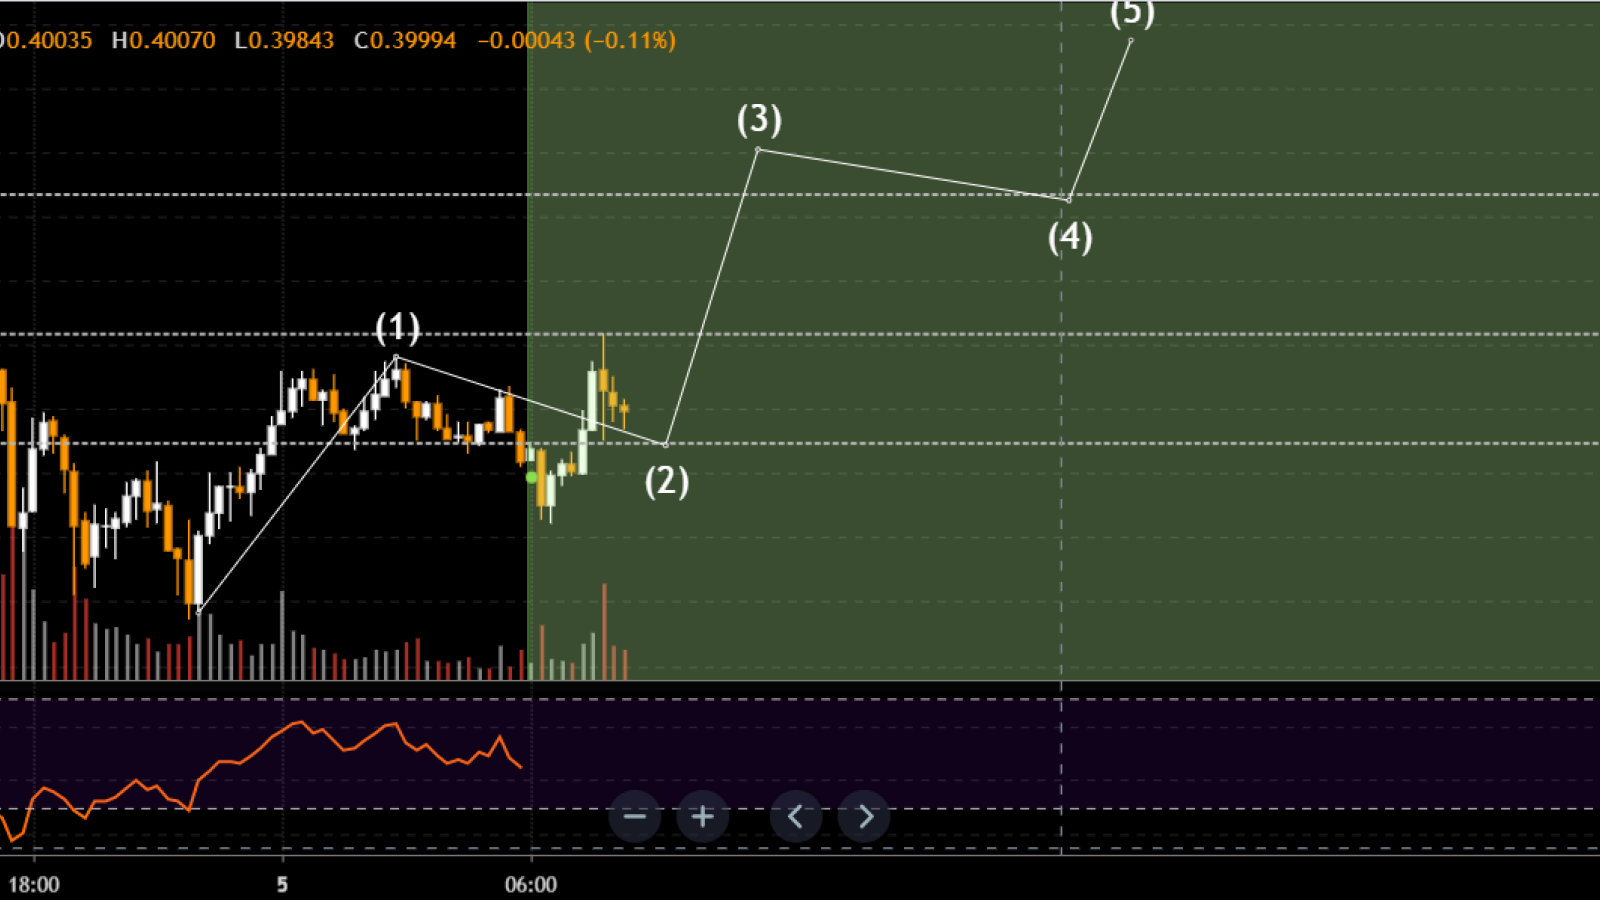
On this price chart, you can see a flag and Ripple price going along Elliot wave 3. Luc-zuiderhoek offers to enter the market at $0.39650 and exit at $0.40800.
Note that we have a small break to the downside to get the tight stop losses out of the way.
The recent rally from wave (2) low at 0.35976 unfolded as an impulse Elliot Wave structure in wave (i) in blue. According to Elliot Wave Theory, a three-wave pullback follows every impulse move before price resumes in the direction of the larger trend. This played well for Ripple this time.
The pullback also retraced 78.6% of the rally in wave (i), besides wave c of (ii) equal wave "a" in the blue box which is a common characteristic of a zigzag.
Considering that wave (ii) has met all the requirement, we could expect the price to start moving in the direction of the impulse trend in wave ( iii ).
And as long as the price stays above the minor invalidation level at 0.35976, Ripple price has the potential to reach 1.618 Fib extension of wave (i) at $0.57201 area.
Ripple price charts by TradingView