Disclaimer: The opinions expressed by our writers are their own and do not represent the views of U.Today. The financial and market information provided on U.Today is intended for informational purposes only. U.Today is not liable for any financial losses incurred while trading cryptocurrencies. Conduct your own research by contacting financial experts before making any investment decisions. We believe that all content is accurate as of the date of publication, but certain offers mentioned may no longer be available.
Ripple has restore to its $0.25 level despite the bearish tendencies, and it striving to break the major $0.30 resistance point again. Does XRP has enough power for that, and what to expect in the nearest days? TradingView users are discussing Ripple (XRP) price predictions and analyses to forecast the next serious uptrend.
Back in accumulation zone?
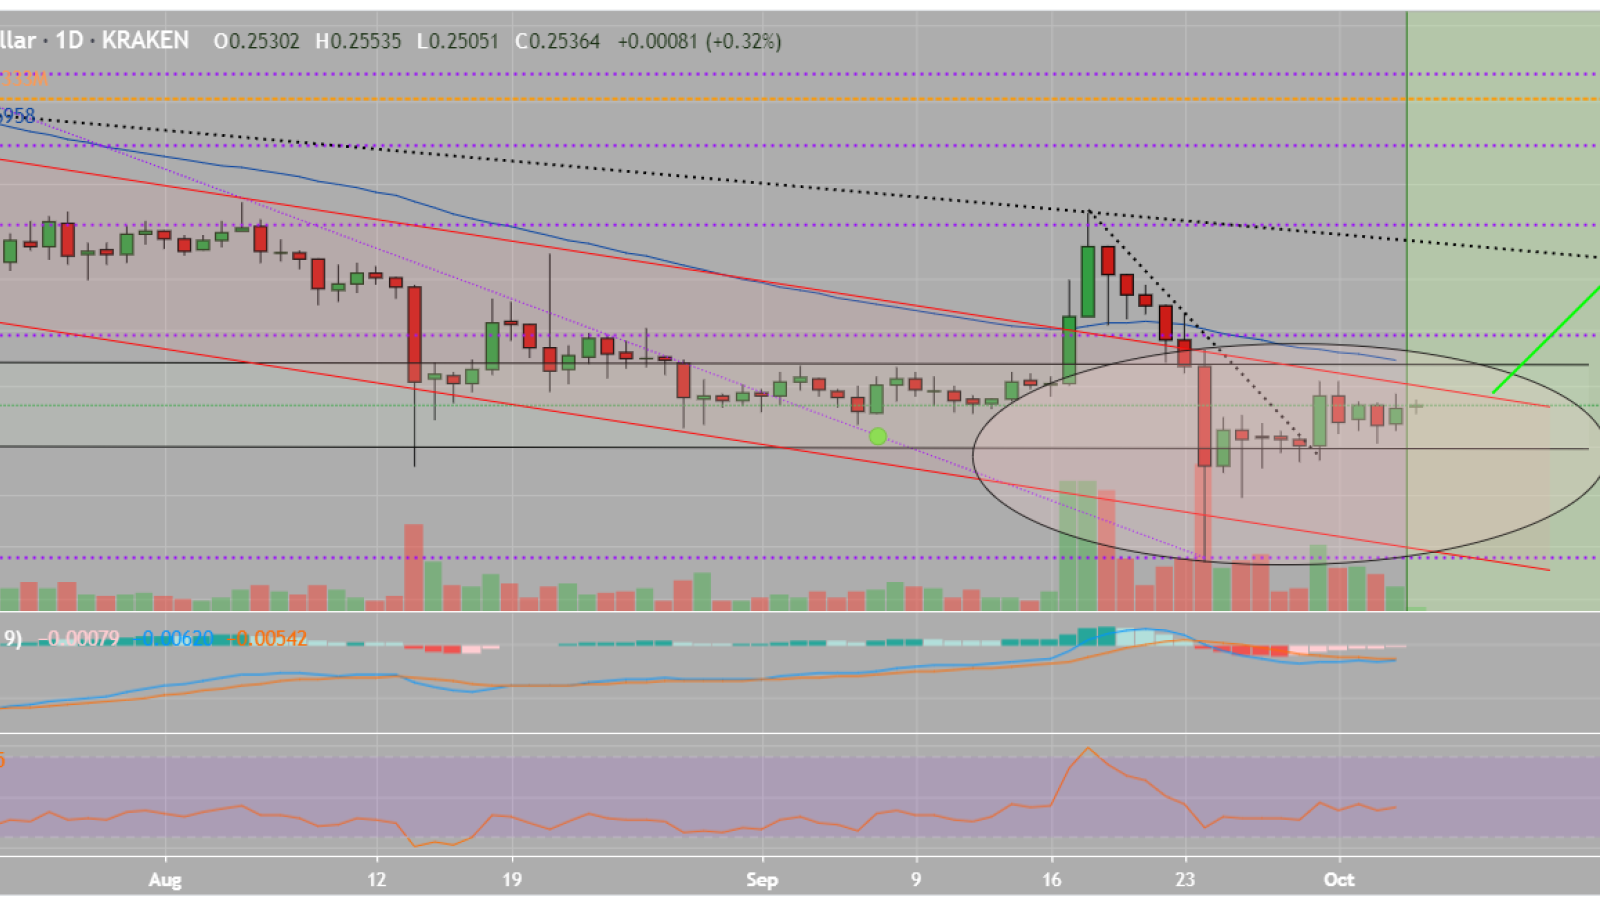
We see that XRP has broken out the channel, which was in the accumulation zone. But the rush rally ended quickly and the following correction led XRP even below the very important support, which is still the same accumulation zone. What are the signs of positive trend?
-
XRP broke out to the bottom of the descending parallel channel – it’s very serious!
-
Luckily, Ripple turned on the bad level and returned in both: parallel channel (descending) and accumulation zone (horizontal).
-
MACD and RSI have grown against the trend - with big volatility of course. Their trends tend to be and to stay positive.
-
Also the volume of trades has come back, indicating the interest of investors.
-
Ripple is now approaching the upper limit of the falling trend channel - even if it continues sideways.
Speculative investors can accumulate some more Ripple-tokens on this level, hoping that XRP will break through the resistances. In this case the next resistance could be the falling trendline (dotted) at actually 0.30$.
XRP gets bullish
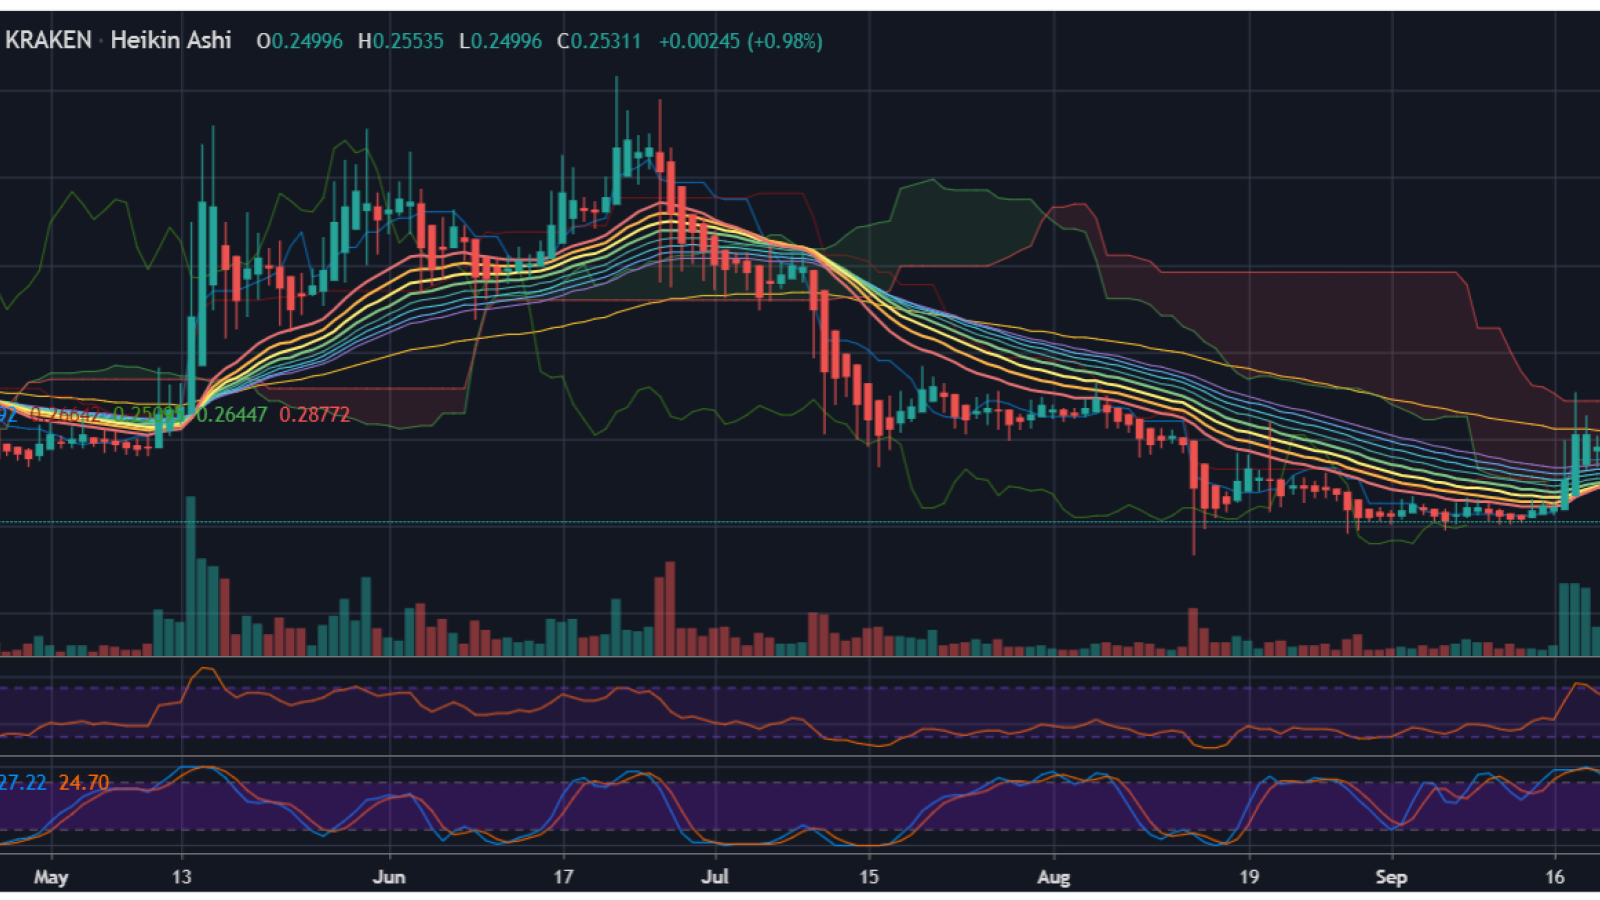
Ripple (XRP) has seen a promising 5% increase over the past week, bringing its price up to $0.25.
The latest increase is largely due to XRP rebounding against BTC as it continues tryout to break above the resistance of the 3100 SAT level.
The coin has struggled over the past three months after dropping by a steep 36%. However, the market looks to be on the road for bullish recovery. The nearest level of resistance above $0.26 lies at $0.27, further levels are at $0.2811, $0.29 (100-days EMA ), and $0.30, which will take a few weeks to achieve.
XRP is ready to fly?
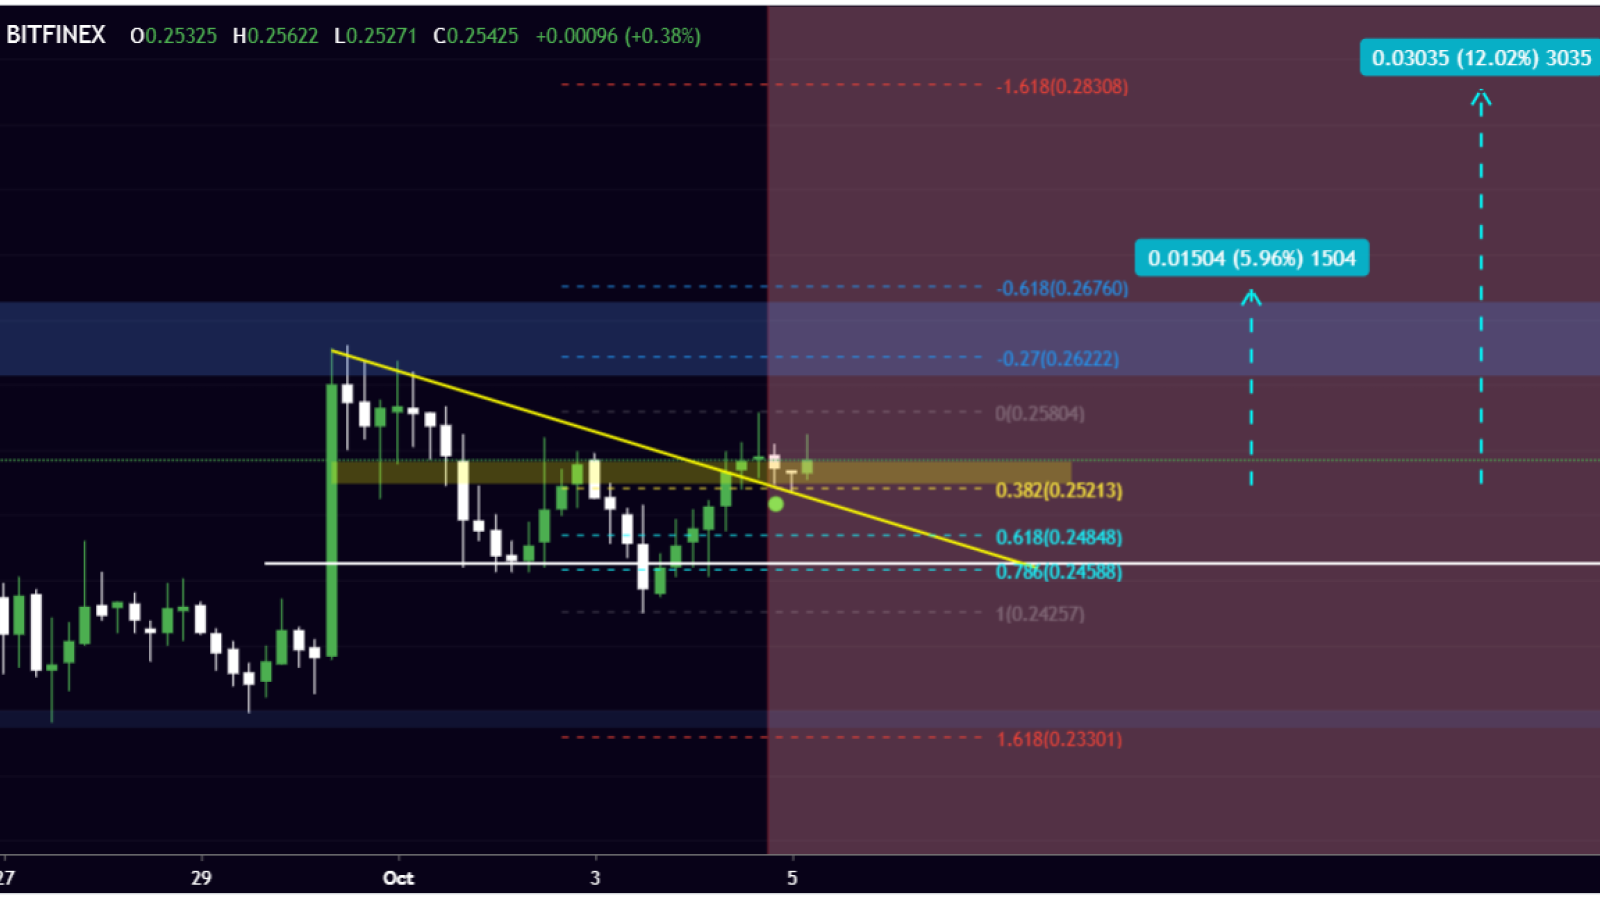
According to the user sdsti, we can see the price broke the trendline and is giving sign of a retest near the 0.382 fib level and the minor support which align perfectly. The first target will be the major support which will lead us to 155 pips, around that time we'll see if the price break or hold that level of support. The worst scenario would be a fake breakout of this trendline which we all know might happen.