Disclaimer: The opinions expressed by our writers are their own and do not represent the views of U.Today. The financial and market information provided on U.Today is intended for informational purposes only. U.Today is not liable for any financial losses incurred while trading cryptocurrencies. Conduct your own research by contacting financial experts before making any investment decisions. We believe that all content is accurate as of the date of publication, but certain offers mentioned may no longer be available.
The market might have finished the correction phase as all Top 10 coins have come back into the green zone. Bitcoin (BTC) and Binance Coin (BNB) are the top gainers, having risen by 4.13% and 6.18% respectively.
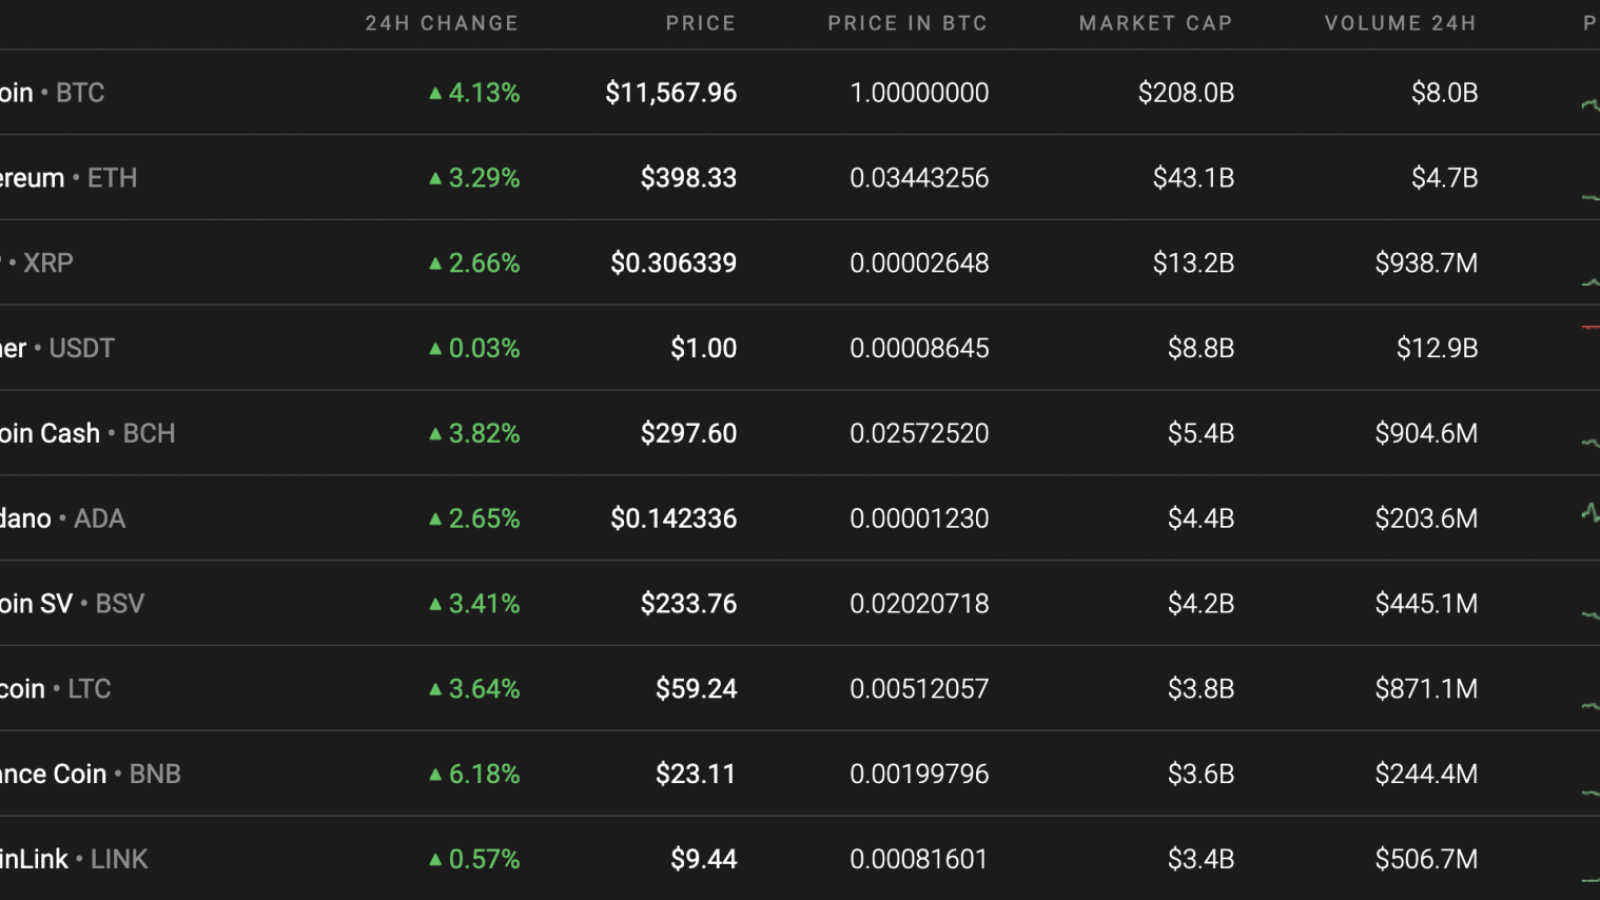
As Bitcoin (BTC) is growing faster than altcoins, its market share has increased and reached the 60% dominance index.
The key XRP data for today:
-
Name: XRP
-
Ticker: XRP
-
Market Cap: $13,792,829,020
-
Price: $0.307446
-
Volume (24h): $2,273,466,785
-
Change (24h): 2.74%
The data is current at press time.
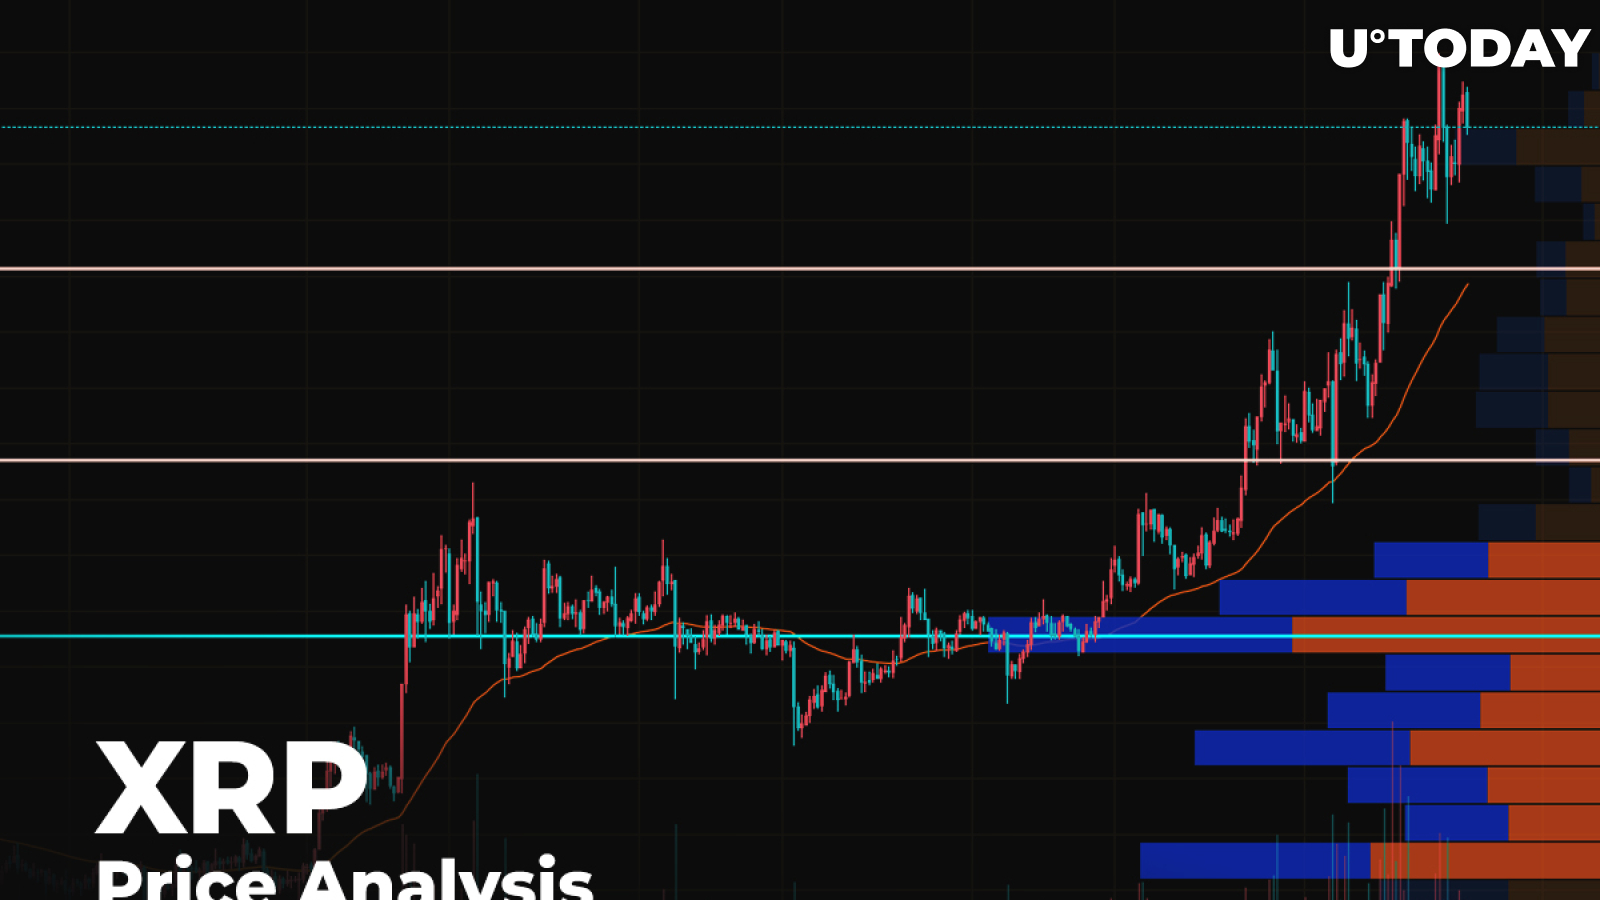
XRP/USD: Can bulls get to $0.31 without a correction?
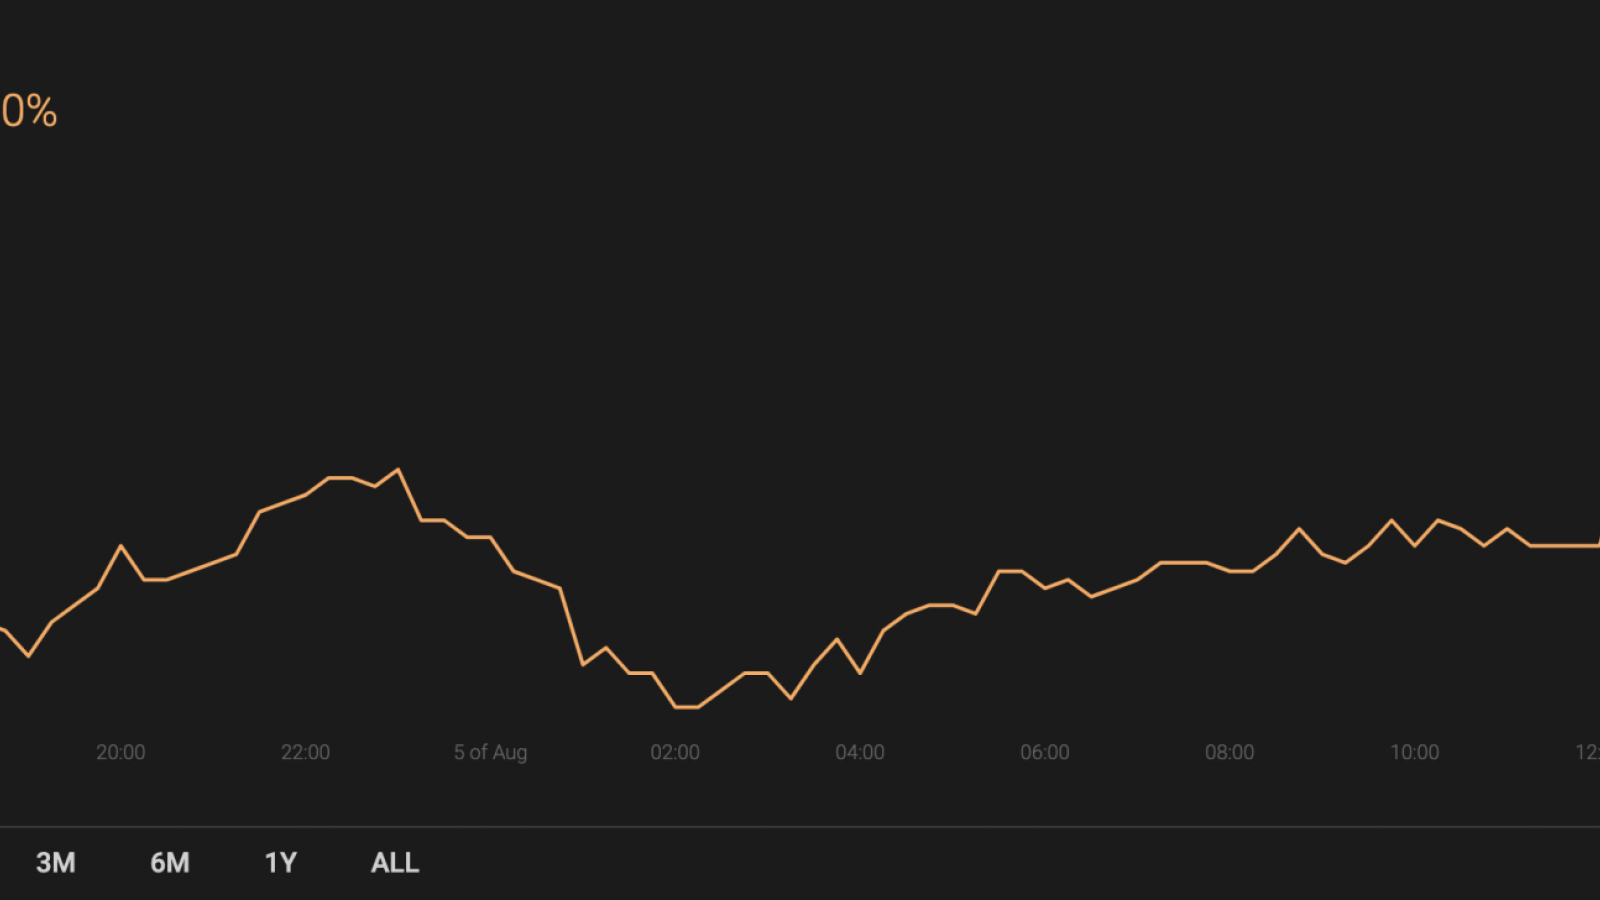
XRP is the least growing coin compared to Bitcoin (BTC) and Ethereum (ETH). The rate of the third most popular coin has risen by 2.74% over the last 24 hours.
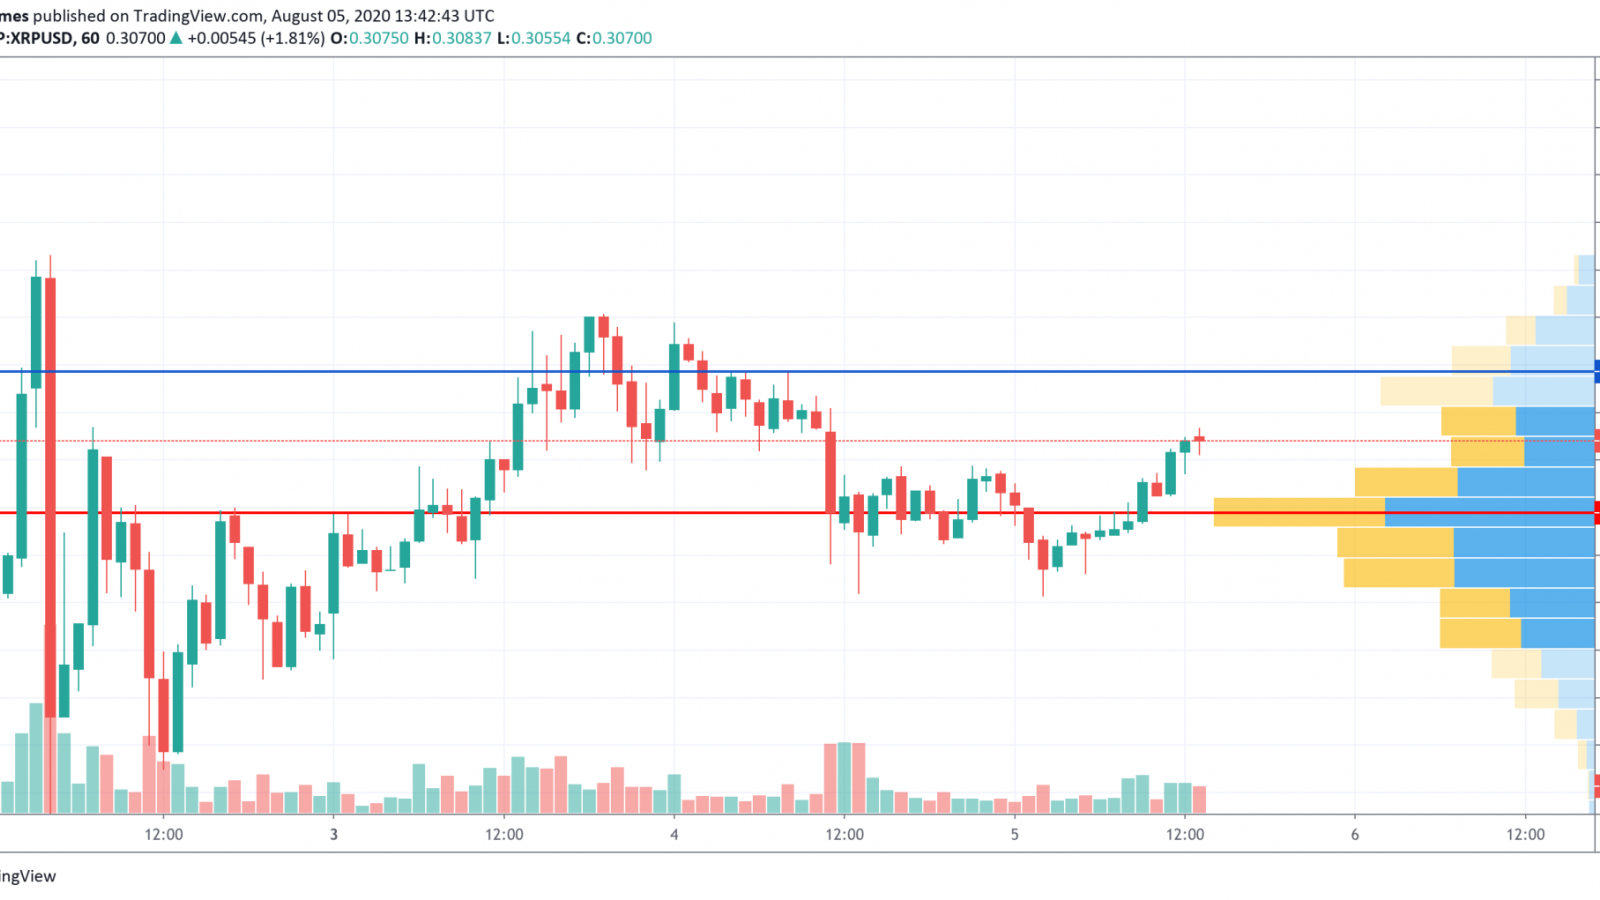
On the hourly chart, XRP has bounced off the support at $0.2950, confirming the bullish mood. The trading volume is moderate; however, liquidity is low, which means that buyers lack energy to keep pushing the rate of the altcoin to new peaks.
In this regard, there is a chance to reach $0.3143, followed by a further correction.
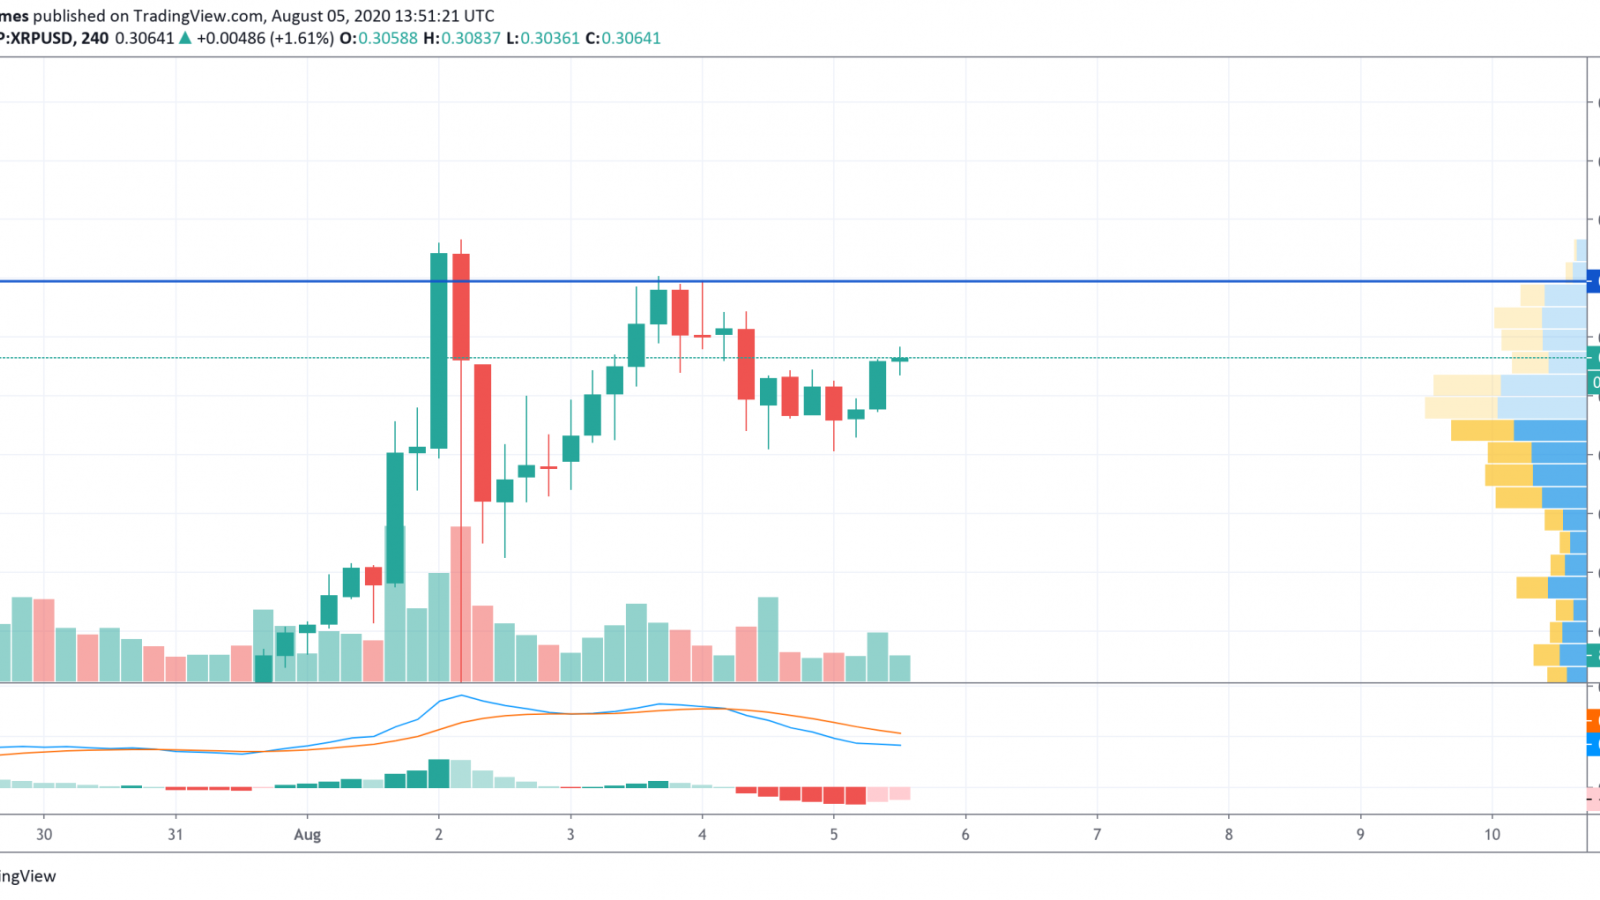
On the 4H chart, the situation is also positive and bulls keep pushing XRP to new heights. The MACD indicator is about to leave the bearish zone, having confirmed buyers' dominance. If the trading volume remains at the same level or even increases, XRP can return to the local resistance level at $0.3195 by the end of the week.
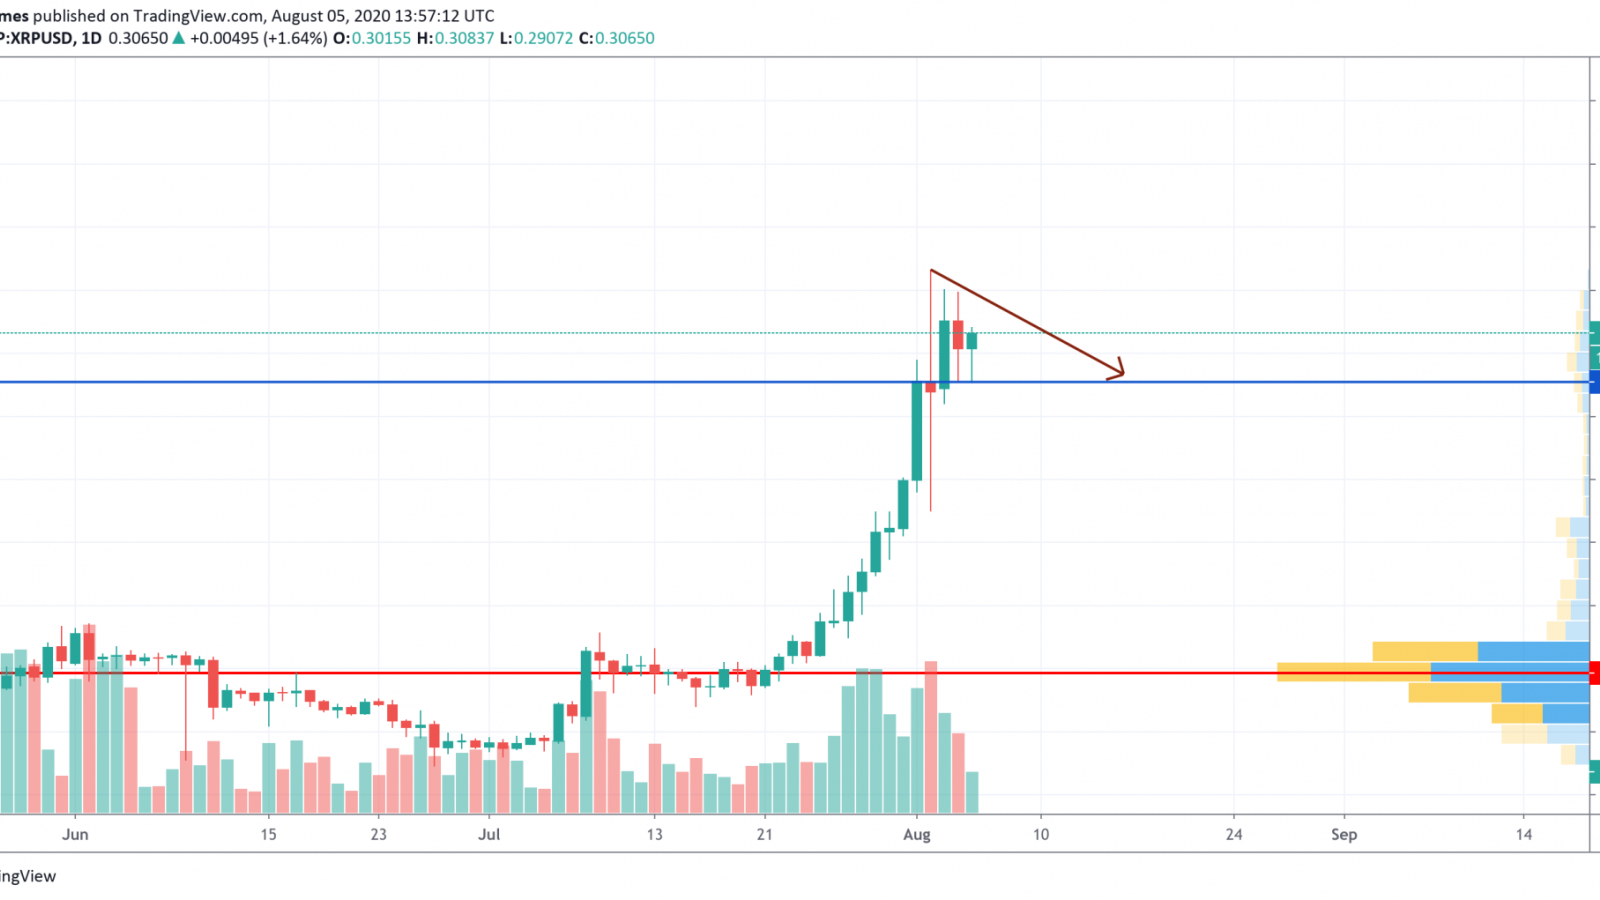
On the daily chart, the bullish trend is about to end as bulls are as powerful as before based on the trading volume, which is declining. Also, liquidity is low, which means there are almost no traders that want to buy the coin at the current rates. For this reason, a decline may begin soon and roll back XRP to $0.29.
XRP is trading at $0.3061 at press time.