LocalBitcoins is a Bitcoin trading platform that was established back in 2012. It is headquartered in Helsinki, Finland, and remains one of the most popular virtual places among those who wish to trade Bitcoin on a peer-to-peer basis. We have recently brought you Struggling Economies in South America Forcing LocalBitcoins Boom which examined how Venezuela, Argentina, Colombia, Peru, and Chile heavily contributed to the increased trading volumes on the website. Now, it’s time to look at the United States.
As was previously shown, the United States is the global leader by the number of Bitcoin nodes, the number of people who own cryptocurrencies, as well as the number of crypto billionaires/millionaires. We thought it would be interesting to also see how the US is doing on LocalBitcoins, so here it is, the history of weekly LocalBitcoins volume, organized biannually (i.e. six month averages or two quarters combined):
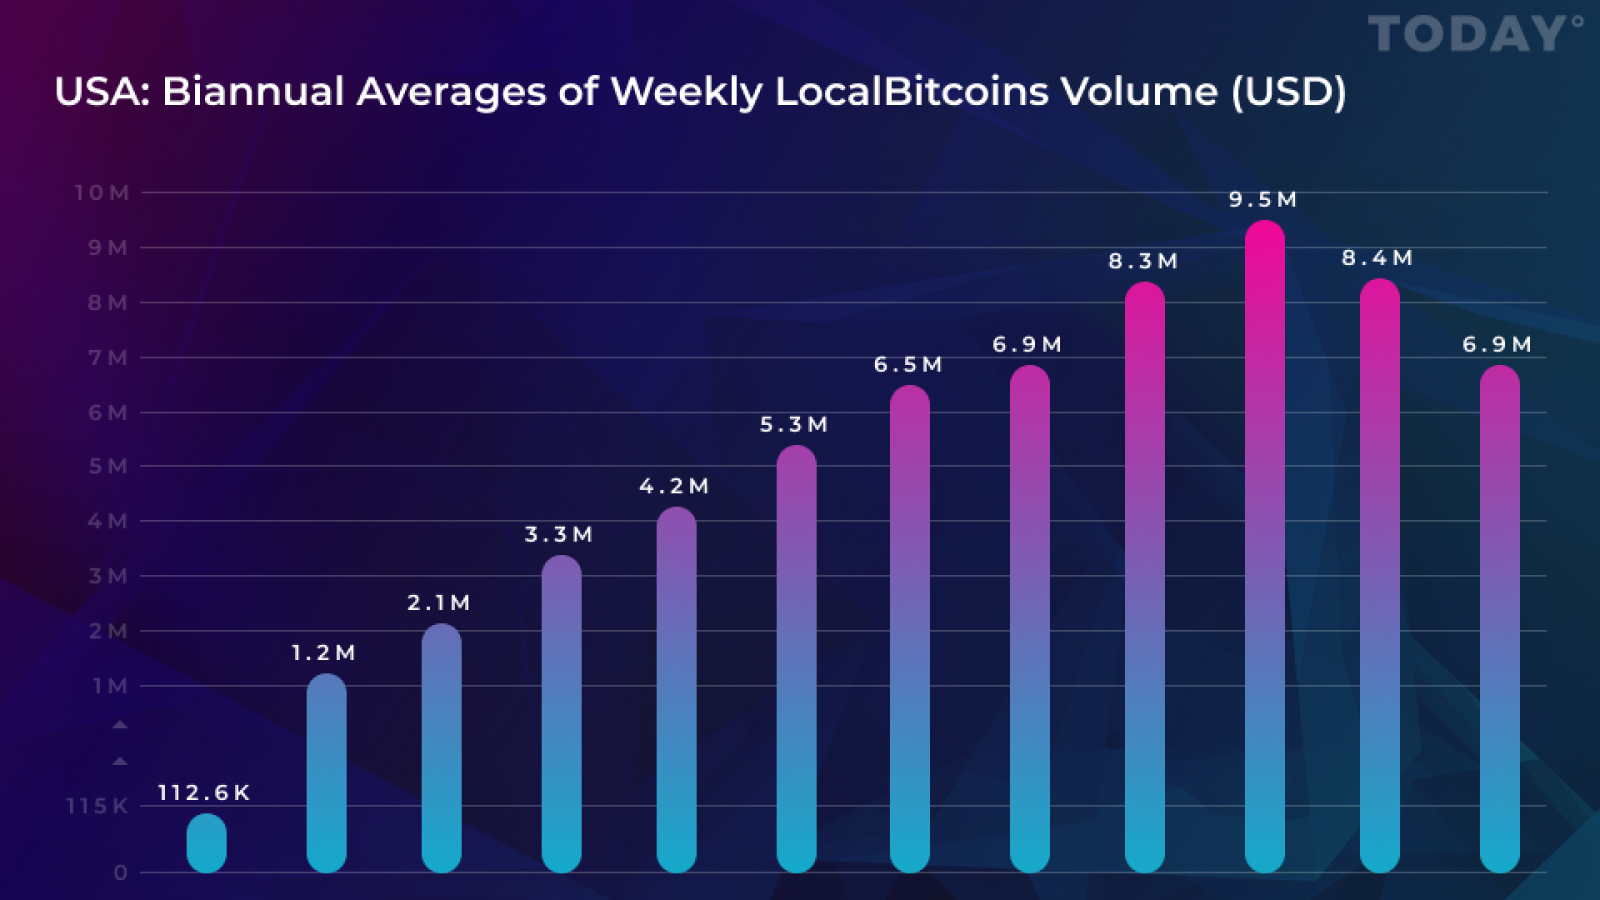
2013: A modest start with around 100K USD per week, followed by a sharp climb in the second half of that year to over 1 million USD per week.
2014: Around 2 million USD per week in the first six months, close to 3.5 million USD per week in the second half of the year.
2015: A continued climb, around 4 million USD per week in the first half, followed by a further increase and the figure growing to almost 5.5 million USD per week in the second.
2016: Both biannual averages show weekly volumes between roughly 6.5 and 7 million USD.
2017: A reach for the figure of 8 million USD per week in the first two quarters and a further leap to 9.5 million USD per week in the second half of the year, during the last Bitcoin bubble.
2018: An expected drop to around 8.5 million USD per week in the first half (note: unlike Latin America, the US is not a struggling economy), followed by a further decrease to the current figure of around 7 million USD per week in the second half of this year.
We hope you found this list useful. Stay tuned for more to come and be sure to also check out these: