
Recently, TRX has been moving sideways without surprising traders or giving them any great expectations. However, sooner or later it must have changed.
What if the time for the break is now? Let’s read Tron (TRX) price predictions from TradingView users to find out how much TRX will cost in the short- and mid-term perspective.
TRX might be heading $0.03
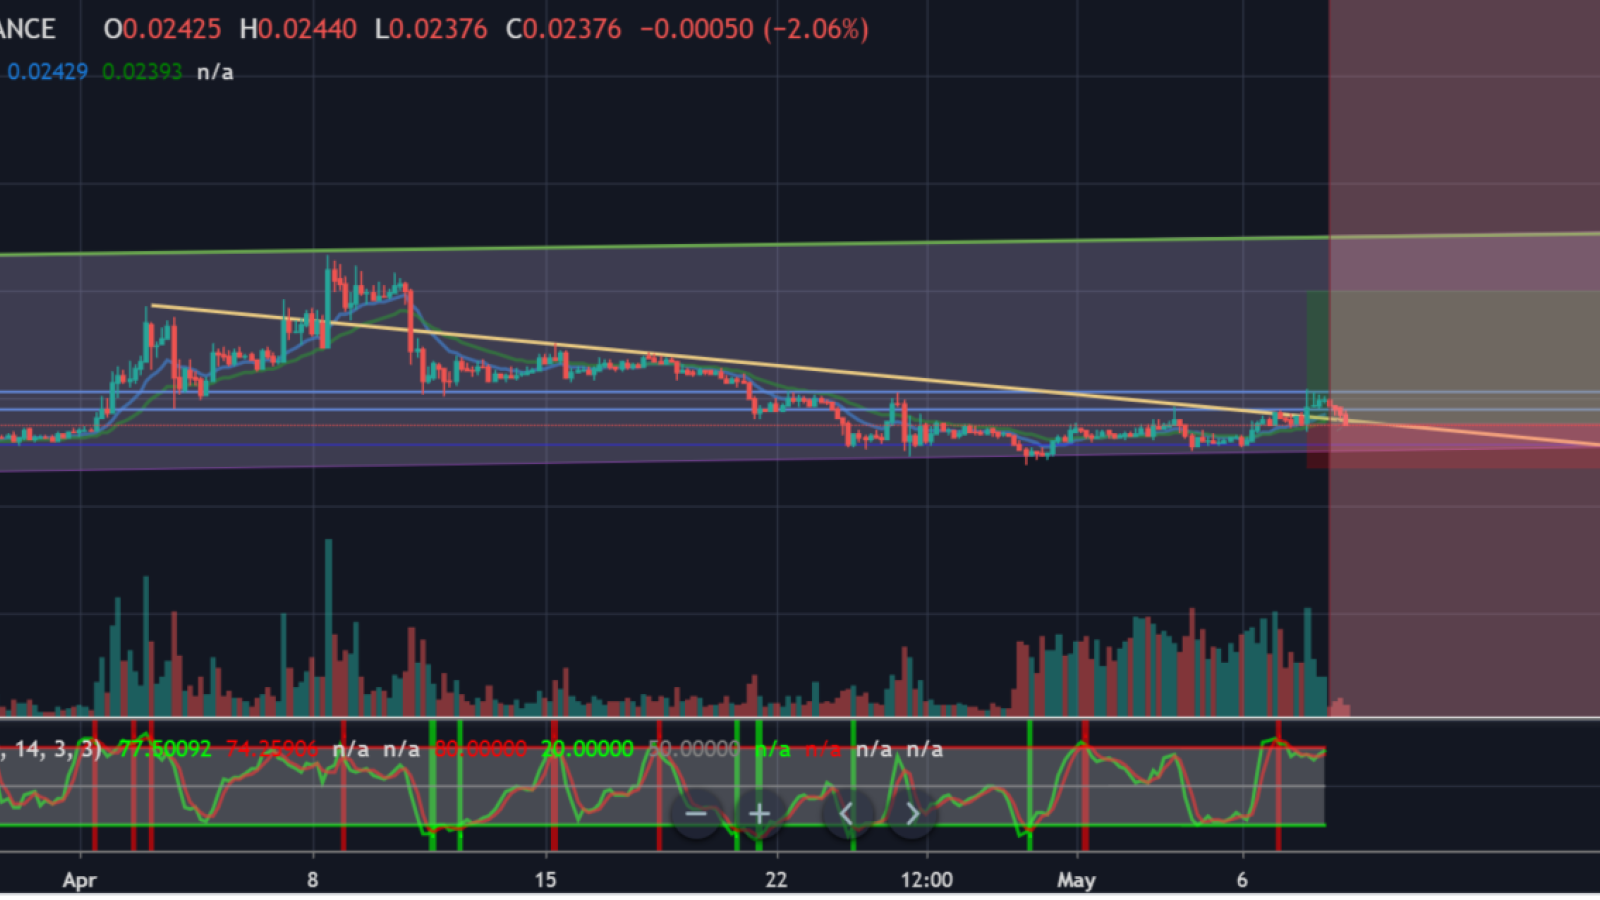
The user Duffalo has noticed that TRX just broke above the small downtrend line. It means that the confirmation for the breakout would be overcoming of the $0.025 area. You can see the grey area on the chart – this is where TRX should move in the nearest time.
TRX should crash?
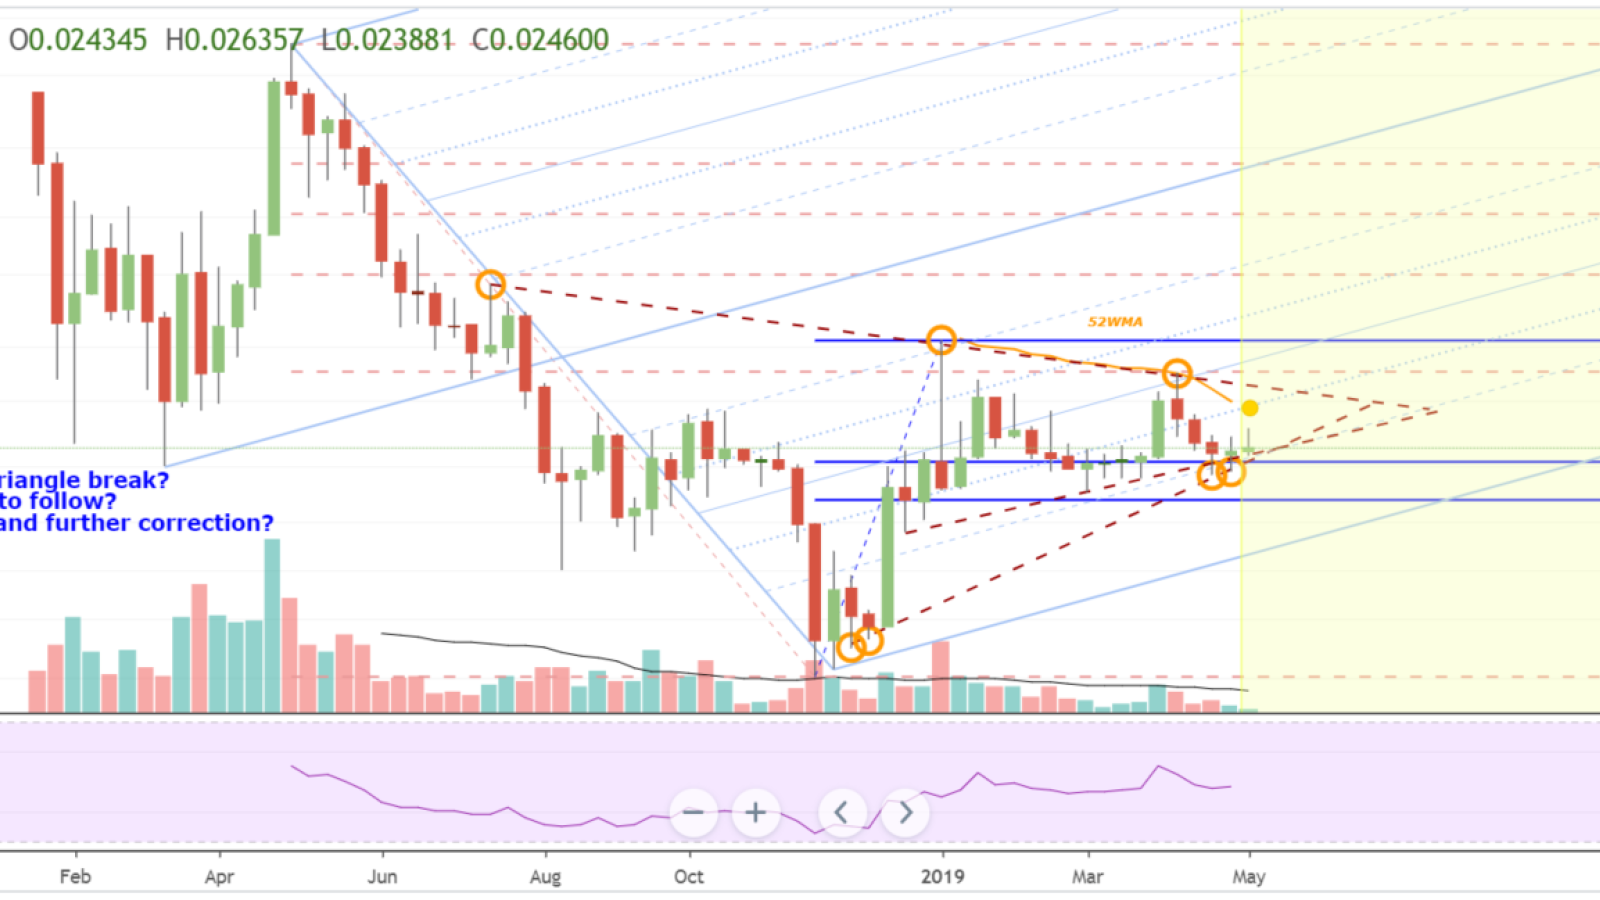
According to Ksh57, we are currently in a broader triangle consolidation so looking for signs of a break either way. Also had two touches off 52-week moving average but failed to react to the downside in a significant manner.
We are also holding above the 25% line of blue pitchfork in the last two weeks.
So, what’s positive in this picture? TRON bottomed late 2018 (not in 2019) and most cryptos that are recovering/constructive did this. We are also still above the blue 0.618 retracements from this rally off the bottom which is also constructive.
Judging by the daily price chart, TRX is currently stuck between 100 and 200-day moving averages but if you dig deeper there was good support off the 200DMA in terms of volume.
On the daily, we can also see the bottom trend line forming triangle has had 4 touches now and failed to break. As for the bearish scenario we have not closed above the RED 0.618 fib that is measured from the high forming the top of the triangle and the low.
Again a break of the triangle would show clear direction as these levels are also guarded closely by the fibs.
If we take a 4H chart, we have just popped outside the near term downtrend. It shows clearly the reaction off lower trendline (and 200DMA). Even if we start pulling back towards the BLUE 0.5 fib we should watch the RSI and volume to find market direction.
All in all, there is potential this is a double top, but we would need to see some larger downside momentum to validate this.
For the bulls, it's all about the bottom trendline and 200DMA. If this pitchfork holds, TRX will soar to the moon, but for now, it is 100% speculative until we at least test/surpass the median line.
TRX will see a bounce
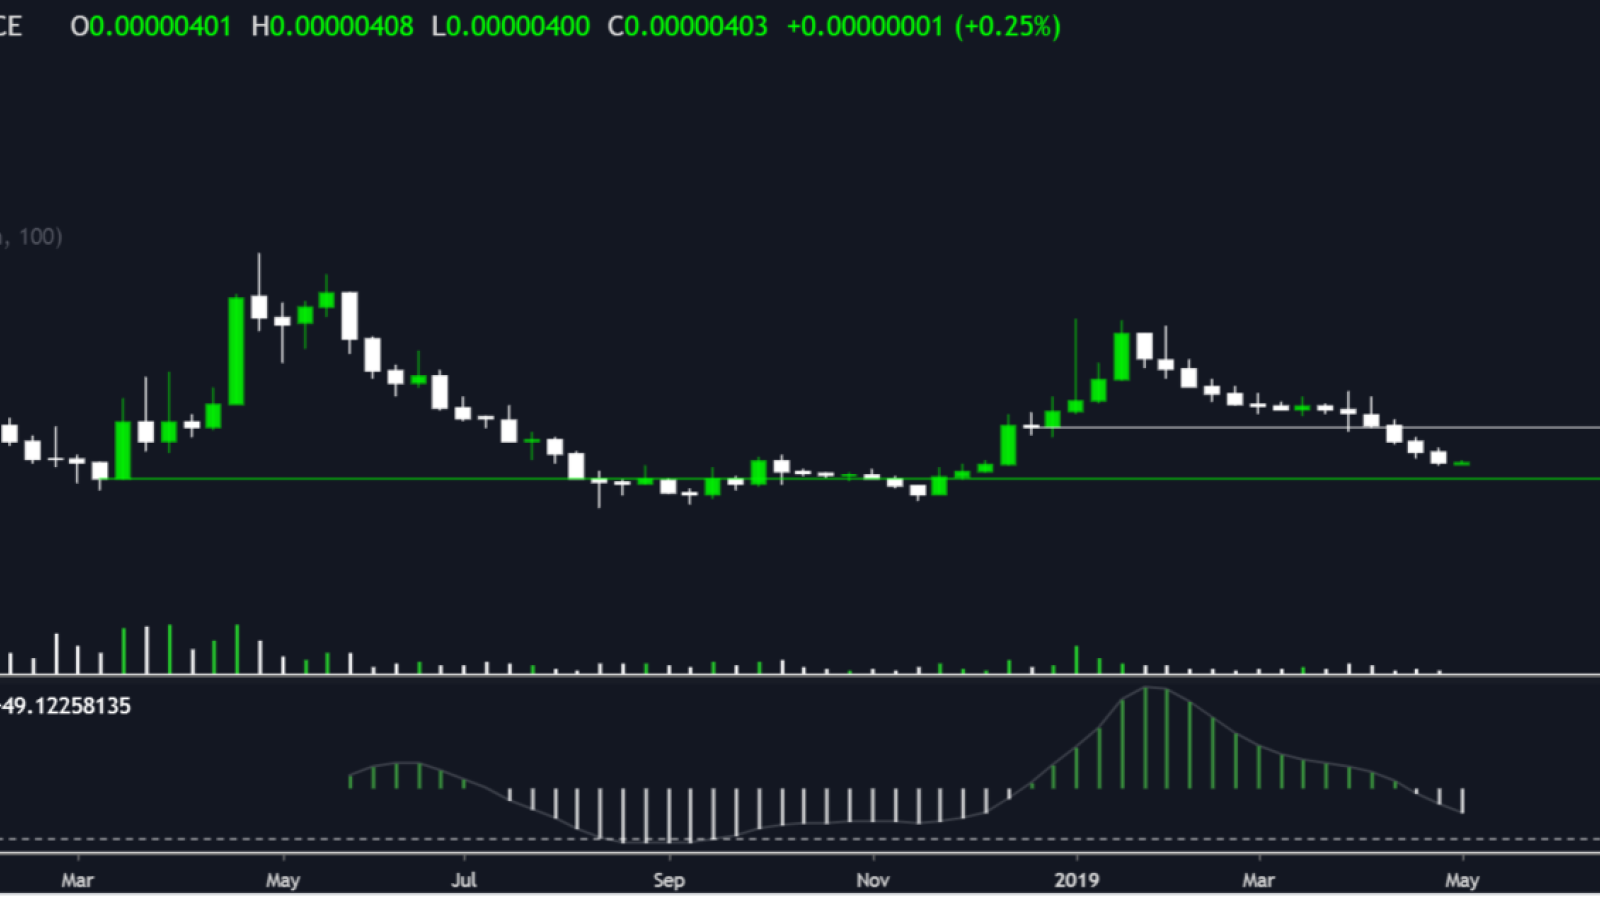
Looking at the TRX/BTC chart, we can see that TRX on the Weekly is approaching the prior accumulation range, in which we might see a bounce. The green area will make a good area of support, with R1 acting as strong resistance in the future (highest volume node).
Final thoughts
In the long term, TRX might be a nice investment idea. It seems to be accumulating power slowly by getting more mature and steadier. Let’s look for the next resistance zones overcome.
Price charts are taken from TradingView