
The past week, the crypto market was mainly in the red zone, following the decline of the leading cryptocurrency below $5,200 on Friday, April 26. The rate of the top altcoins declined as well.
However, in the middle of the week, analysts at the Adamant Capital fund stated that the price had passed the bottom and the accumulation stage began, with the possibility of growth.
Currently, the top 3 coins are trading sideways; only Ethereum has shown a slight drop by 0.15% over the last 24 hours.
The market cap came to the positions of the previous Friday and is now $171 billion.
BTC/USD
After Friday’s decline, Bitcoin still cannot recover and confidently go up. Even the high trading volumes of Bitcoin futures on the Chicago Mercantile Exchange at $280 million could not help BTC’s rate to increase.
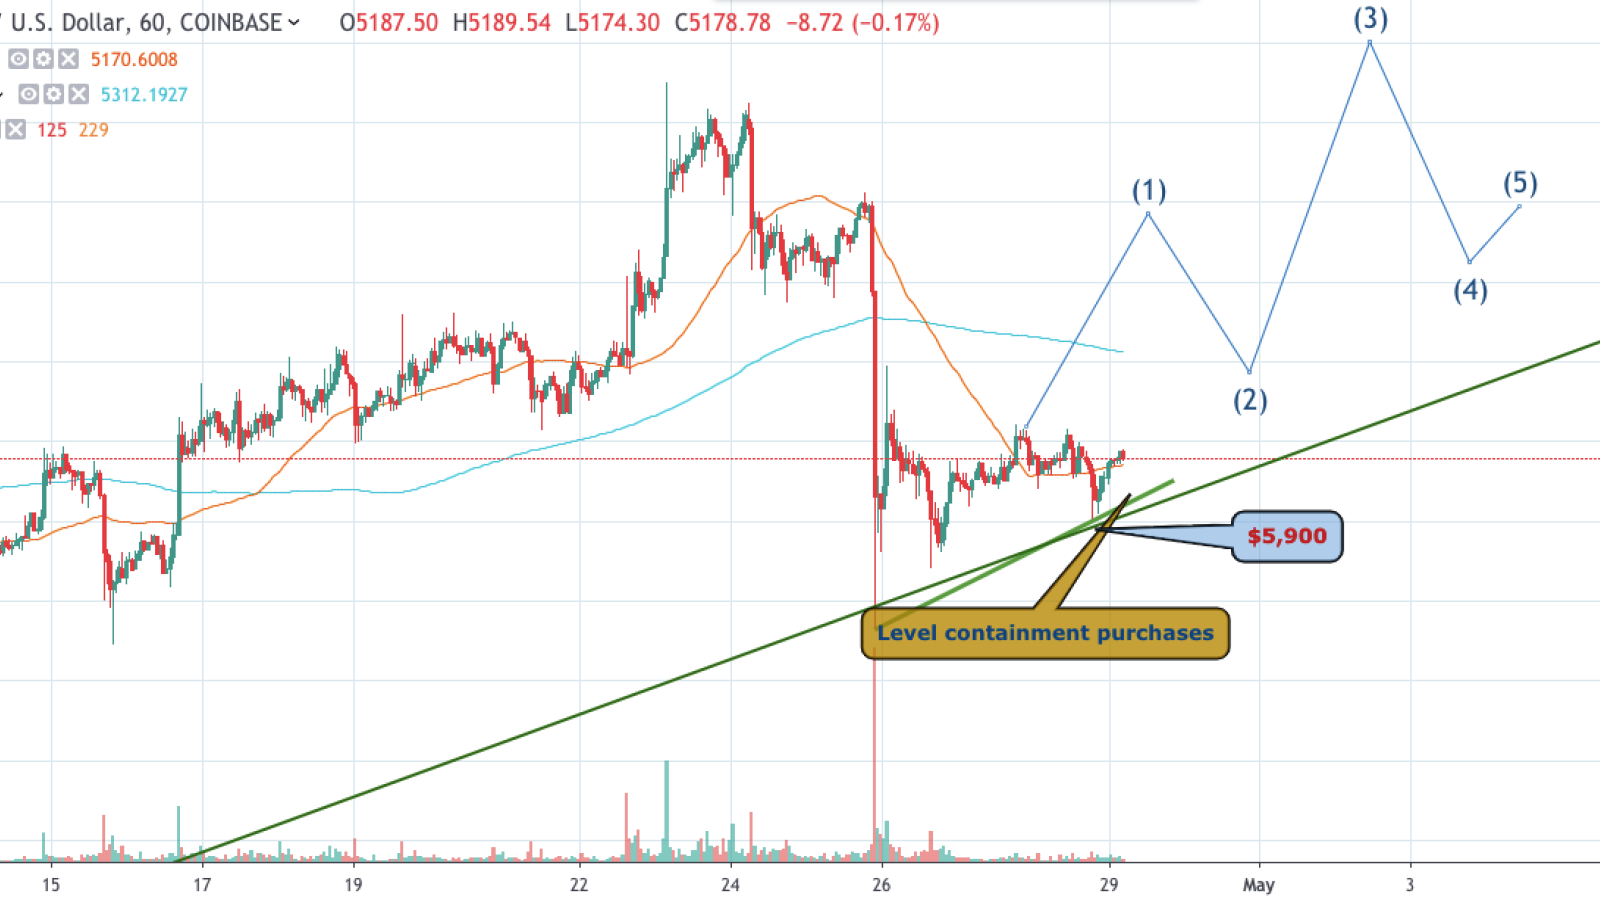
According to the 1-hour chart, Bitcoin dropped to the $5,100 mark; however, the bullish tendencies still dominated as the support at $5,900 was not broken.
The possible long scenario could be closing the points of the Elliot Impulse Wave pattern, and in the end the level at $5,400 is supposed to be achieved.
The price of BTC is trading at $5,306 at the time of writing.
ETH/USD
The second most popular crypto in terms of market cap is trying to move together with Bitcoin; however, currently, it is losing a few points against the background of the recent fall.
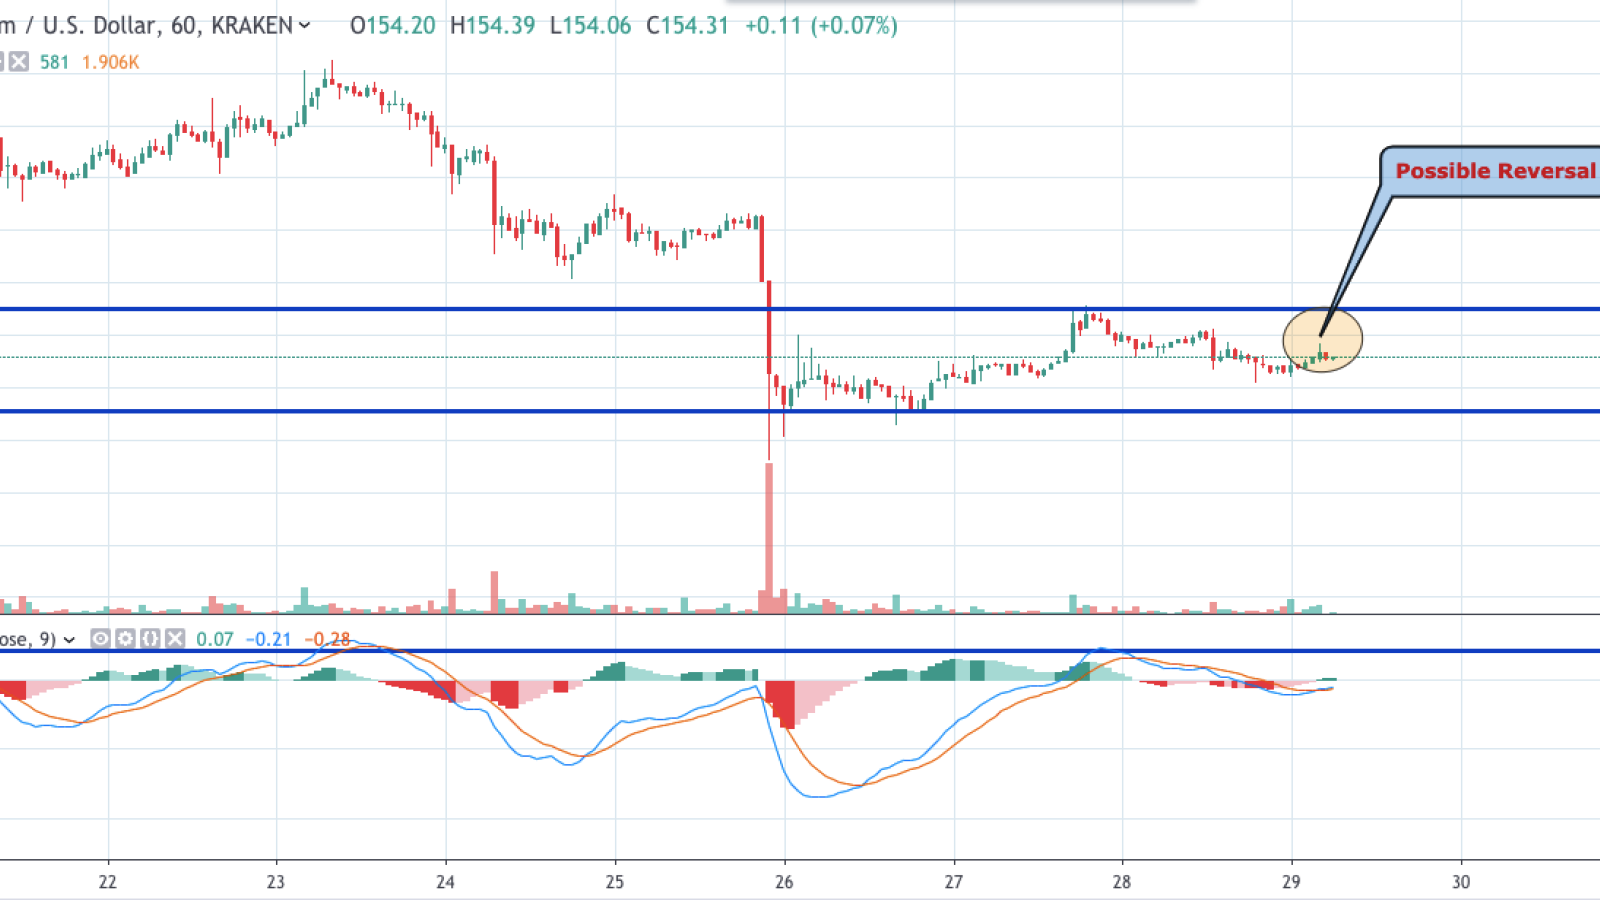
On the hourly graph, the quotes of Ethereum are trading between the support zone at $150 and the resistance one at $158.
The MACD indicator shows a reversal, and if that happens, ETH will reach $160 again. Trading volumes also are quite high, which is a sign of a price increase.
The price of ETH is trading at $157.93 at the time of writing.
XRP/USD
Among the top 3 coins, Ripple is showing the best dynamics, having increased by 0.51% over the last day. The possible reason for this is the recent news from Binance, whose research division concluded that XRP is “the best diversifier among digital assets”.
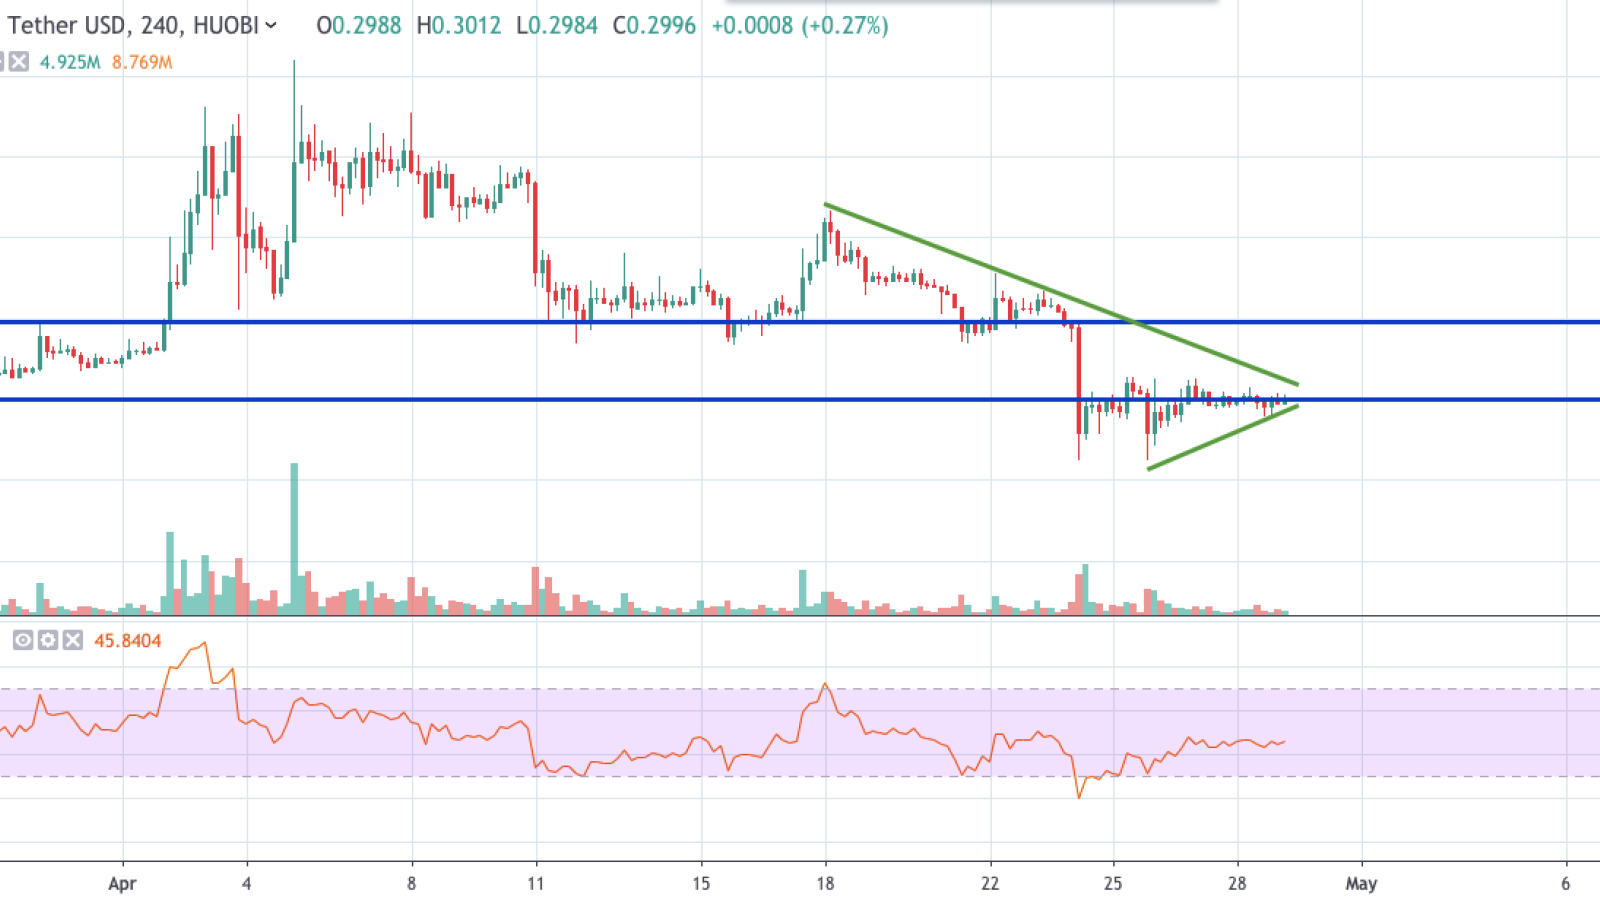
From the 4-hour chart, the Triangle pattern has been formed, and the $0.30 mark is an important one in terms of the short-term analysis. The RSI indicator is in the oversold area, which confirms the possible entry of buyers.
As a whole, once the $0.30 resistance is broken, the quotes will move to another level at $0.32.
The price of XRP is trading at $0.2986 at the time of writing.