

Disclaimer: The opinions expressed by our writers are their own and do not represent the views of U.Today. The financial and market information provided on U.Today is intended for informational purposes only. U.Today is not liable for any financial losses incurred while trading cryptocurrencies. Conduct your own research by contacting financial experts before making any investment decisions. We believe that all content is accurate as of the date of publication, but certain offers mentioned may no longer be available.
The cryptocurrency market has not got out of the short-term bearish mood. Almost all the top 10 coins are located in the red zone, except for Binance Coin whose rate has increased by 1.62% over the last day. While the biggest loser is Bitcoin Cash, its price has reduced by 1.66%. The dominance index of BTC keeps slightly going down and now constitutes 66.13%.
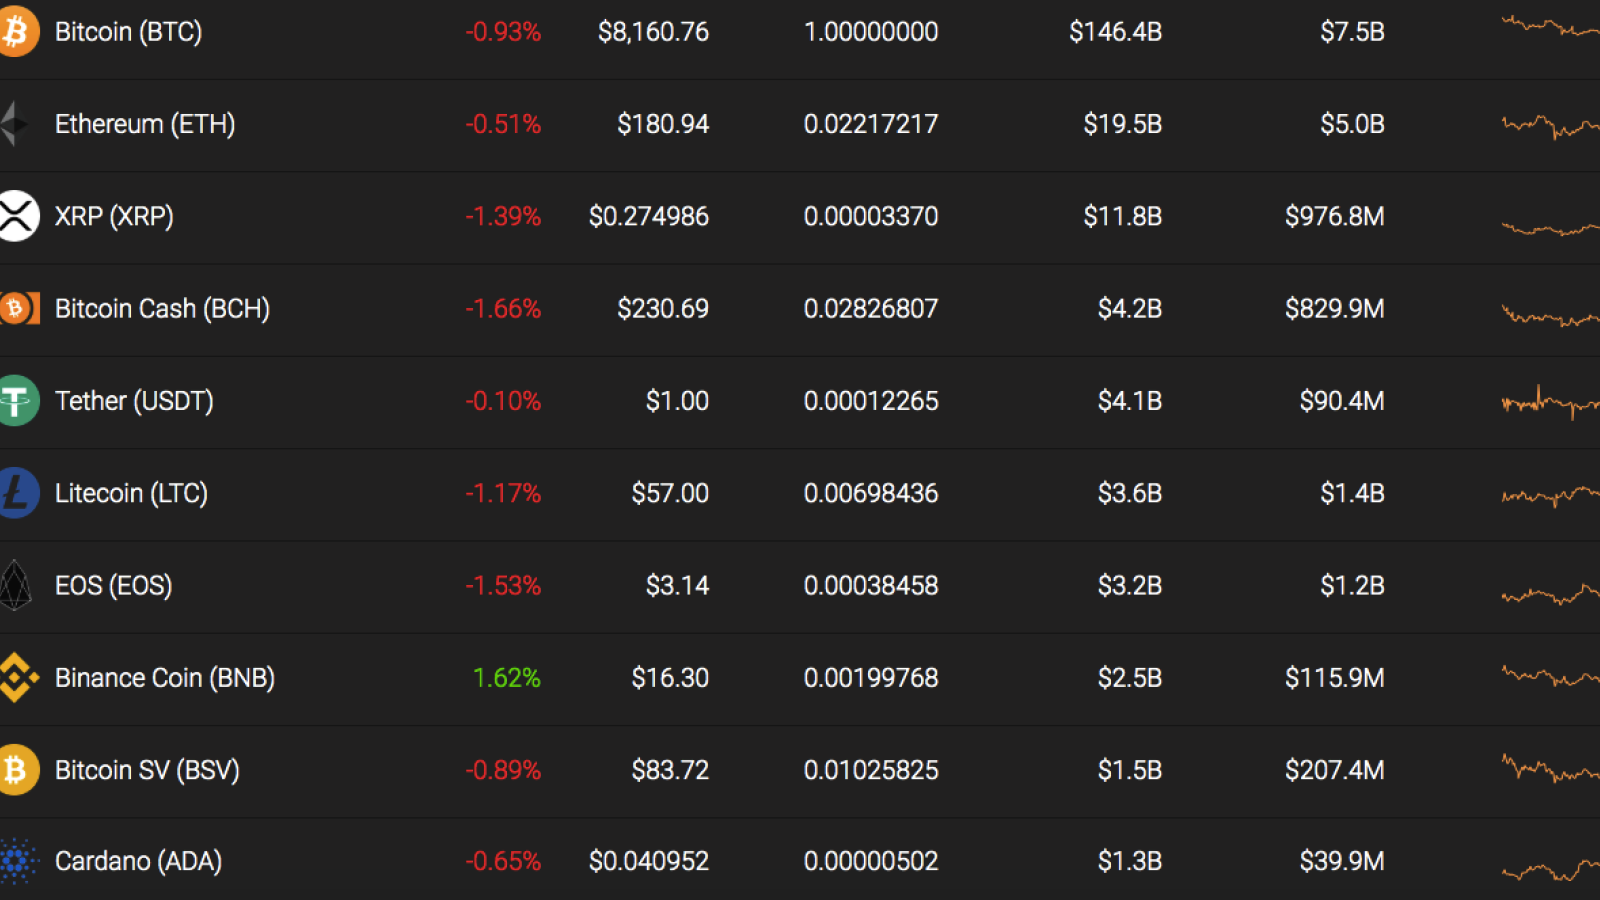
Here are the main indicators of Bitcoin, Ethereum, and XRP.
|
Name |
Ticker |
Market Cap |
Price |
Volume (24h) |
Change (24h) |
|
Bitcoin |
BTC |
$147 914 130 642 |
$8 225,67 |
$14 776 138 193 |
-0,93% |
|
Ethereum |
ETH |
$19 675 705 544 |
$182,06 |
$6 985 514 311 |
-0,51% |
|
XRP |
XRP |
$11 949 043 761 |
$0,276811 |
$1 343 117 373 |
-1,39% |
BTC/USD
Our earlier price prediction came true earlier than predicted as Bitcoin bounced off and fixed above $8,000. The bullish movement directed BTC above the resistance of the downtrend at the level of $8,000. This move opened up scope for actions above the 50 moving average.
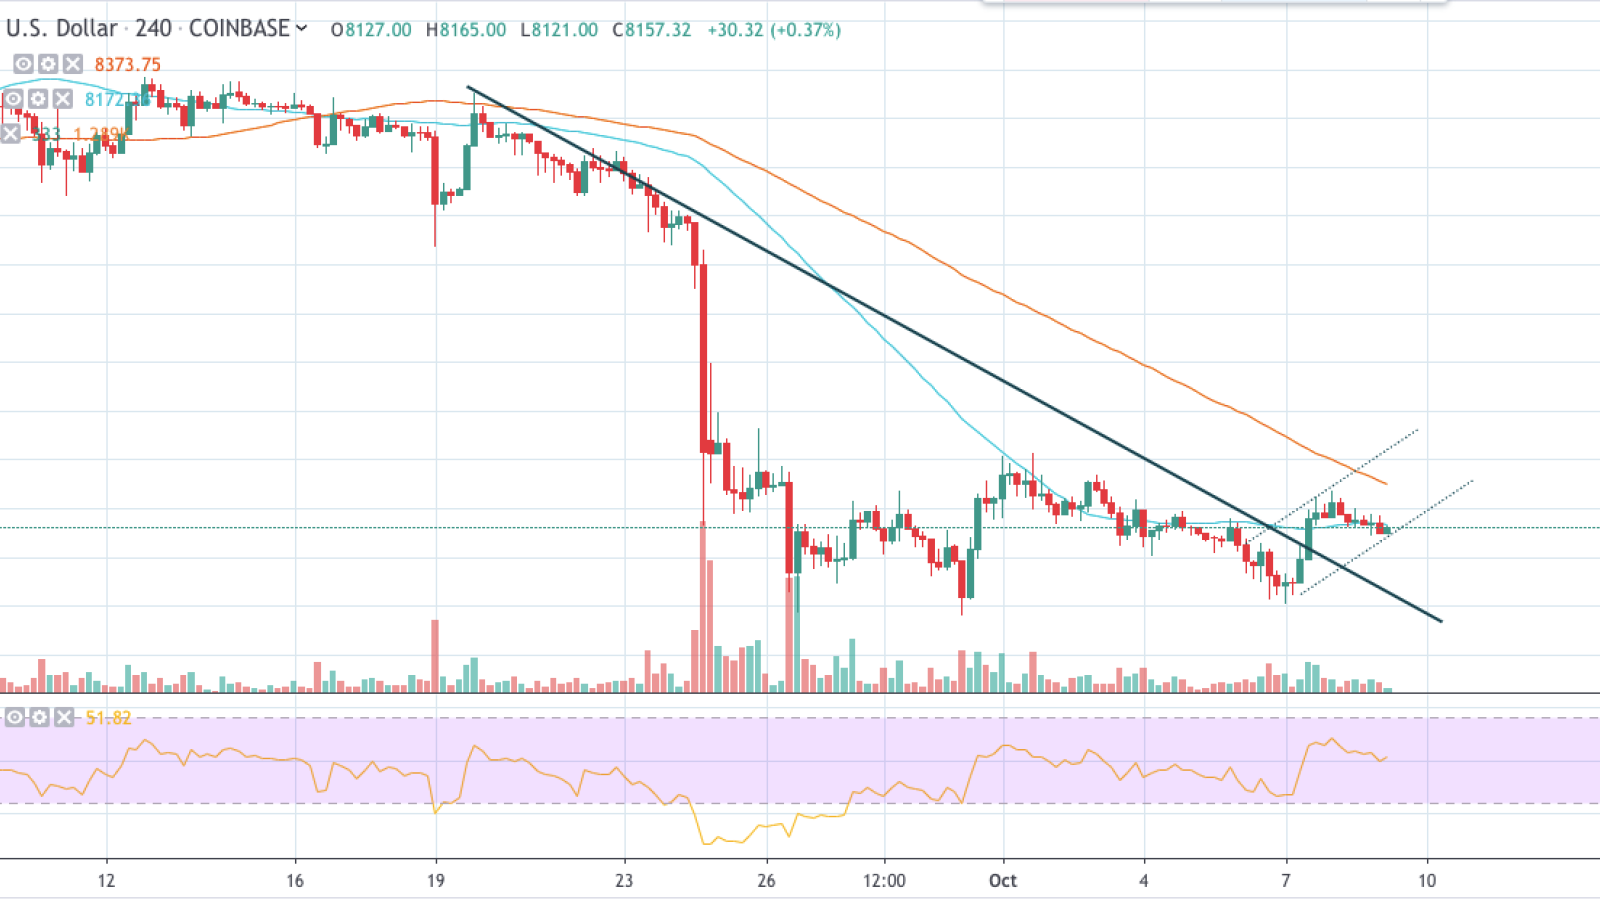
On the 4H chart, the growth was interrupted because Bitcoin changed the trend and left the level of $8,400 unprotected. Besides, the rise restriction was on the part of 100 MA just above $8,400.
The narrowing of the gap between 50 MA and 100 MA suggests that the bulls have an advantage, despite the correction. The relative strength index (RSI) indicates the likelihood of sideways trading taking precedence.
In this case, the rate is likely to fluctuate between $8,000-$8,200 in the upcoming days.
Bitcoin is trading at $8,159 at press time.
ETH/USD
Ethereum continued its rise and a local maximum was fixed in the resistance area of $186. The RSI indicator is not in the oversold area, confirming the potential for growth. If the bulls break the resistance level of $186, then the price will test 78.6% Fibo ($192.55).
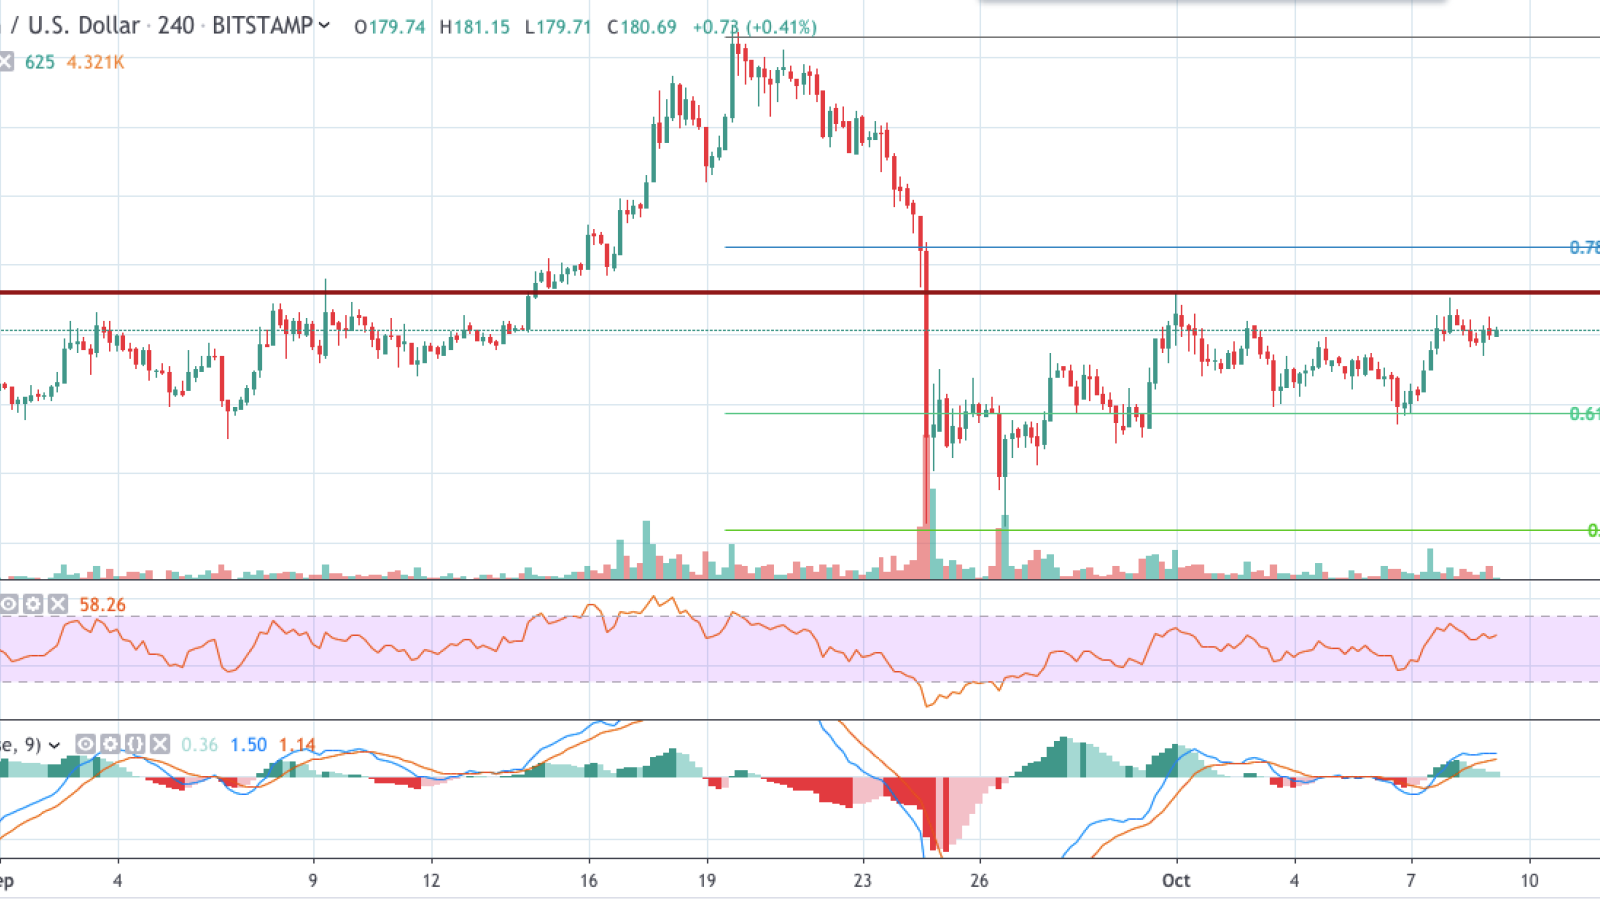
There is a high probability of a reversal to a decline from these levels. It is assumed that support that can limit such a decline is the level of 50% Fibo ($151.87).
Ethereum is trading at $180.69 at press time.
XRP/USD
If a few days ago XRP was one of the top gainers, today, its rate has decreased by more than 1% which is the biggest drop compared to Bitcoin, and Ethereum.
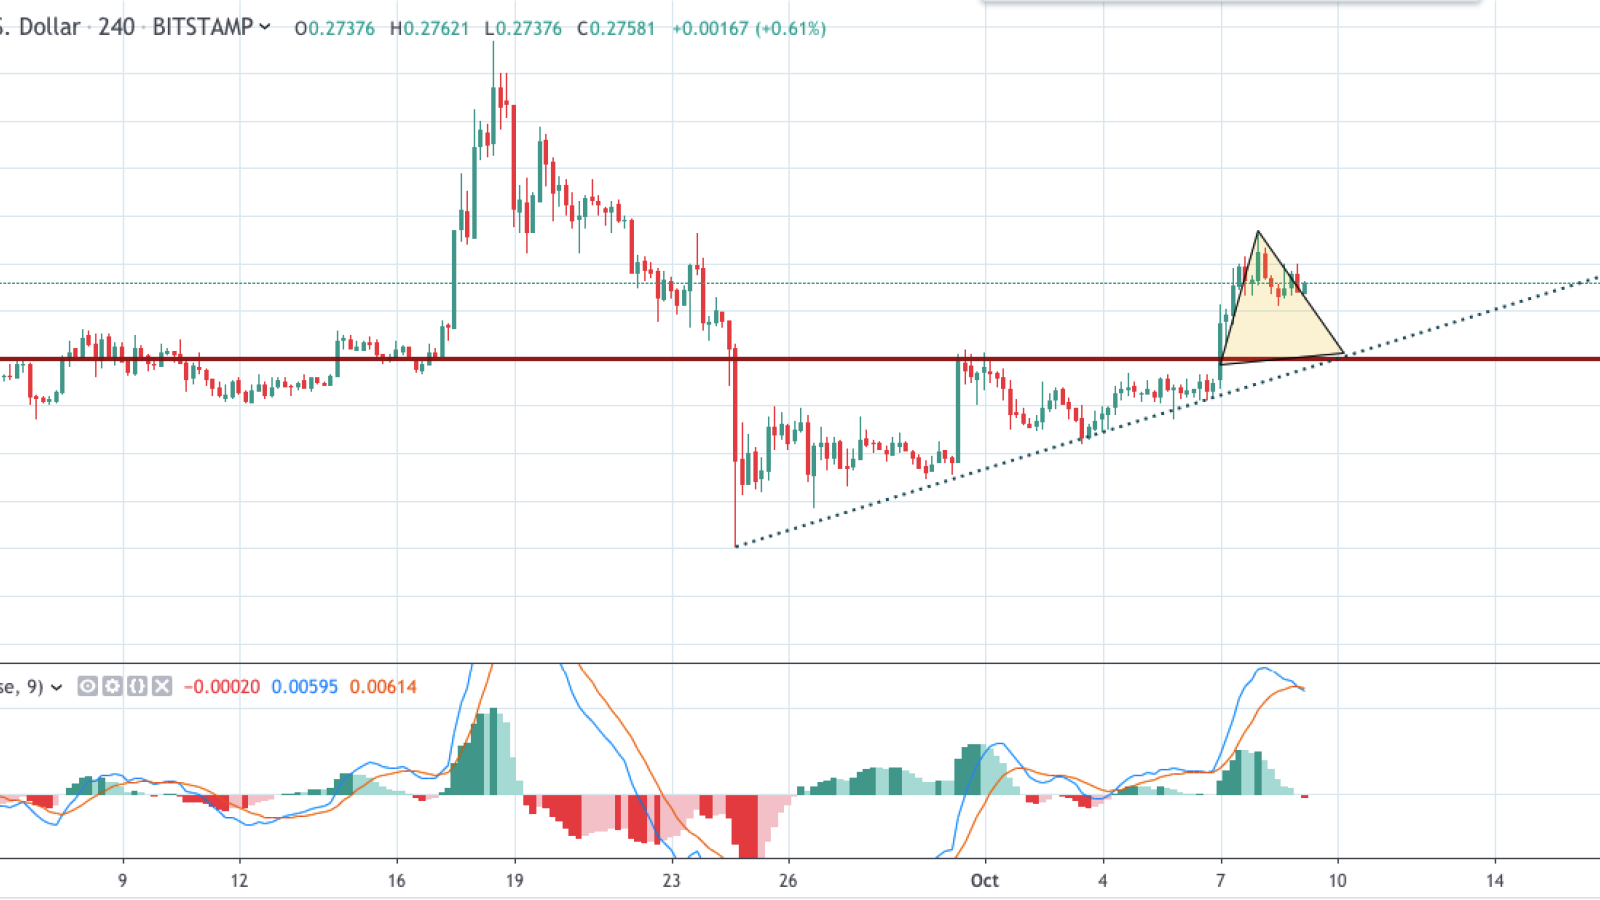
According to the chart, XRP is forming a Triangle pattern with support at $0.26. The trend line from September 24 also confirms the upcoming correction of the third most popular crypto.
Moreover, the blue line of the MACD indicator has crossed the red one, which might be the start of a short-term bearish mood.
XRP is trading at $0.2758 at press time.