
Disclaimer: The opinions expressed by our writers are their own and do not represent the views of U.Today. The financial and market information provided on U.Today is intended for informational purposes only. U.Today is not liable for any financial losses incurred while trading cryptocurrencies. Conduct your own research by contacting financial experts before making any investment decisions. We believe that all content is accurate as of the date of publication, but certain offers mentioned may no longer be available.
Cryptocurrencies are continuing to consolidate: the leading asset is squeezed in a 'Triangle' pattern, and only a breakout through $10,565 would indicate a continued rise to $13,865. Cardano (ADA) remains the only gainer today. However, growth has slowed since the start of the day. It has amounted to 0.24% over the past 24 hours.
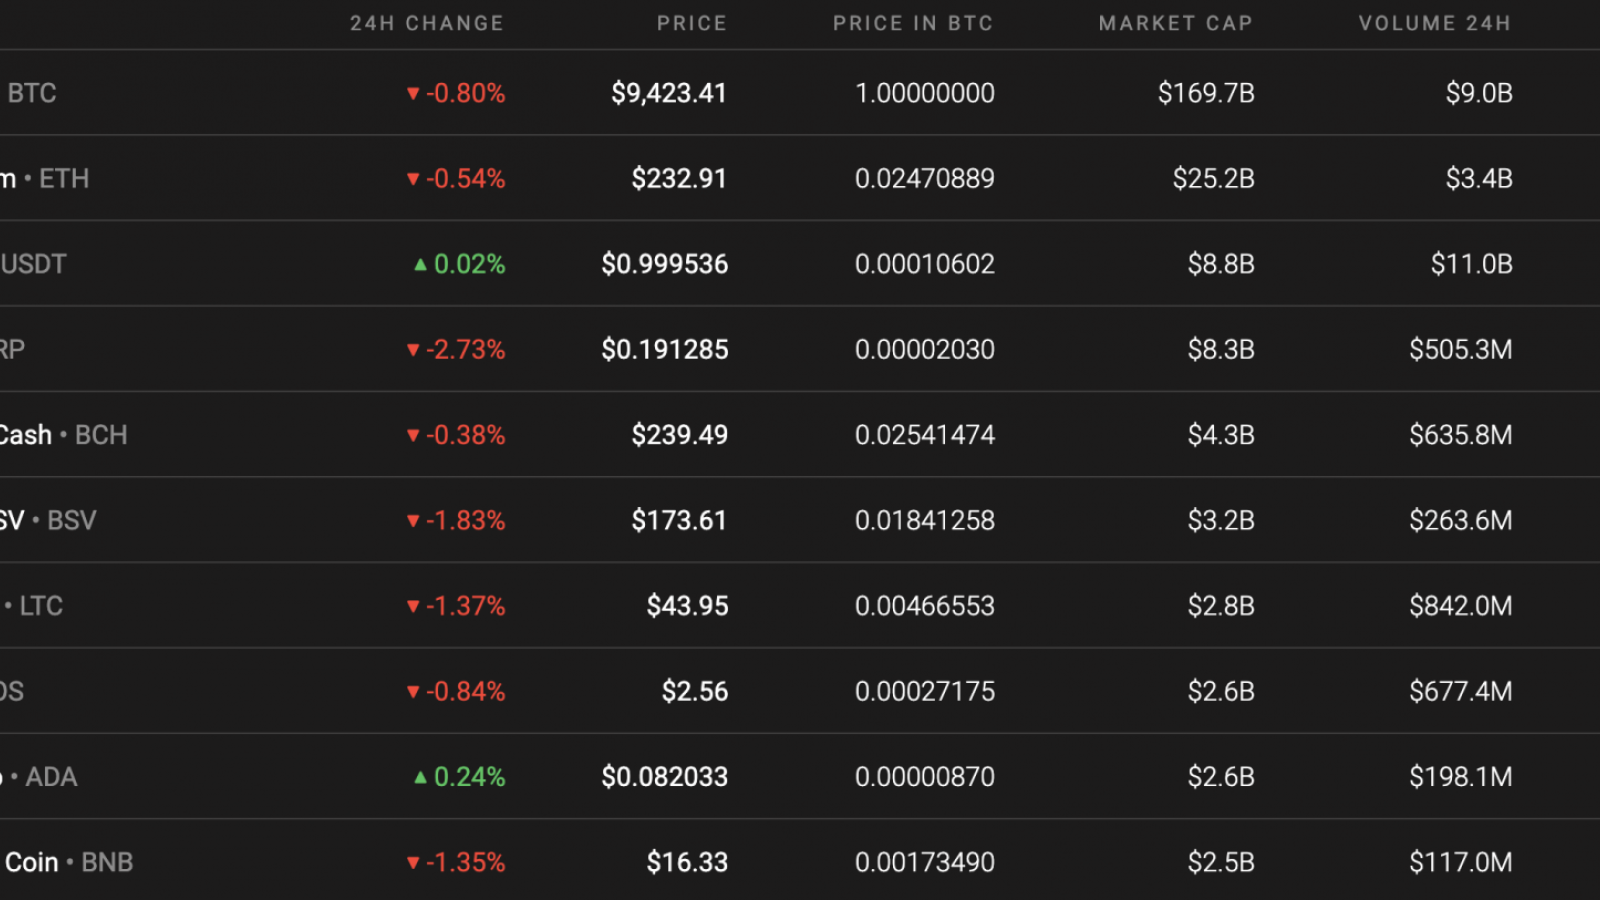
The key data for Bitcoin (BTC), Ethereum (ETH), and XRP is below.
|
Name |
Ticker |
Market Cap |
Price |
Volume (24h) |
Change (24h) |
|
Bitcoin |
BTC |
$173,571,933,428 |
$9,429.14 |
$19,316,004,221 |
-1.01% |
|
Ethereum |
ETH |
$25,975,421,467 |
$233.17 |
$7,369,548,080 |
-0.71% |
|
XRP |
XRP |
$8,486,449,116 |
$0.191750 |
$1,175,902,388 |
-3.22% |
BTC/USD
Bears continue to hold resistance at around $10,000. Now the Triangle pattern is being formed on the daily chart of the asset. The main trading idea still involves a breakdown of the lower border with a continued decline to $6,320 as part of the model refinement. An additional signal in favor of this option would be a rebound from the downtrend on the RSI indicator.
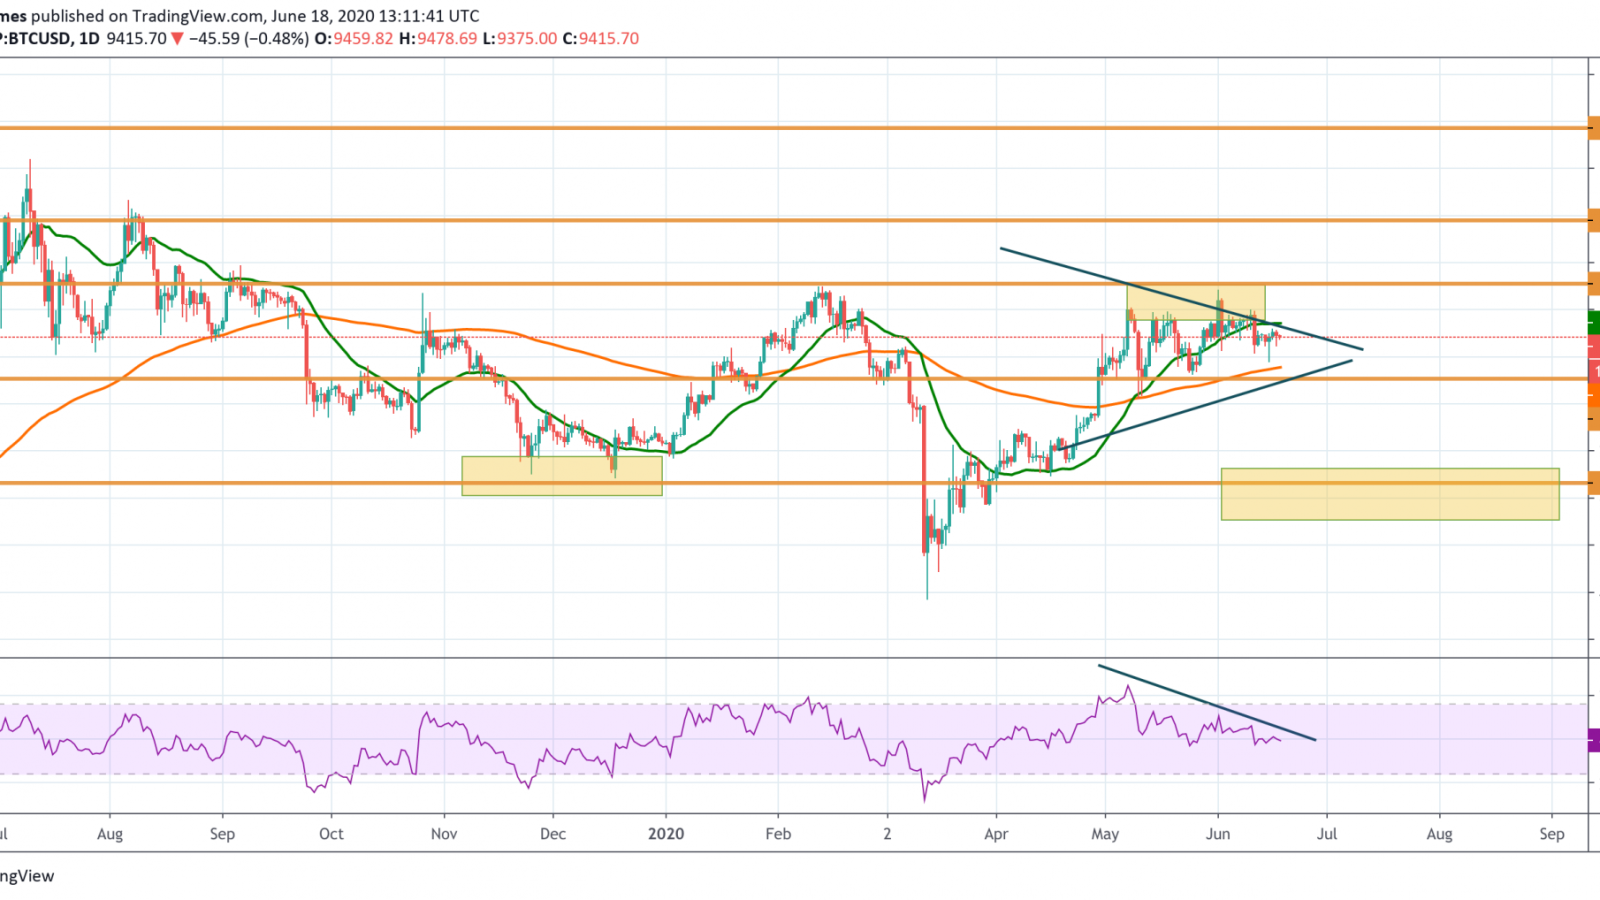
A breakdown of the support level and the price holding below $8,555 would also suggest a drop. If the coin breaks out of the upper boundary of the Triangle model, there could be continued growth to the first target at $11,900.
Bitcoin is trading at $9,391 at press time.
ETH/USD
Yesterday, Ethereum (ETH) was at $230, setting a daily minimum at $227.56. By the end of the day, the pair recovered to the support at $233.33. During the Asian session, trading volumes were below average and the pair was unable to continue to grow towards the POC line ($243.36). If buyers increase volumes today, the recovery might continue.
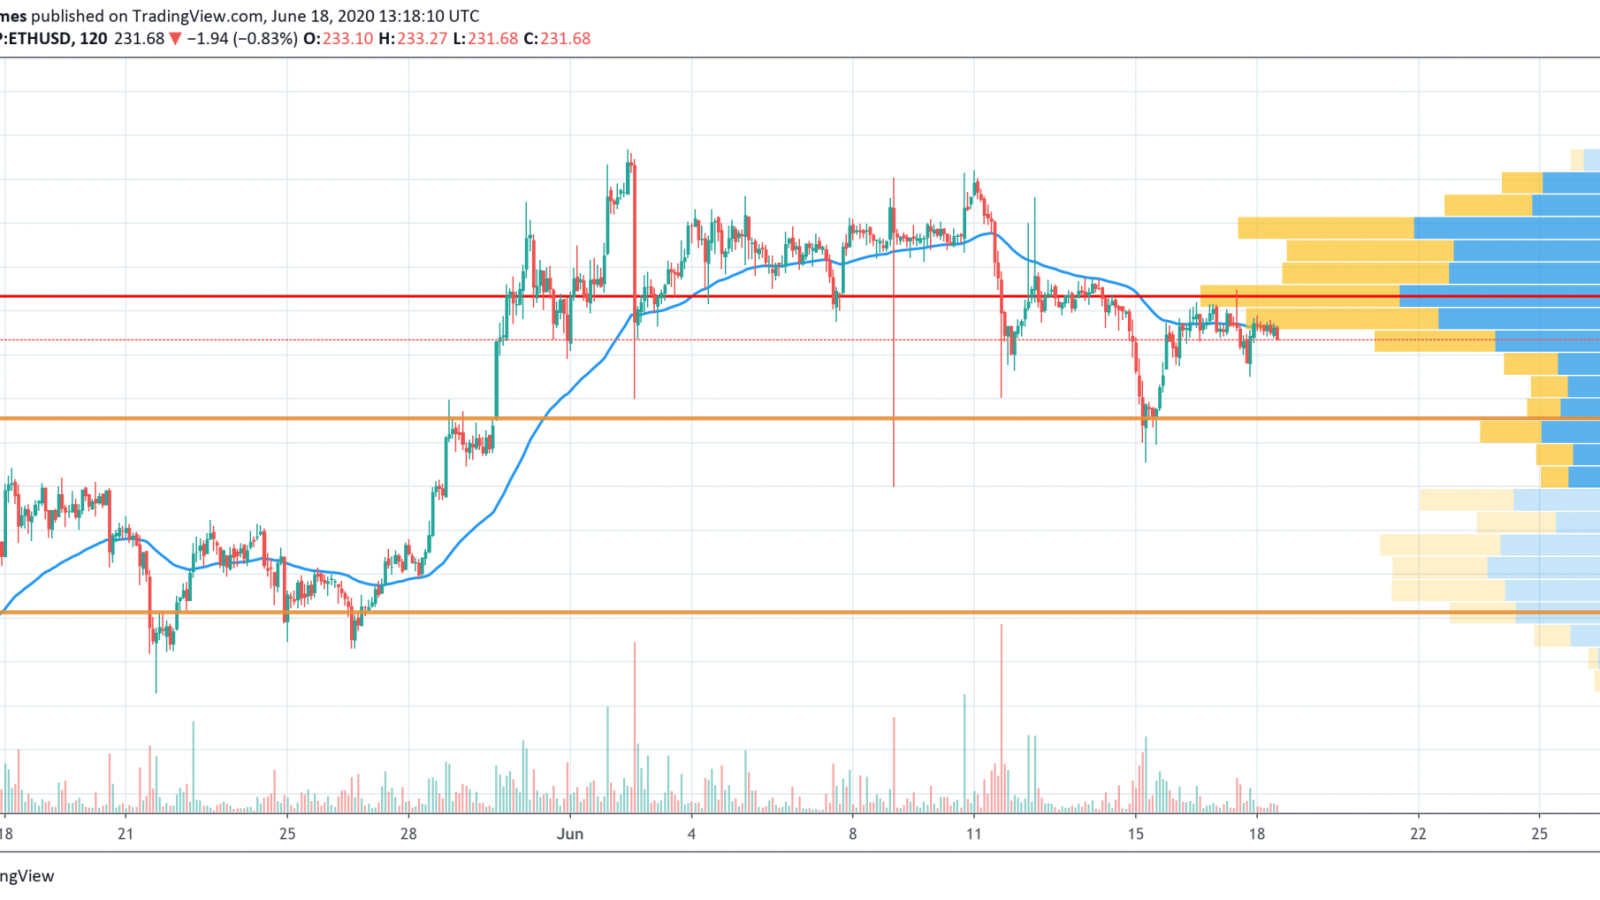
However, if sellers become more active in the area of average prices, then they could push the price to the $225 area. Even a re-test of the $222.98 level will likely not cancel the bullish scenario.
Ethereum is trading at $231.97 at press time.
XRP/USD
XRP is the biggest loser on our list. The coin has lost 2.68% of its value over the past day. Yesterday, buyers tried to test the psychological mark of $0.20, but sellers reacted with a rather strong bearish impulse, which pierced the support at $0.19. However, this area stopped the rollback and the pair returned to the area of average prices.
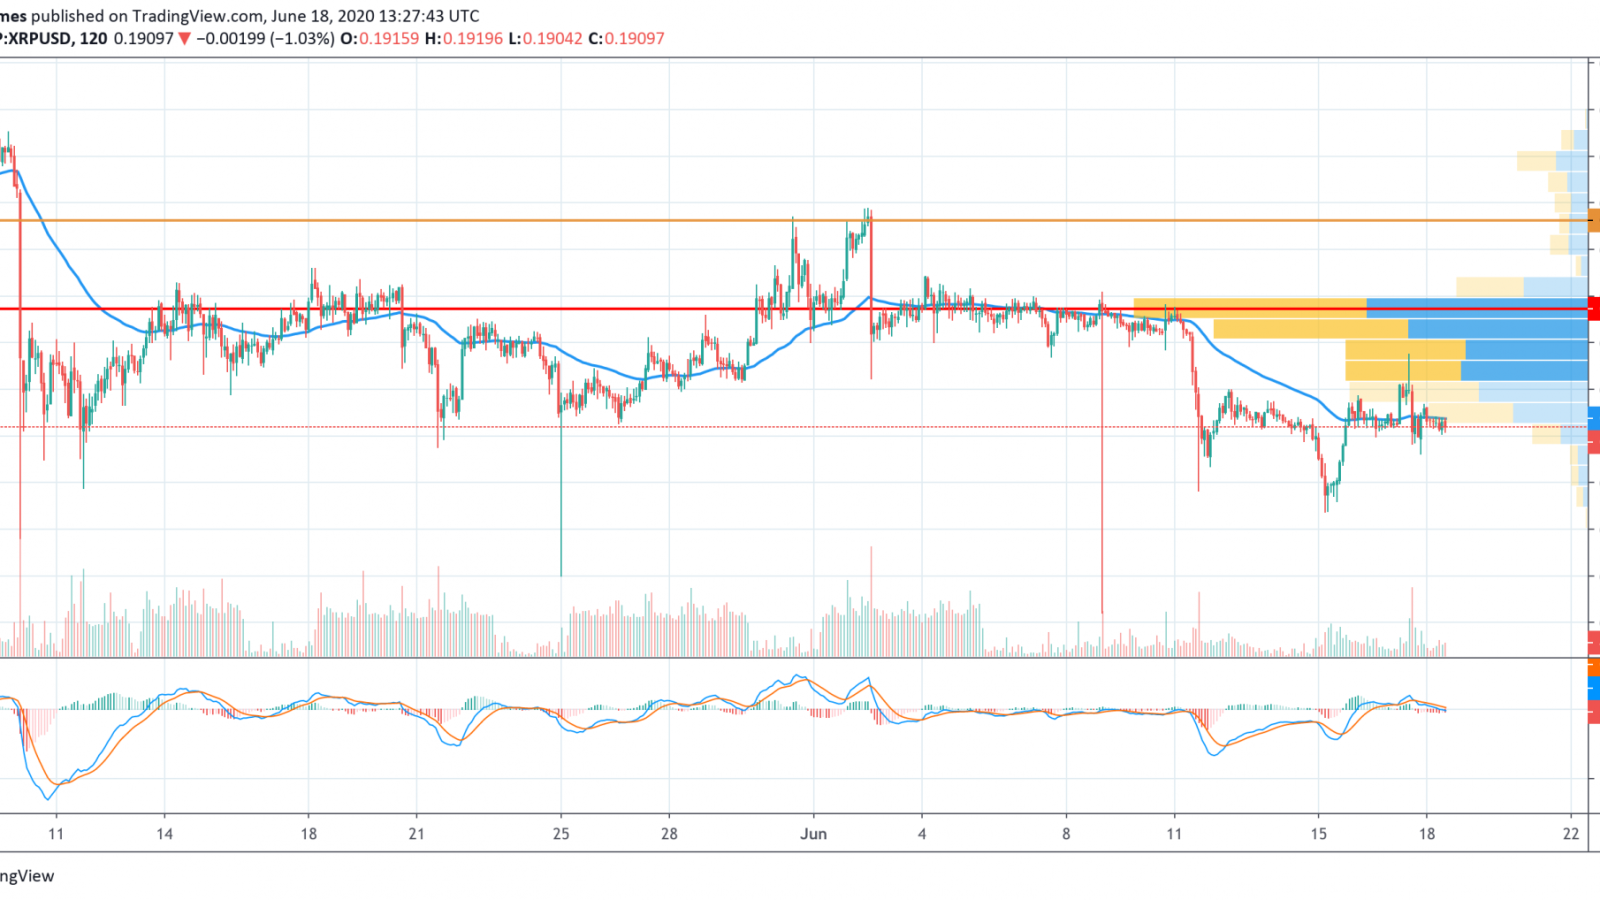
If buyers gain a foothold above the two-hour EMA55, they will be able to break through the psychological level of $0.20. If bears dominate the market today, then the price will fall into the zone of yesterday's low.
XRP is trading at $0.1908 at press time.