Disclaimer: The opinions expressed by our writers are their own and do not represent the views of U.Today. The financial and market information provided on U.Today is intended for informational purposes only. U.Today is not liable for any financial losses incurred while trading cryptocurrencies. Conduct your own research by contacting financial experts before making any investment decisions. We believe that all content is accurate as of the date of publication, but certain offers mentioned may no longer be available.
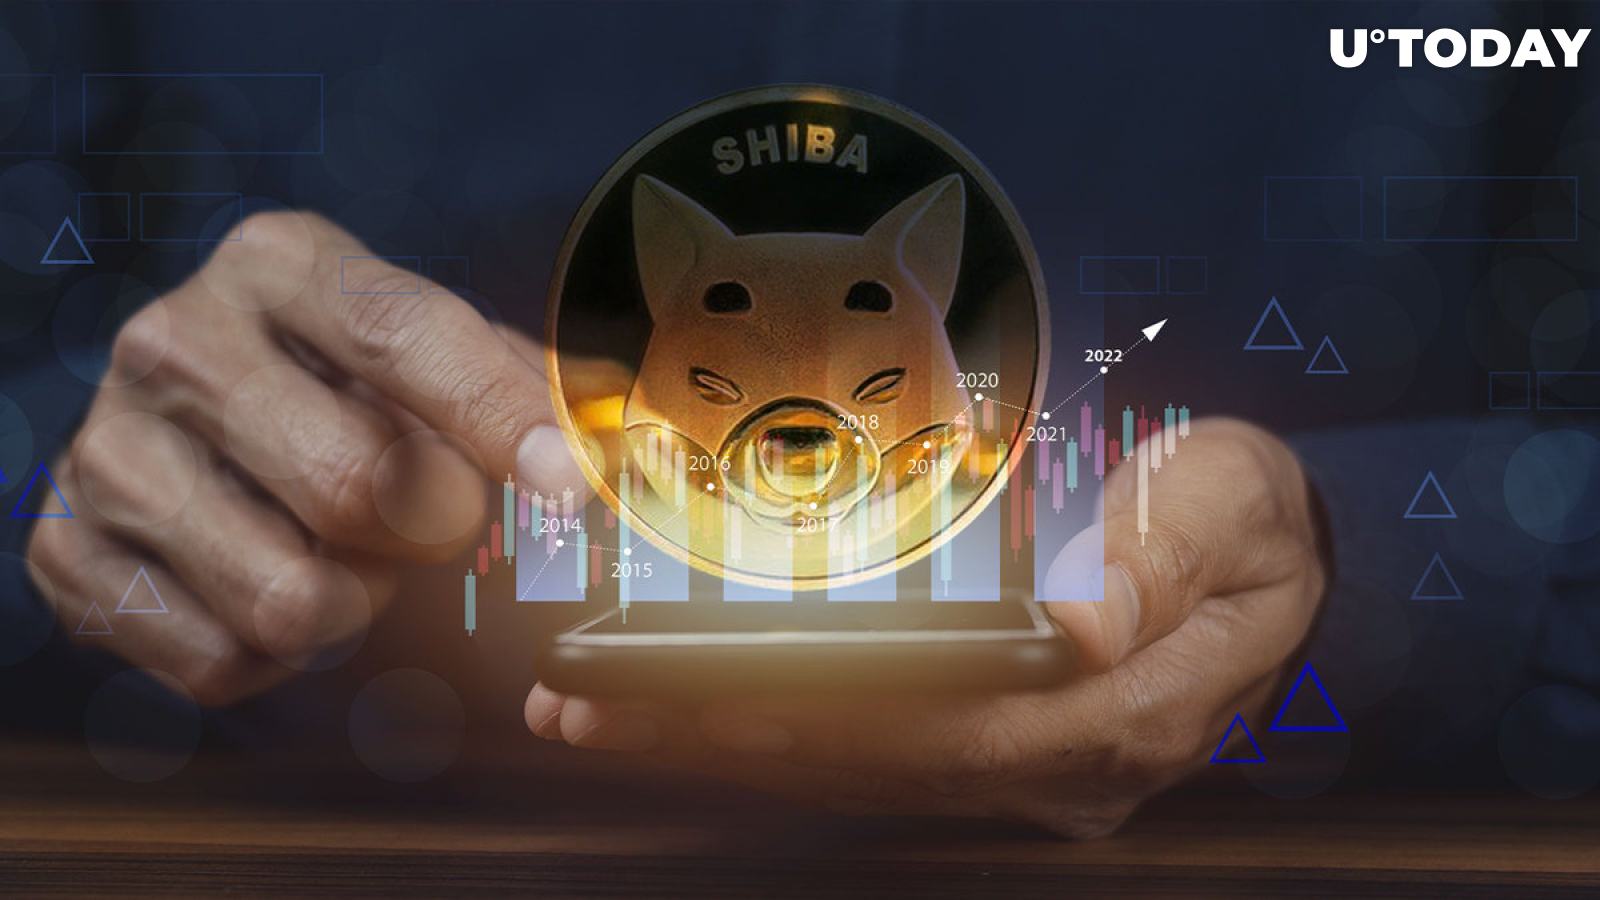
At the time of publication, Shiba Inu was trading just a hair below $0.000012, a level that had proven pivotal for SHIB's price action in recent months. SHIB was changing hands at $0.00001197, down 5.49% in the last 24 hours.
Shiba Inu appears to be trading in a symmetrical triangle pattern, according to its daily chart. While the price is looking set for incoming price movement within the triangle formation, the momentum indicators, especially the RSI, have flattened slightly above the 50 mark, suggesting the possibility of range trading, representing indecision.
Analysts interpret symmetrical triangles as market continuation patterns that signify periods of indecision. The triangular point appears to be where the highs and lows meet, with hardly any notable volume. Simply put, investors are unsure of where to stand.
In contrast to the unsure days and/or weeks preceding the breakout, when investors do decide which direction to take, it moves north or south with high volume. Typically, the breakout happens in the direction of the existing trend.
Then, appearance of bull flag
A closer look at the Shiba Inu (SHIB) four-hour chart might suggest the appearance of a bull flag. A bull flag chart resembles a parallelogram-shaped flag and indicates a trend consolidation ahead of a major breakout. It happens when prices oscillate within a small range after sharp increases.
$SHIB is forming a flag. Market conditions will decide breakout pic.twitter.com/fddT7QakeU
— $SHIB KNIGHT (@army_shiba) November 6, 2022
Shiba Inu surged to highs of $0.00001519 on Oct. 29 before a retreat. The price has stayed in a consolidation between $0.00001150 and $0.0000139 since then.
However, given the current bearish market conditions, technical indicators and chart patterns might be put to the test.