
One of the oldest cryptocurrencies in circulation, Litecoin was initially launched in October 2011 as a codebase fork of Bitcoin. What this means is the two coins don’t share transaction history or the genesis block but have similar characteristics and are based on the same original coding.
Litecoin transactions, however, are faster and carry lower fees which stems from the fact that block time is shorter than Bitcoin’s at around 2.5 minutes. Currently occupying the 6th spot in market rankings by volume, Litecoin has an entire supply valued at just over $2 billion and is trading at 34 US Dollars according to aggregate data from CoinMarketCap.
Technical Outlook – The Week Ahead
From a long-term perspective, Litecoin is in a clear and strong downtrend. In the near-term, over the last 7 days, it has gained more than 11% against the US Dollar and extending a minor uptrend. It is currently supported by a bullish trend line and seems headed towards the recent peak around $40 which will act as horizontal resistance.
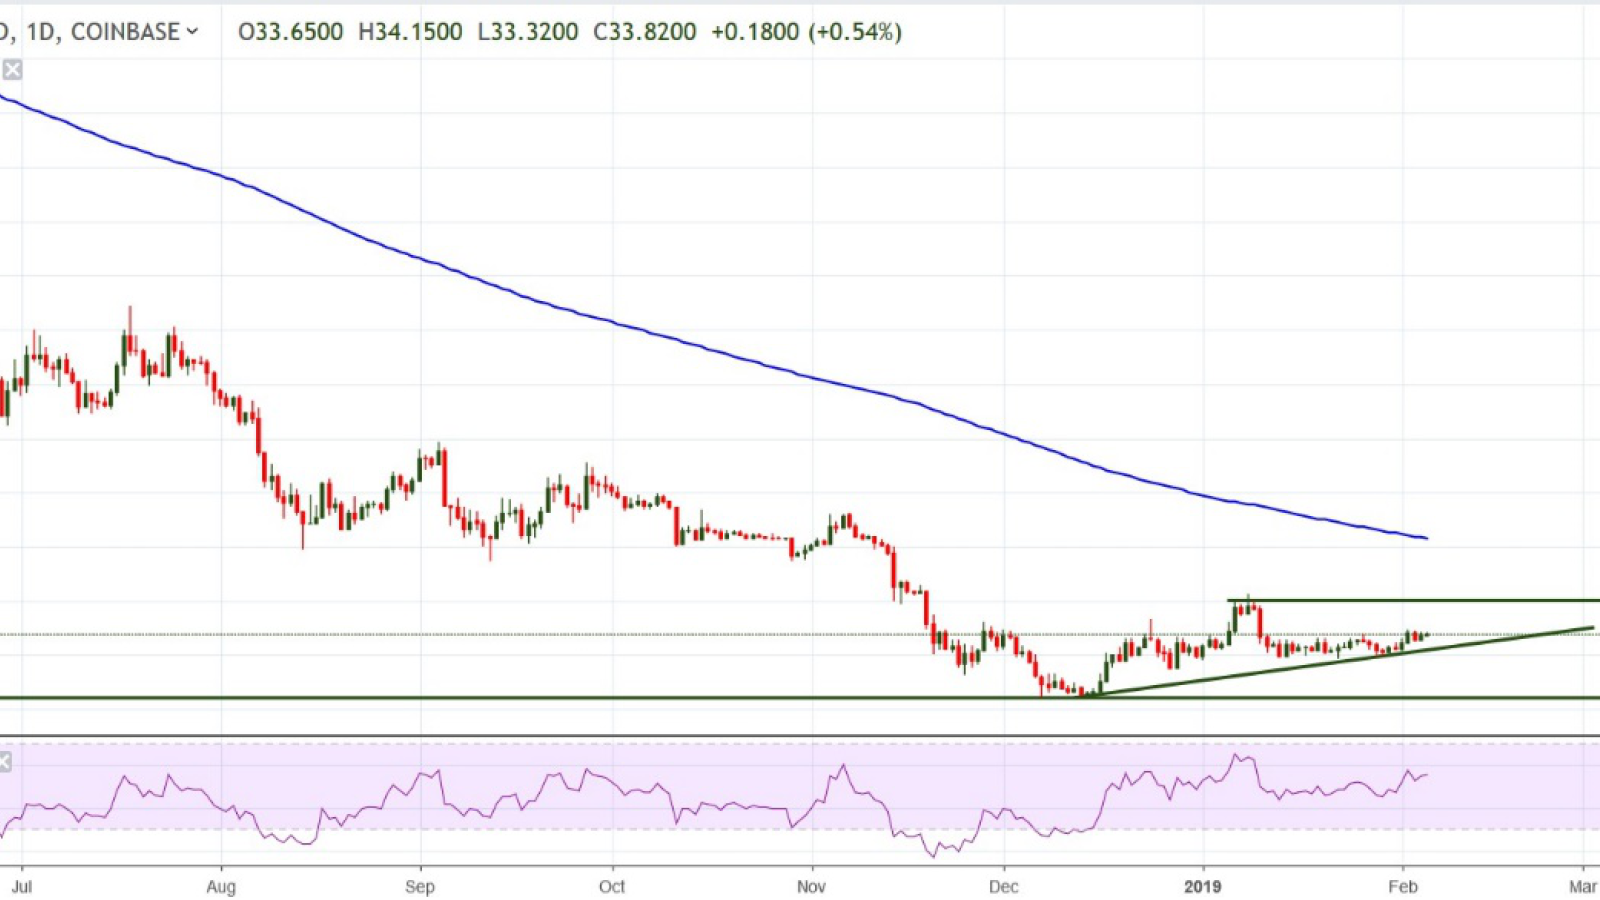
If the $40 barrier is broken Litecoin’s biggest test to the upside will be the 200-day Exponential Moving Average (blue line on the Daily chart above), a break of this key element will bring in additional buyers. However, we don’t expect $40 to be broken this week and the 200 EMA is a much more distant target so a touch of it would be a big surprise.
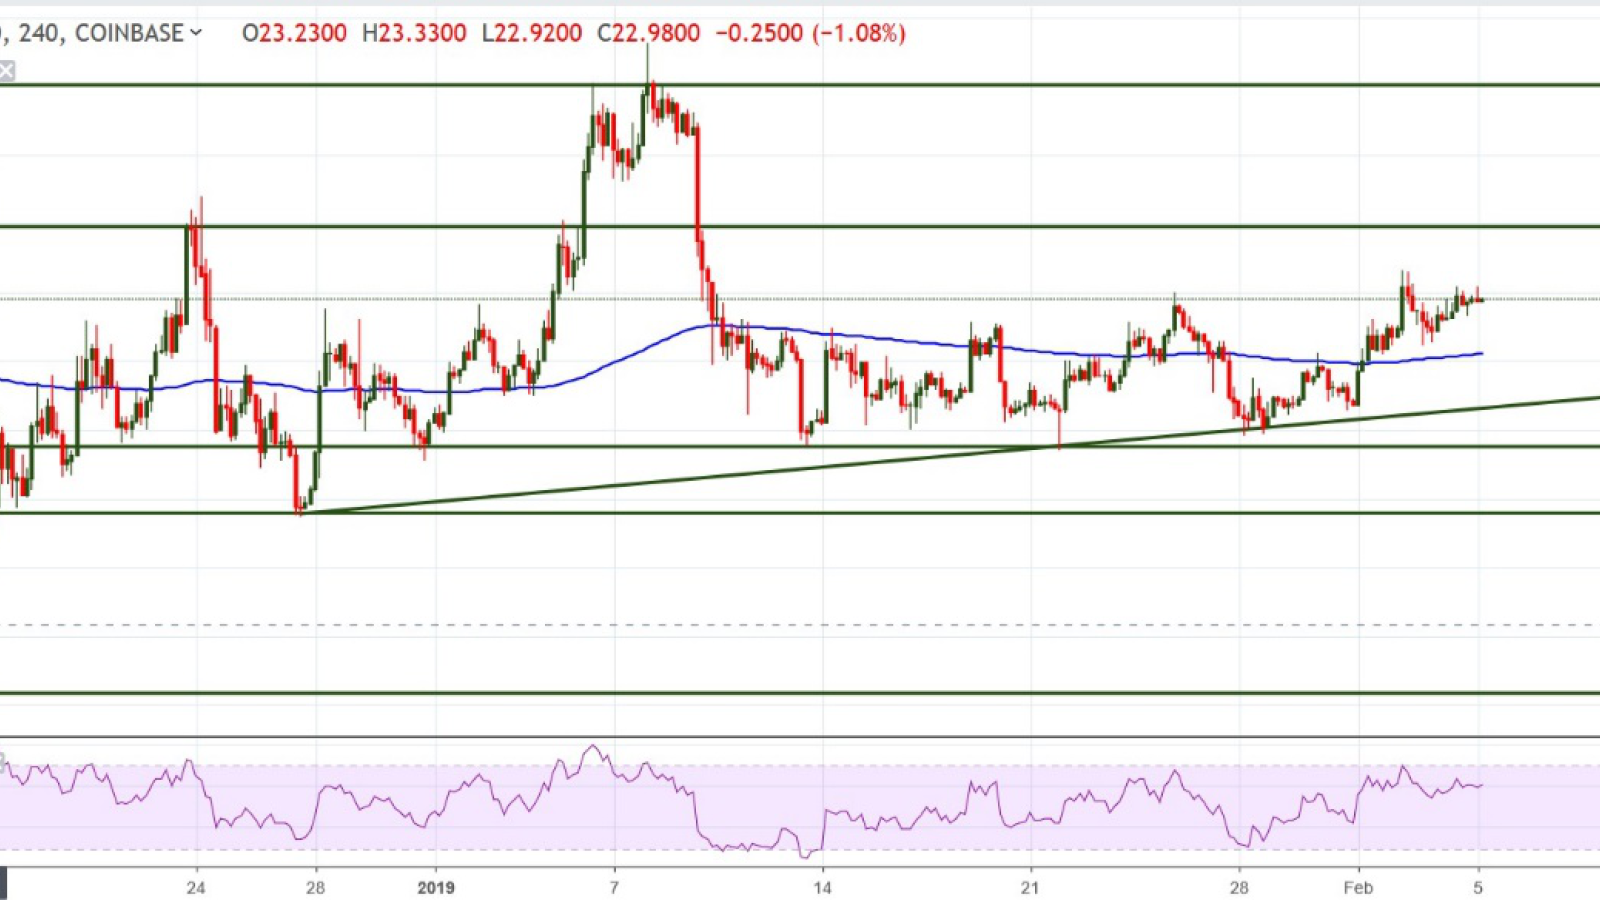
From a shorter-term perspective (4-hour chart above), we have minor resistance at $36 which may be touched in the next few days, possibly Wednesday or Thursday. Taking a look at the 200-period Exponential Moving Average on a 4-hour chart we can clearly see that it lacks directional bias. That alone suggests the 4-hour chart is in range mode, albeit with a bullish bias. If the pair reverses to the downside, the 200 periods EMA will act as support, followed by the bullish trend line visible on the chart and by the horizontal support around $29.
4-Hour Chart Support: bullish trend line and $29 - $30 (the exact price differs depending on exchange)
Daily Chart Support: bullish trend line and $22 (latter level not expected to be touched this week even if trend line is broken)
4-Hour Chart Resistance: $36, $40
Daily Chart Resistance: $40, 200 days Exponential Moving Average
Most likely scenario: The pair is mostly ranging, with choppy price action but a bullish bias so we expect a touch of $36 in a day or two- and the-way price behaves there will determine the next move. A break would make $40 the target by the end of the week, while a bounce would suggest that more sideways action will follow.
Alternate scenario: drop below the 200 EMA (4-hour charts), pair finds support at the bullish trend line