
Disclaimer: The opinions expressed by our writers are their own and do not represent the views of U.Today. The financial and market information provided on U.Today is intended for informational purposes only. U.Today is not liable for any financial losses incurred while trading cryptocurrencies. Conduct your own research by contacting financial experts before making any investment decisions. We believe that all content is accurate as of the date of publication, but certain offers mentioned may no longer be available.
Most of the coins have entered the correction phase. However, there are some exceptions to the rule. Mainly, Bitcoin (BTC) and Chainlink (LINK) are the only two coins located in the green zone.
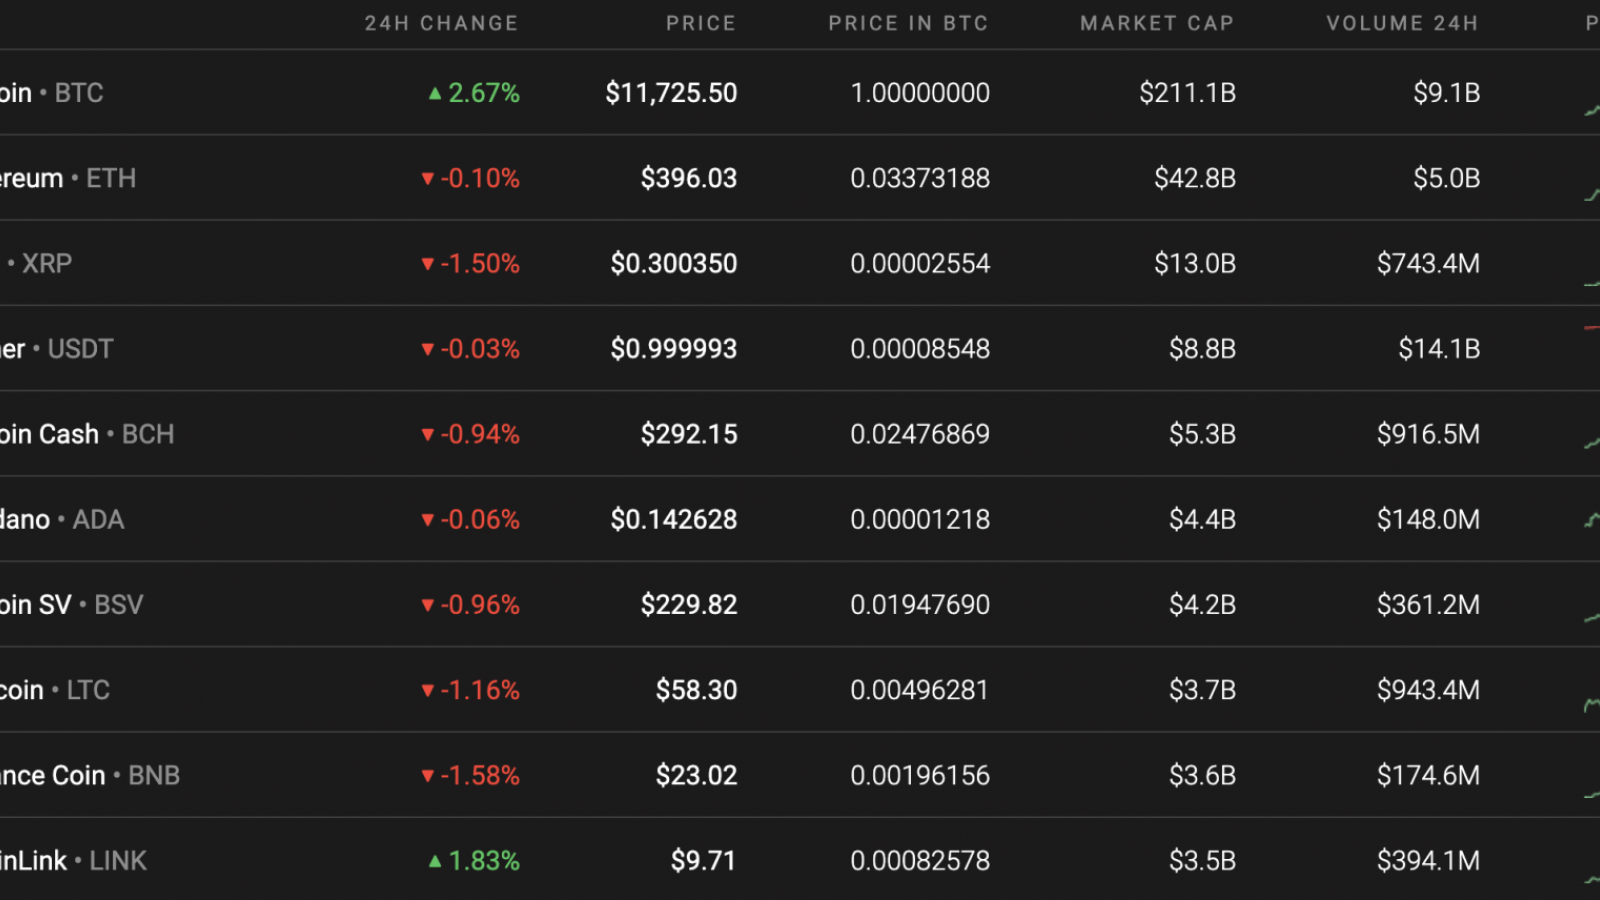
At the same time, market capitalization keeps rising even though most of the coins are in the red zone. The current index constitutes $351 bln.
The relevant IOTA data today:
-
Name: IOTA
-
Ticker: MIOTA
-
Market Cap: $881,126,408
-
Price: $0.317006
-
Volume (24h): $22,035,478
-
Change (24h): 2.70%
The data is relevant at press time.
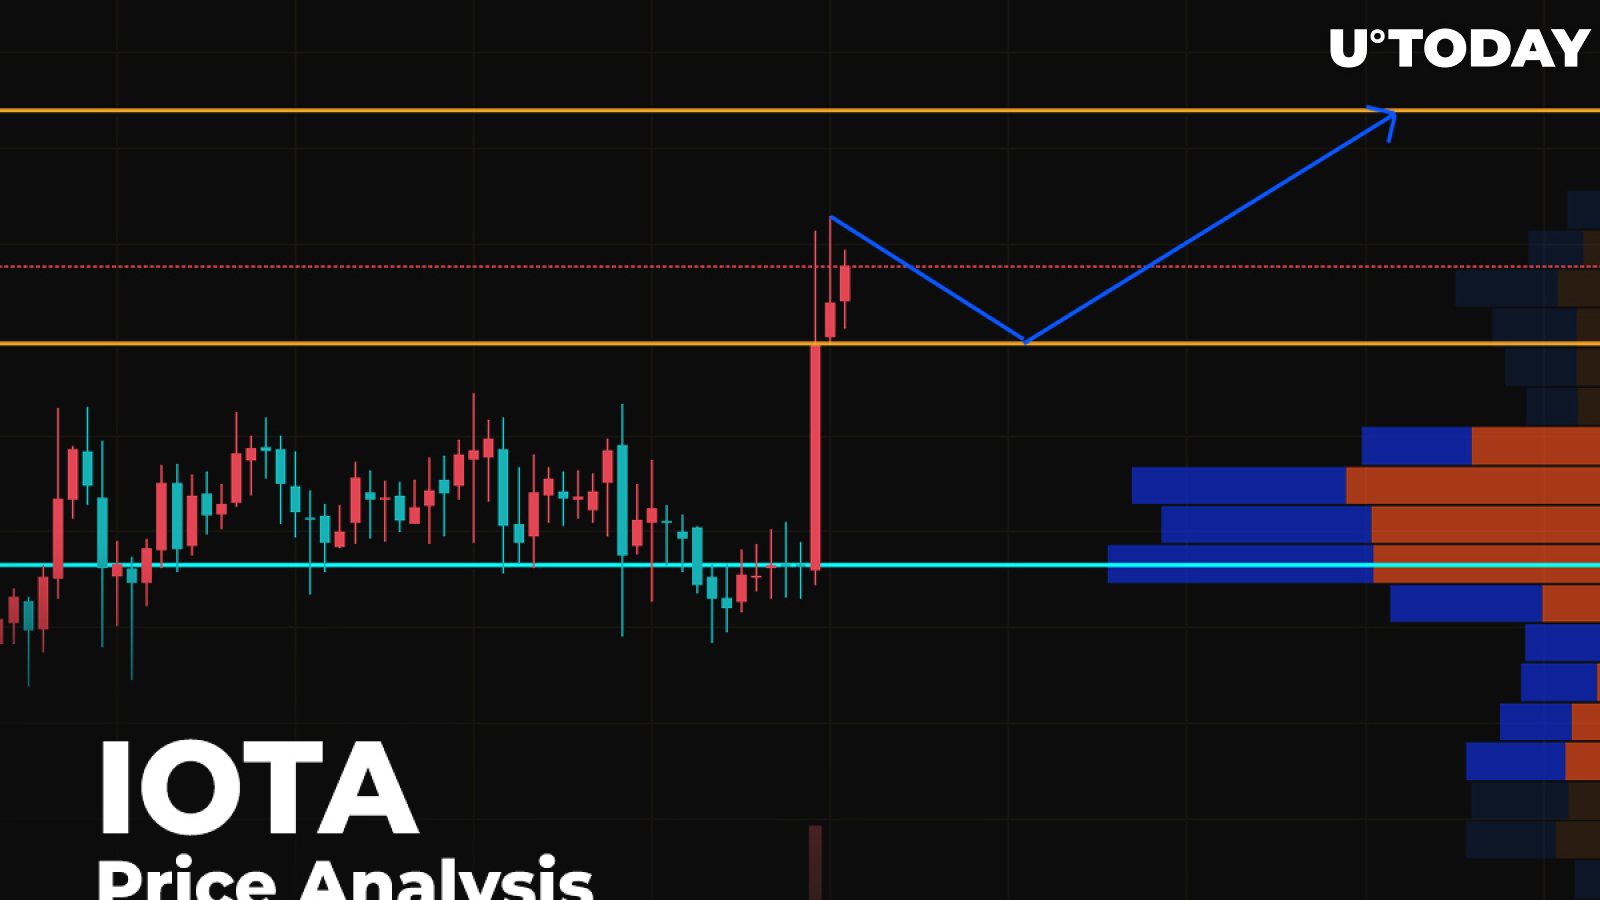
IOTA/USD: Can growth reach $0.35 by mid-August?
IOTA is not an exception to the rule as it has also joined the altcoin season. The rate of the crypto has risen by almost 3% since yesterday, while the price over the last week has risen 6.36%.
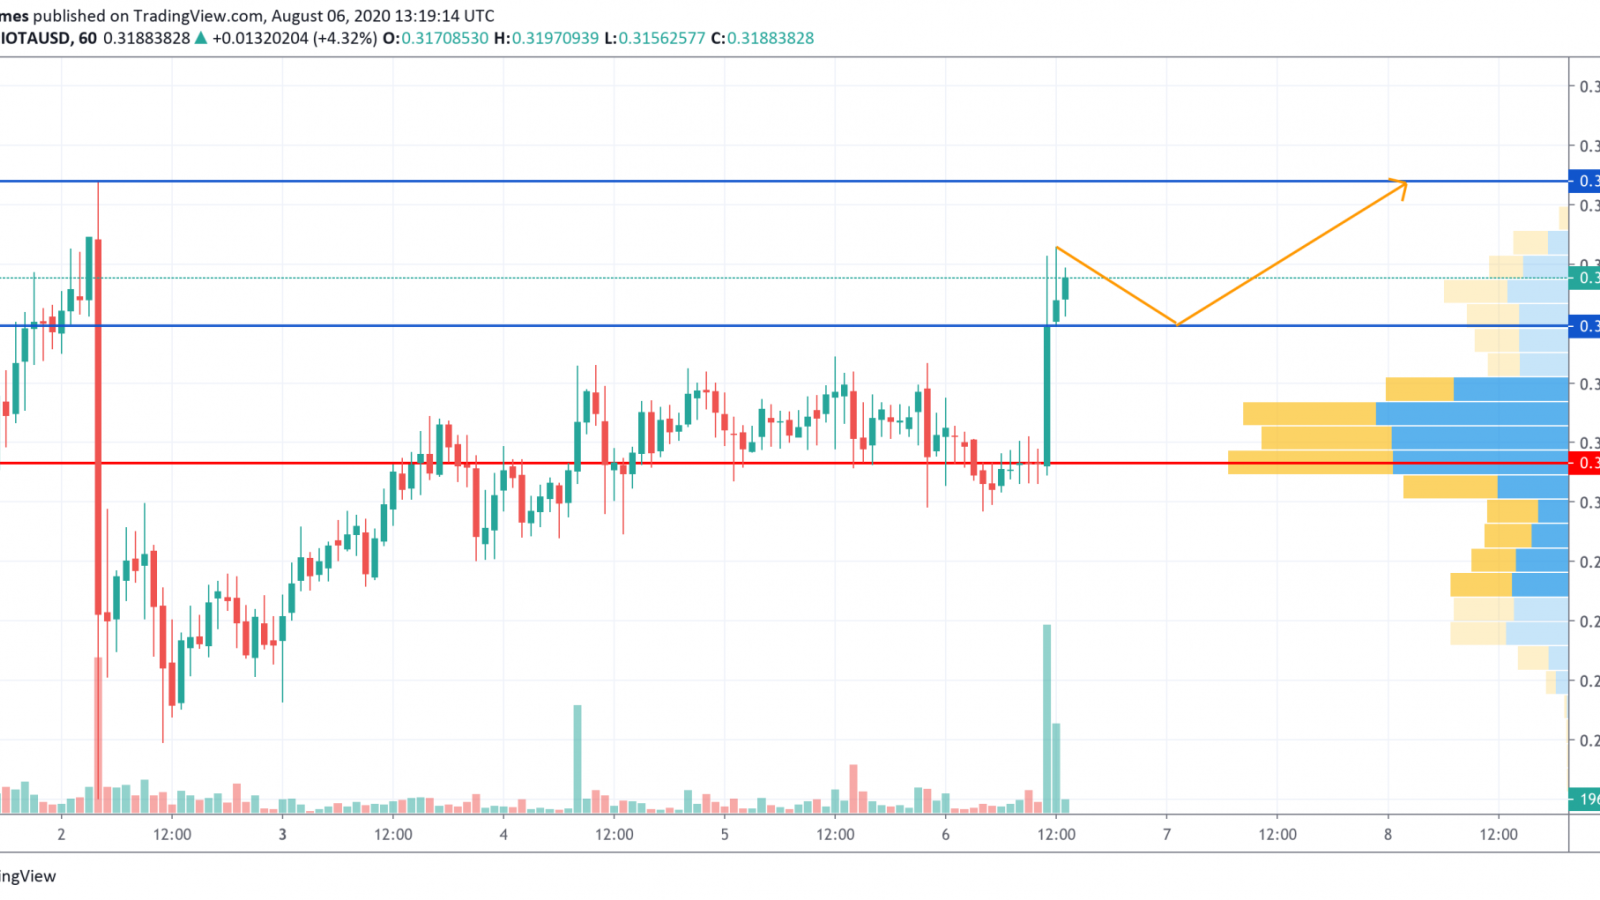
On the hourly time frame, IOTA has successfully bounced off the support of $0.30 and fixed above the $0.31 mark. The bullish trend remains the most relevant scenario. However, buyers need to gain more energy to keep the rise going. What's more, the trading volume is declining while the coin is trading at the same level. There is a high chance of seeing a drop to the nearest support of $0.3150 by the end of the week.
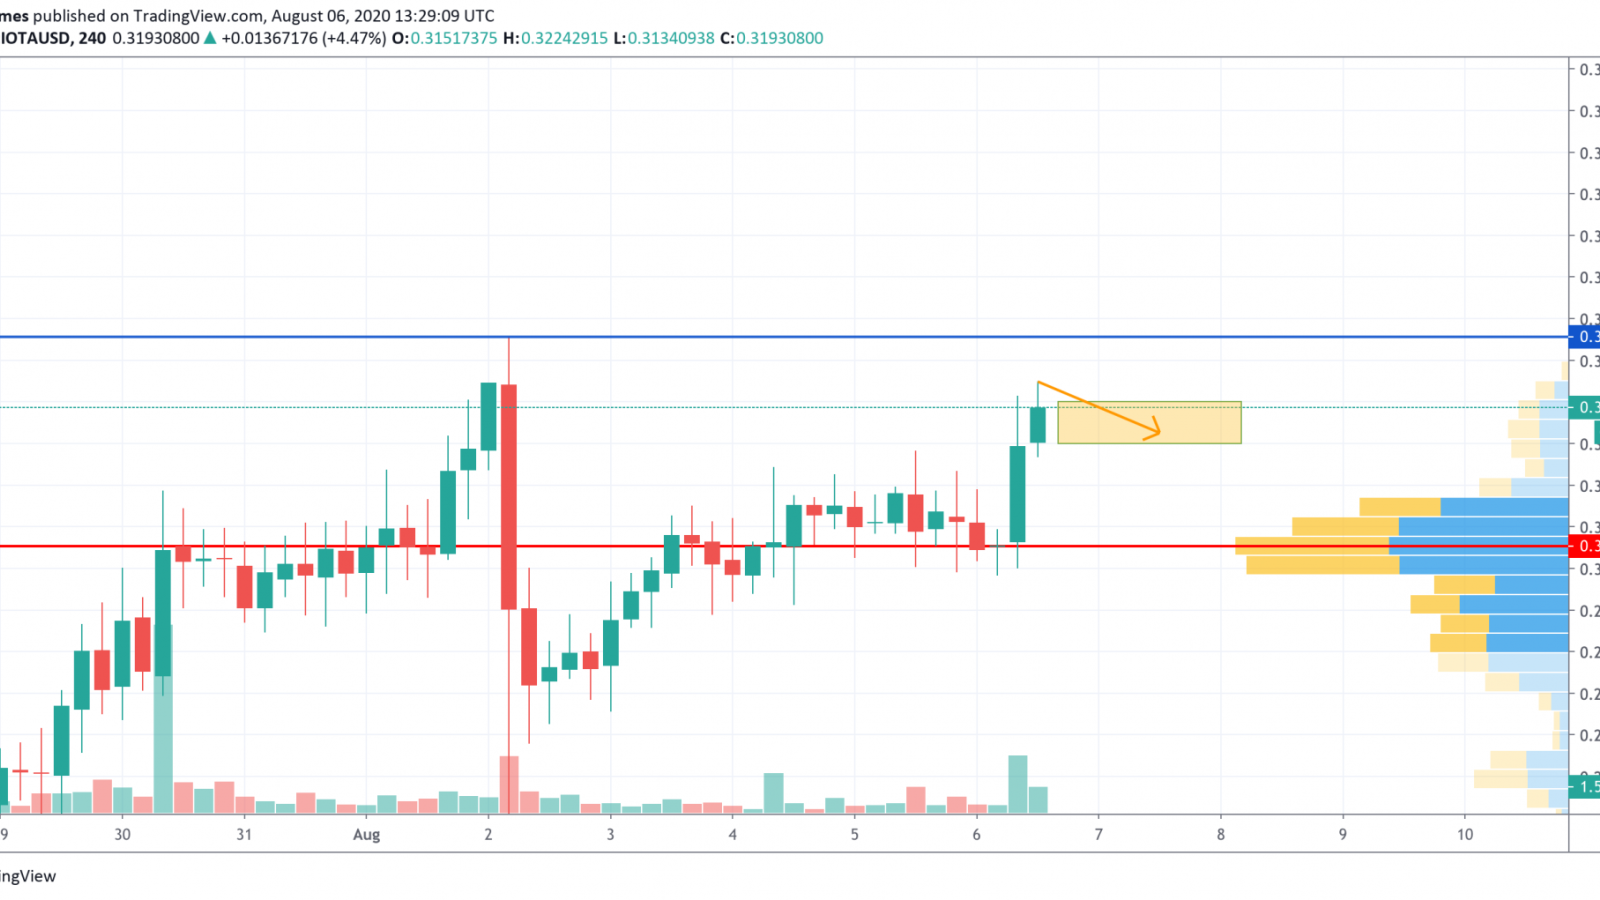
On the 4H chart, the situation is not so positive. IOTA has risen by 20% since the beginning of August; however, further growth is unlikely to continue so fast. The trading volume, as well as the liquidity, is at the lowest level, which means that bears are not going to give up soon.
In this regard, sideways trading may happen soon as the altcoin is still located in the bullish zone but has no power to keep going up. This is why traders may find the rate of IOTA between $0.3150 and $0.32 within the next few days.
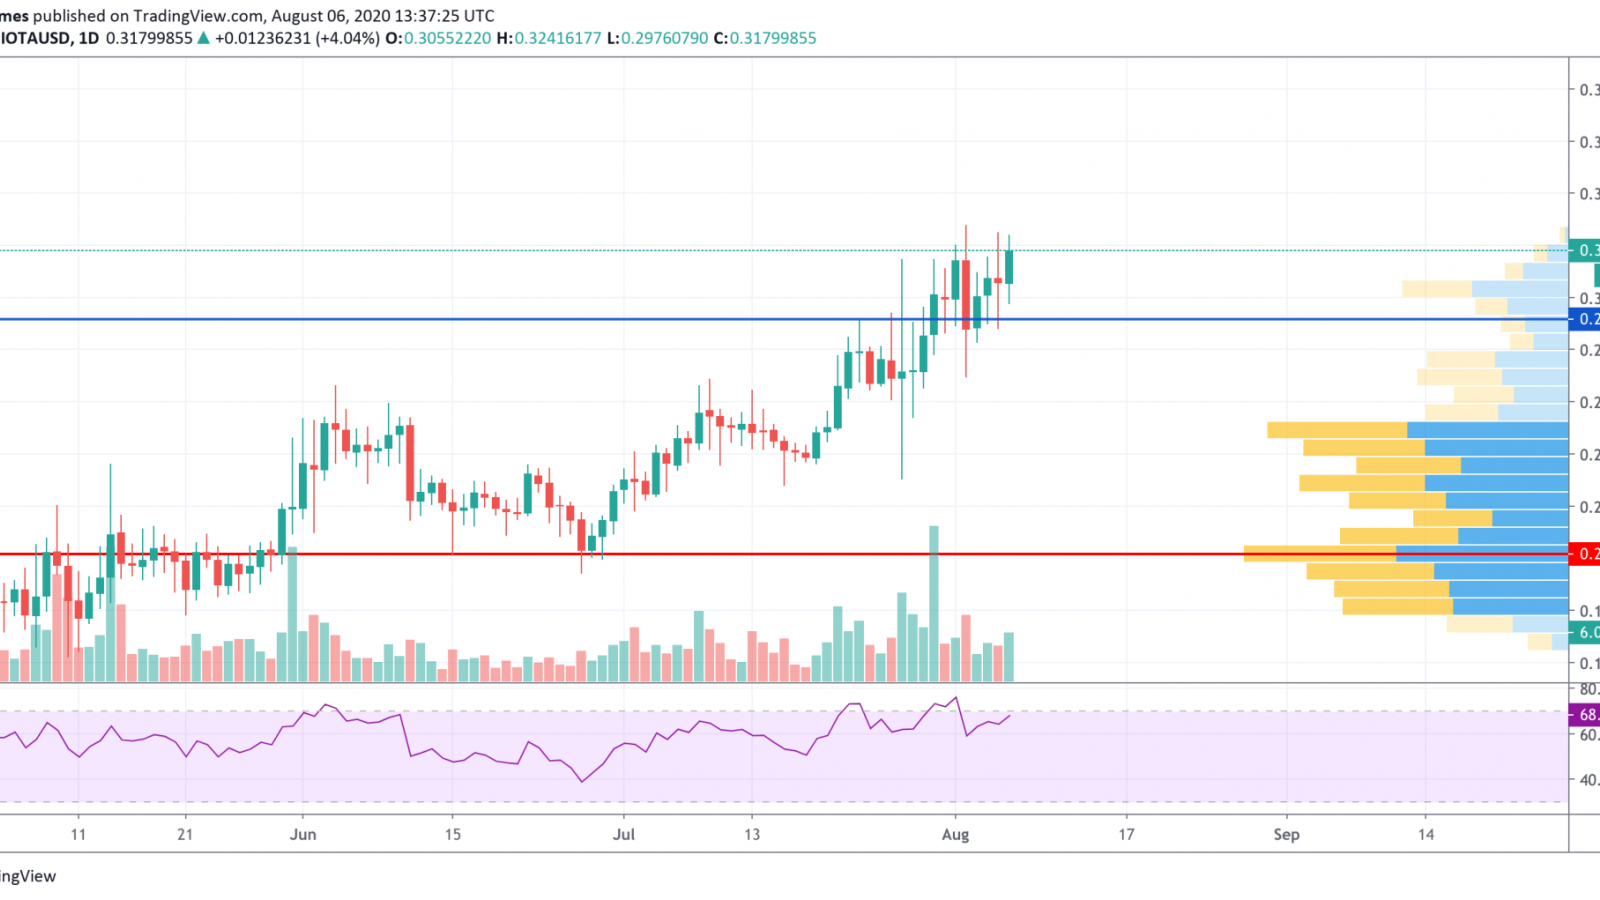
On the longer time frame, bearish sentiments have begun to appear. Liquidity is low as no active buyers are willing to buy IOTA for the current price. In addition, the RSI indicator has almost reached the overbought area, considering an ongoing price drop. If that happens, the closest support level is located at $0.2915.
IOTA is trading at $0.3173 at press time.