

Ethereum continues surprising us with its unexpected price moves, and now it seems to be making another decision. Will it continue gaining in price, or is the cryptocurrency doomed to fail? Those Ethereum price predictions from TradingView professional traders are here to clear up the situation. Find out how to trade ETH, and why some people think its breakout was simply fake.
There’s no need to worry
A lot of traders have expressed their fear that Ethereum will retrace to its previous support lines. Should we worry about that? As we know, cryptos have a habit of repeating some patterns over and over again. Ethereum is no different.
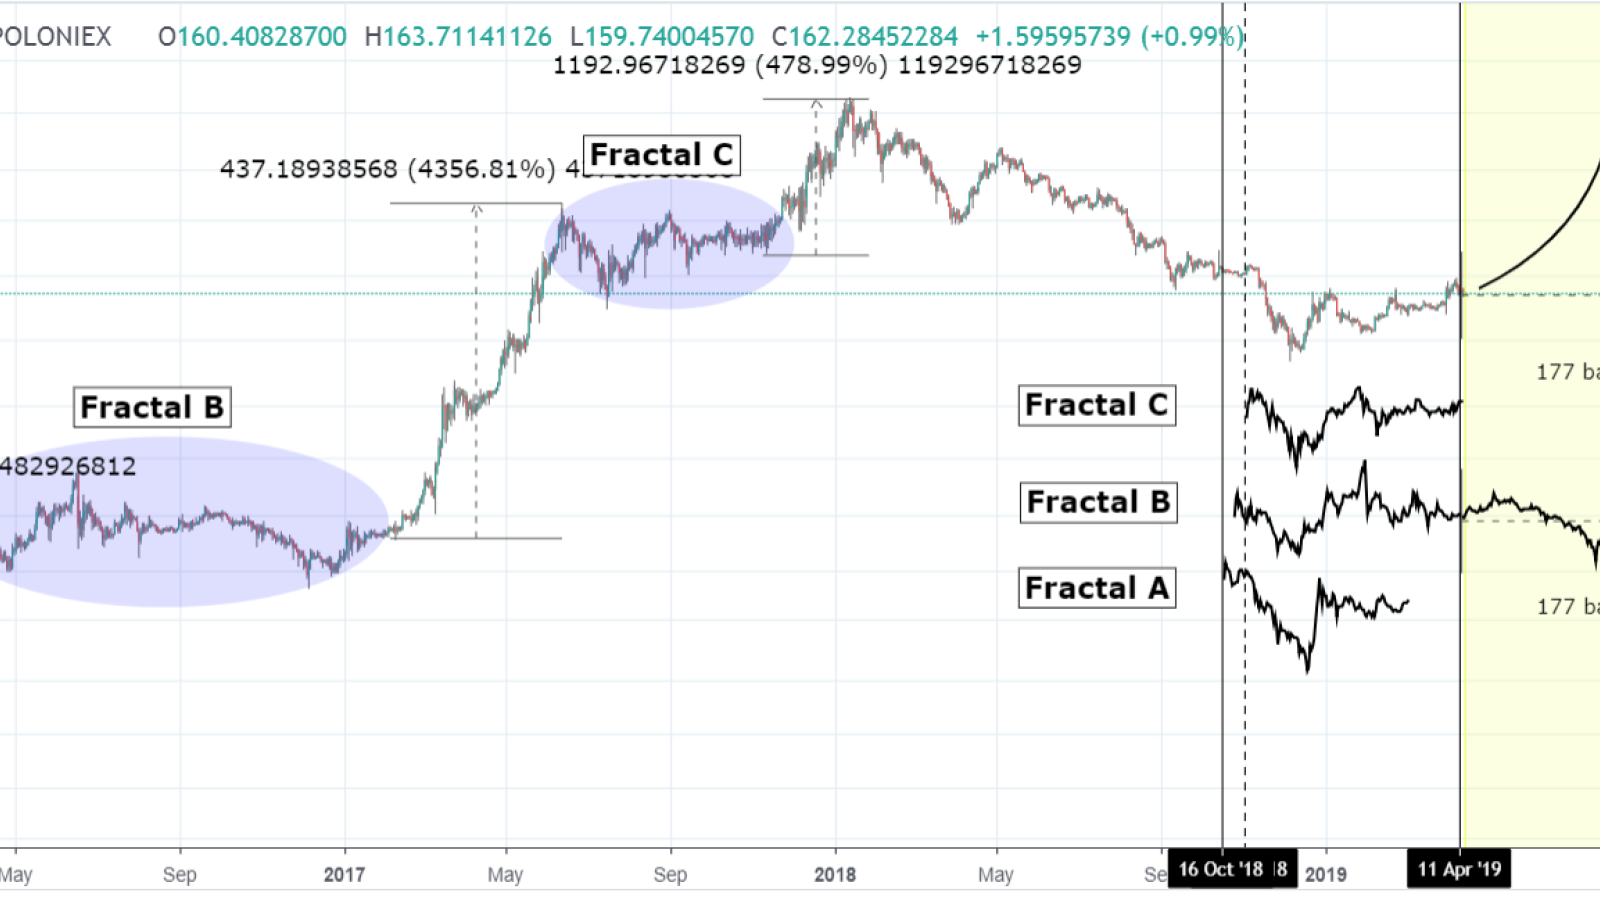
TradingShot analyzed the Ethereum's bull market is in particularly 3 fractals which all appear to share a similar candle action to ETH's price volatility from October 2018 to date.
Initial price drop, high volatility (consolidation) with an obvious Resistance and then aggressive rise. The exception is Fractal B which consolidated longer (almost twice as long) making a re-test of the initial drop/low (even slightly breaking) it before it broke out. It did, however, increase much more than other two (around +4,300% as opposed to Fractal A +1,800% and Fractal C +480%).
Since ETH/USD hit the bear cycle's bottom in December, we can expect it to start rising more aggressively on the short term. TradingShot pays particular attention to Fractal B as in duration it is much more similar to Bitcoin's expected consolidation phase. In that case, we have roughly another 175 days of trading between the cycle's bottom of $80 and current resistance about $185.
The breakout is fake?
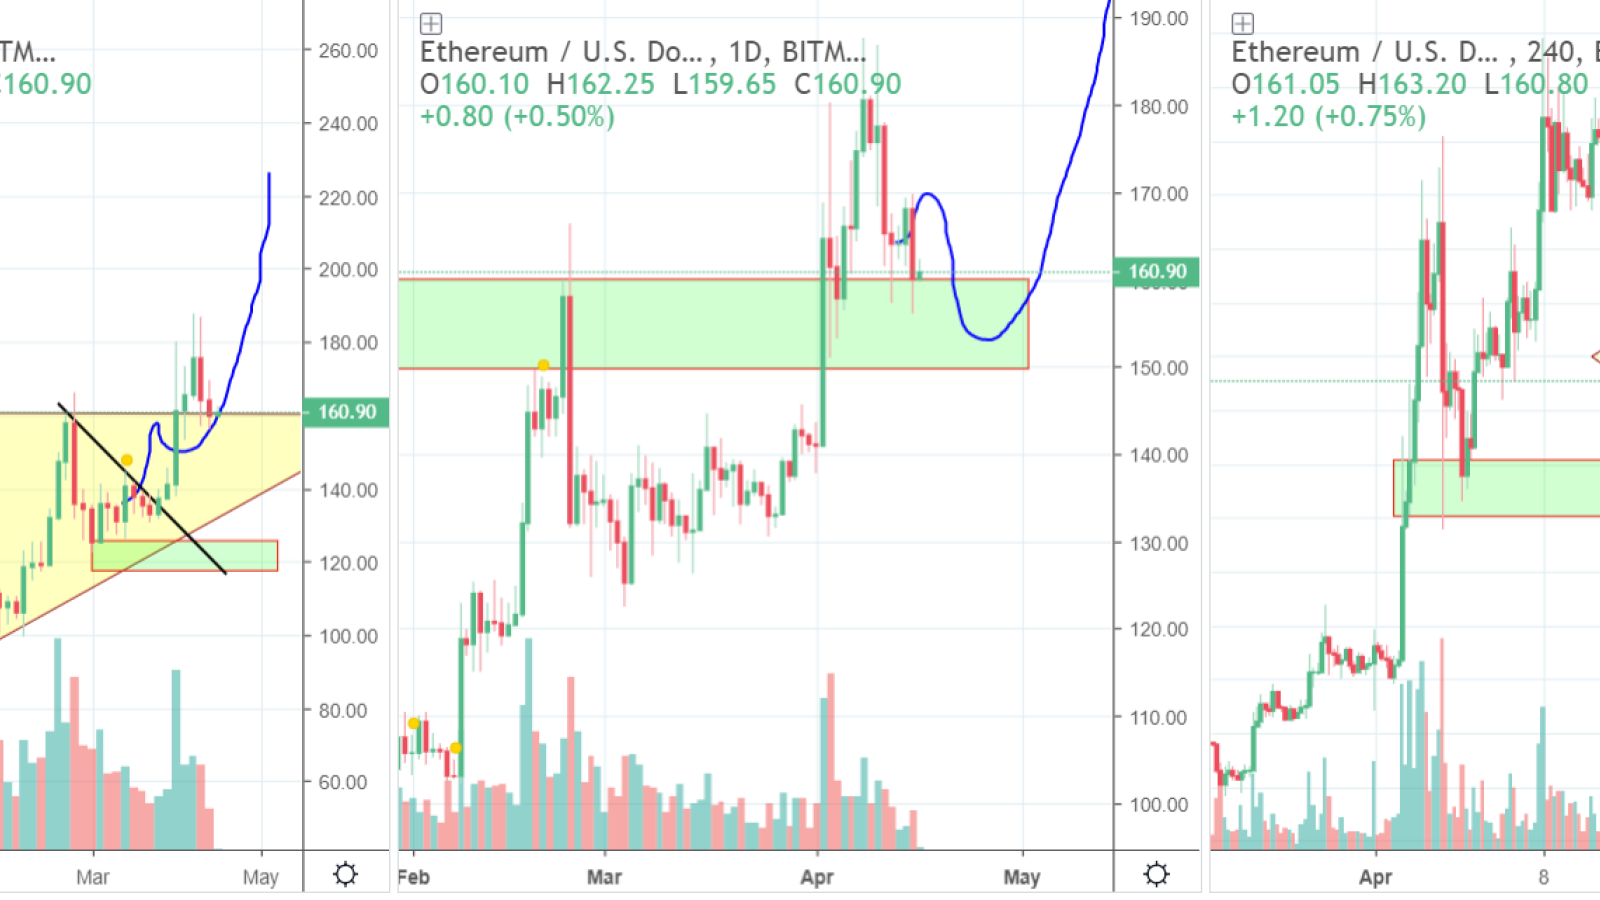
According to botje11, the overall crypto market will go sideways this weekend, making an ABC correction. So maybe Ethereum will fall towards $161-162 and then up towards $169-173 and then one more drop in the $150-$160 zone. The trading expert claims that ETH is to make a short-term ABC correction.
As we see, ETH bounced up from the $156 quite well at first, but these past few hours the move up has slowed down again. Increasing the chances the move (correction) down has not been completed yet. The new wedge on the right represents a perfect scenario. Breaking the $160-$155 of what looks like the neckline of an H&S, but while doing that fooling all the bears playing that H&S and then using their shorts as fuel to create a good push upwards.
$168 resistance should be broken
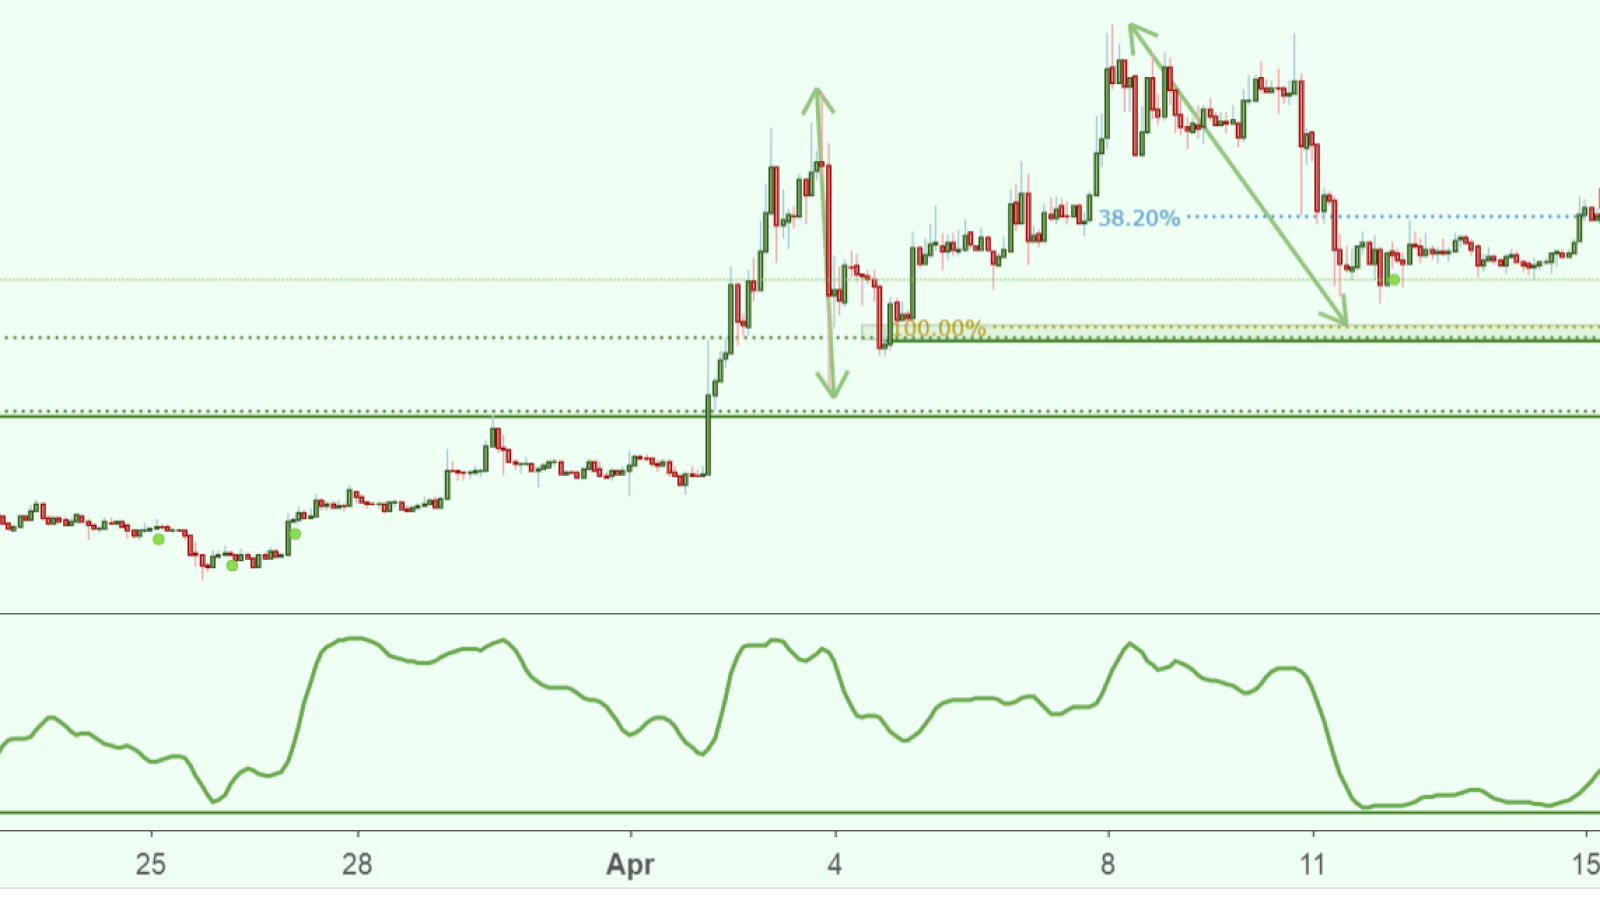
ETH/USD is approaching its first support line at $156 a strong bounce might occur above this level pushing price up to our major resistance at $168.67 (horizontal swing low support, 100% Fibonacci extension, 50% Fibonacci retracement ) where (horizontal swing high resistance, 38.2% Fibonacci extension, 61.8% Fibonacci retracement ).
Stochastic is also approaching support where we might see a corresponding bounce in price. Trading CFDs on margin carries high risk. Losses can exceed the initial investments, so trade carefully and enter the market only when you’re sure.
ETH will stay strong
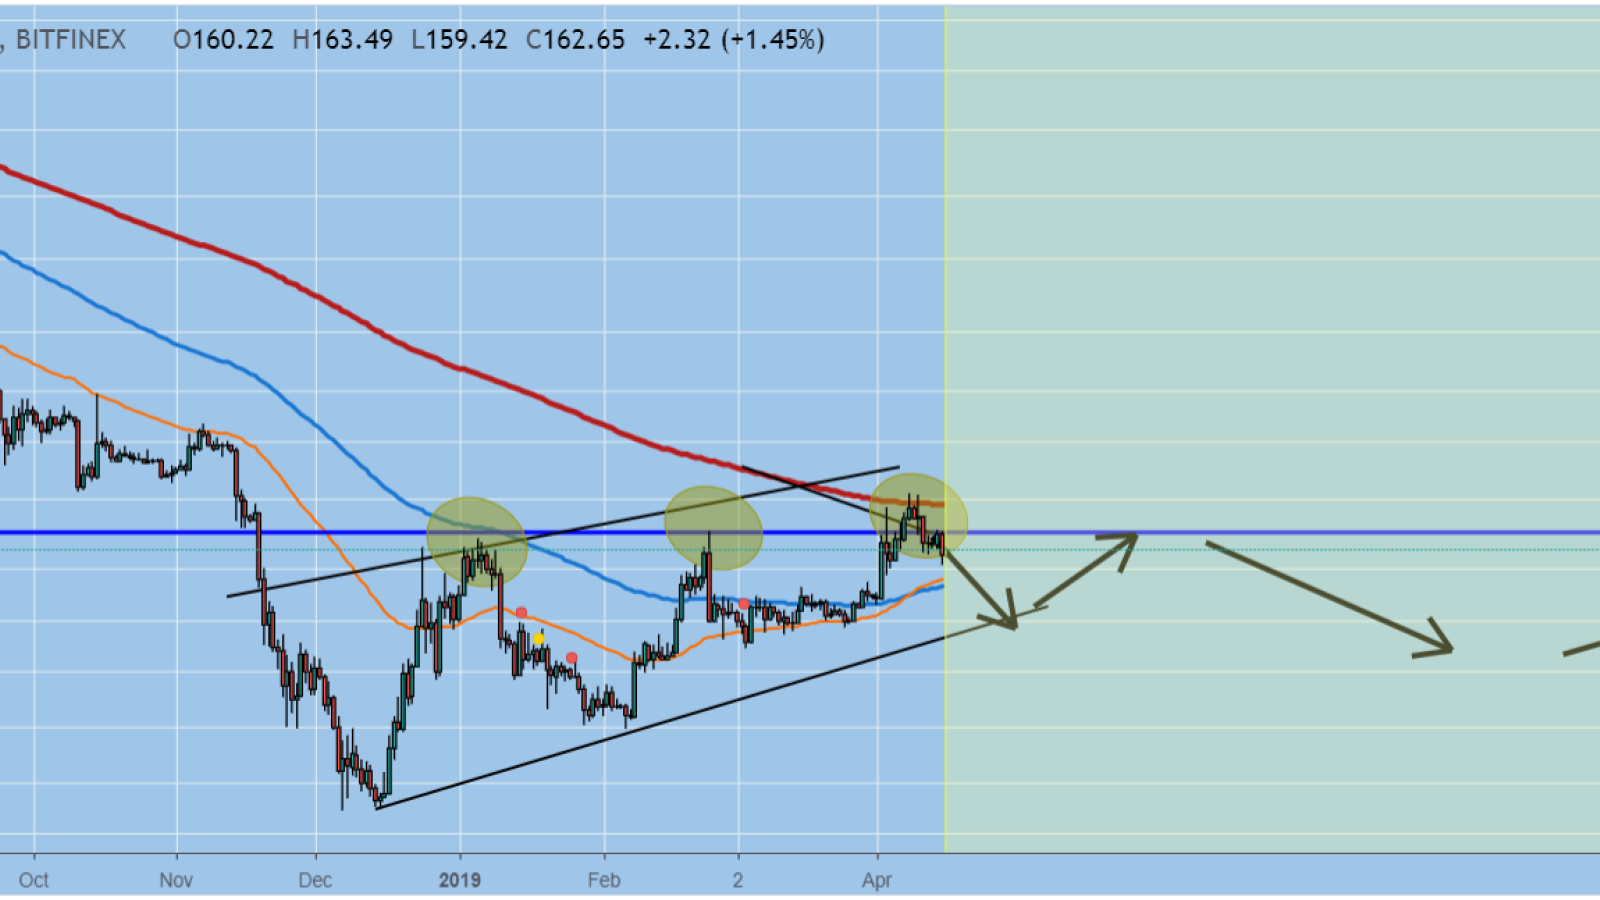
According to this trading expert, one more sell-off should be expected in the next few days/weeks. ETH could not hold the strengthened zone because there is a lot of resistance on this level.
Look at the 50, 100 and 200 EMA? Now, if we continue to move sideways and move up, this could give us the opportunity for a golden cross. The 50 and 100 EMA is already on our side. Now, all we have to do is convince the strong 200 EMA to work for us and we will see substantial price increases. However, it will take some time.
It’s crucial for Ethereum to defend its level. No new lows should be sought, otherwise the next bull market will continue to slow down.
All in all, we shouldn’t worry about Ethereum’s future price – even if it drops to the previous support level, it will gain at price afterward. This is what technical indicators show, and what many traders reckon. Very soon, we’ll have the right time to enter the market.
Price charts are taken from TradingView