

EOS is on the verge of overcoming the $7 threshold again, and traders stay highly optimistic. What might spark the growth of the Top-10 cryptocurrency, and how to trade it? Let’s see what TradingView users think: read their EOS price predictions and check out EOS price charts: there’s a lot of useful information.
EOS in accumulation zone between $6.88-7.2
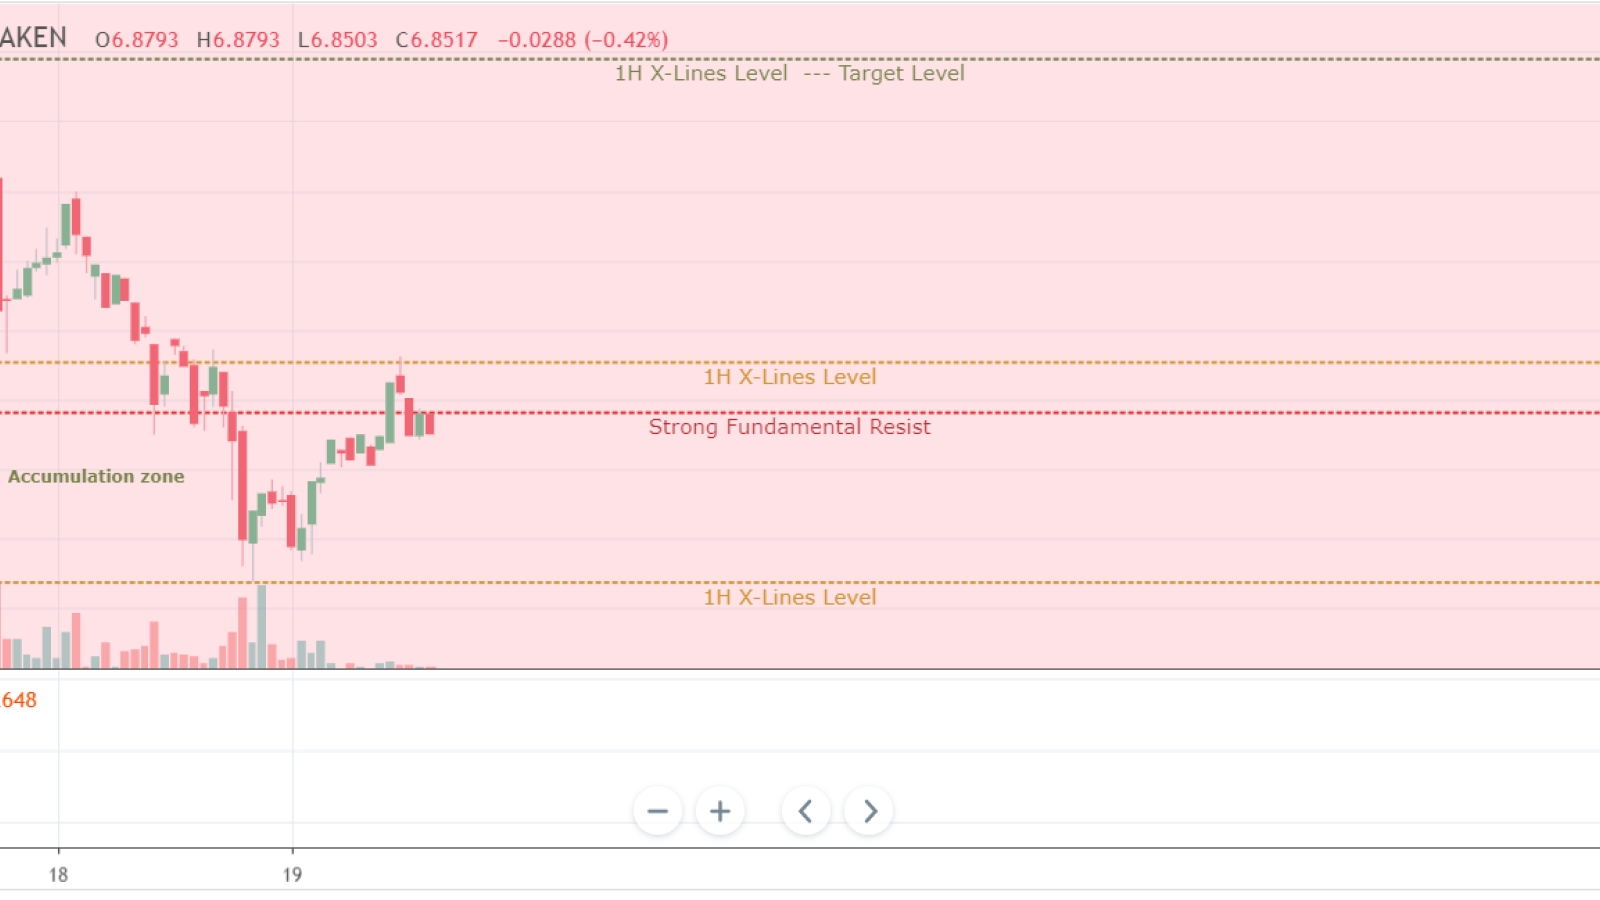
JinFlark uses the volumetric method of market analysis in this chart. In this work, he uses a great helper: the X-volume indicator. Its show strong accumulation for purchasing between $6.88-$7.2. Check the levels with x-lines indicator: we have two close levels on 1H chart: $6.88 and $6.95. When we have two close levels on one timeframe (in this situation its 1-hour timeframe), the lowest one in 90% is a strong resistance. Also as you can see we have a big square without levels: from $6.95 to $7.39. Logically, this kind of accumulation market doing for a fast transition to $7.39.
EOS/BTC potential bounce
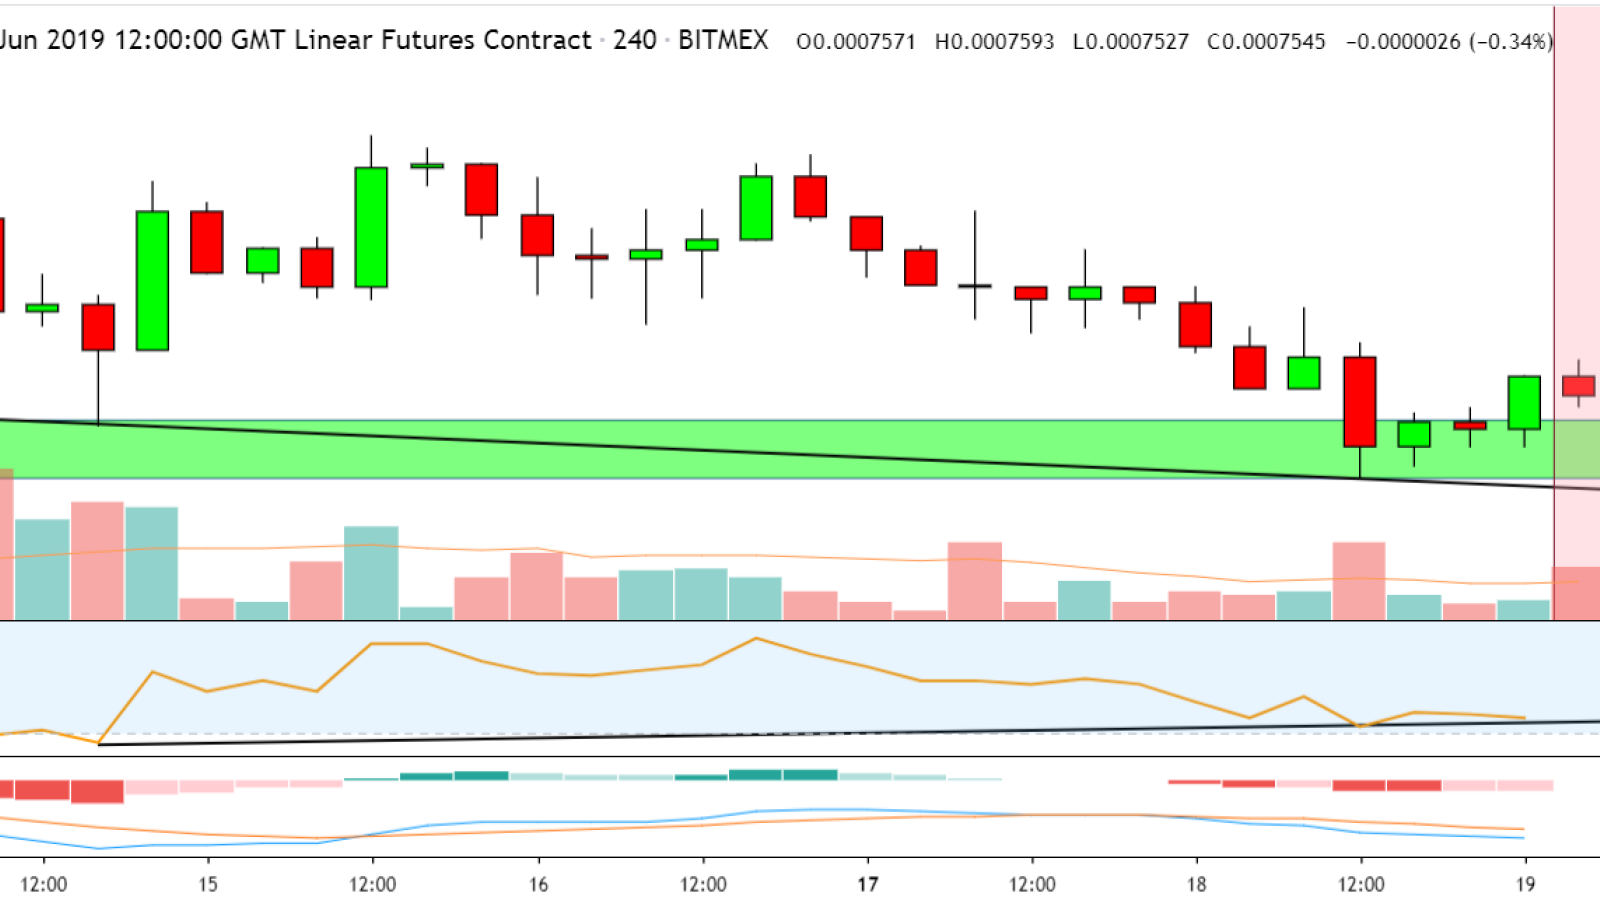
According to cryptoprodigy101, EOS/BTC is sitting at major daily support. Lower time frames are showing some bullish pressure and buying. Tight stop loss under this area is invalidating. Soon it will be time to reap profits if you took your chance to buy some EOS recently!
EOS up to $10-11?
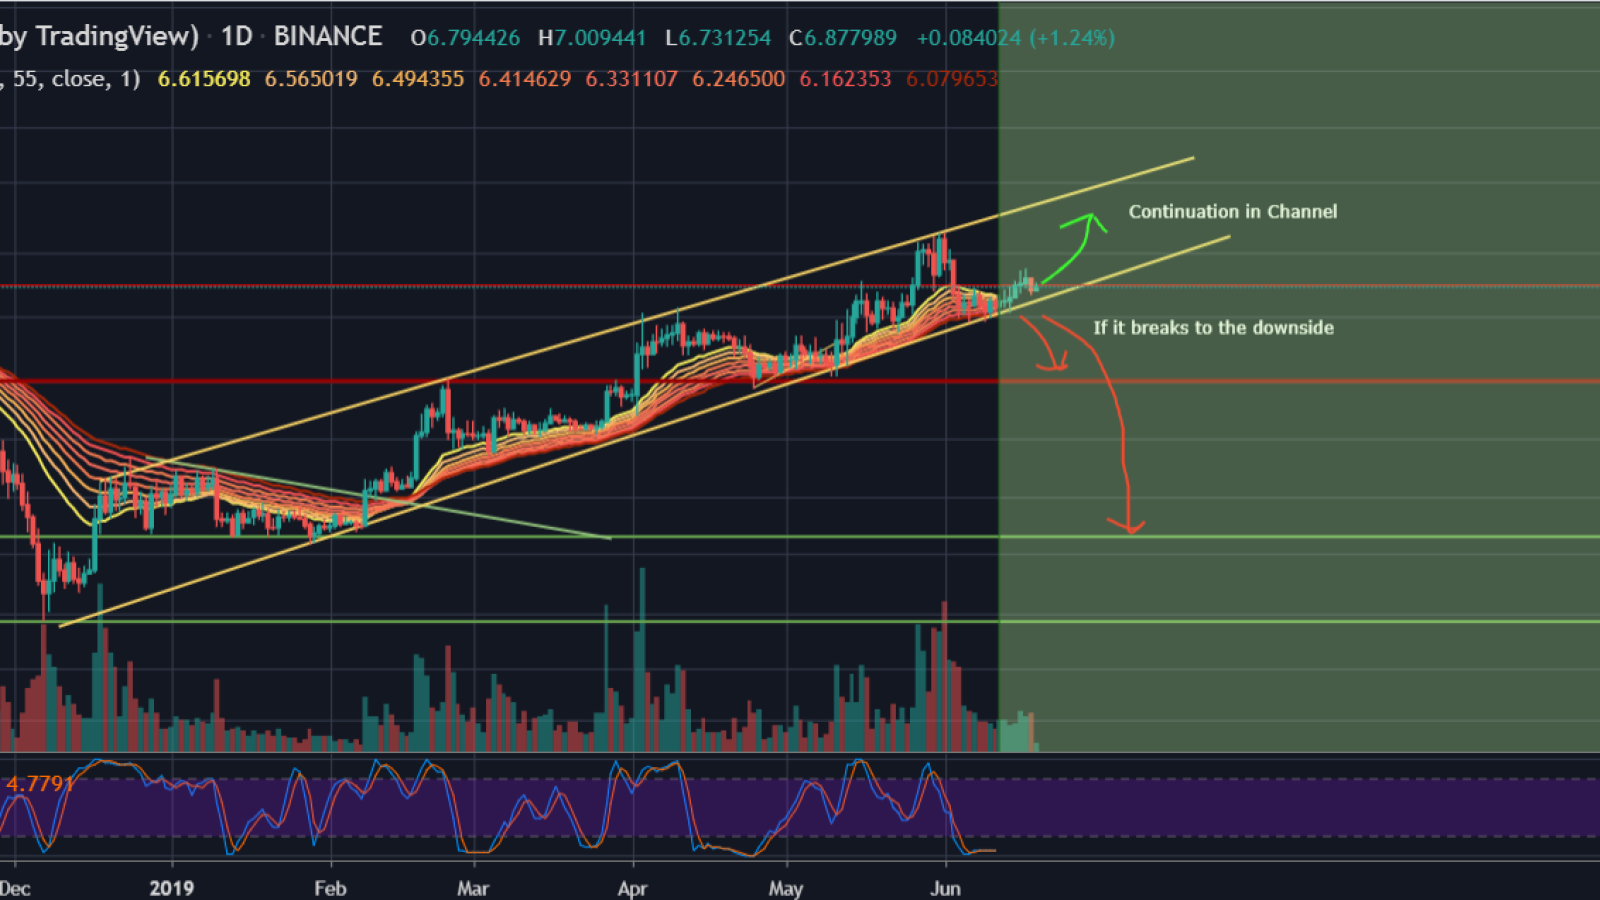
On the logarithmic chart from niewall_trading, we can see that EOS has followed its Channel since the 18th December 2018. That could mean that the chance of getting supported by the lower upwards trending support line of the channel is smaller than in a younger channel.
Besides that, there is a good chance of getting supported by the Channel and the EMA-Ribbon on the Daily log Chart of EOS. That would put the target at the top of the Channel, which would result in a price of about $10-$11 if it takes the same time as other Cycles.
A stop could be placed under the EMA-Ribbon and the channel. Keep tabs and invest until it’s too late.
Ascending triangle: Last chance to buy EOS cheap
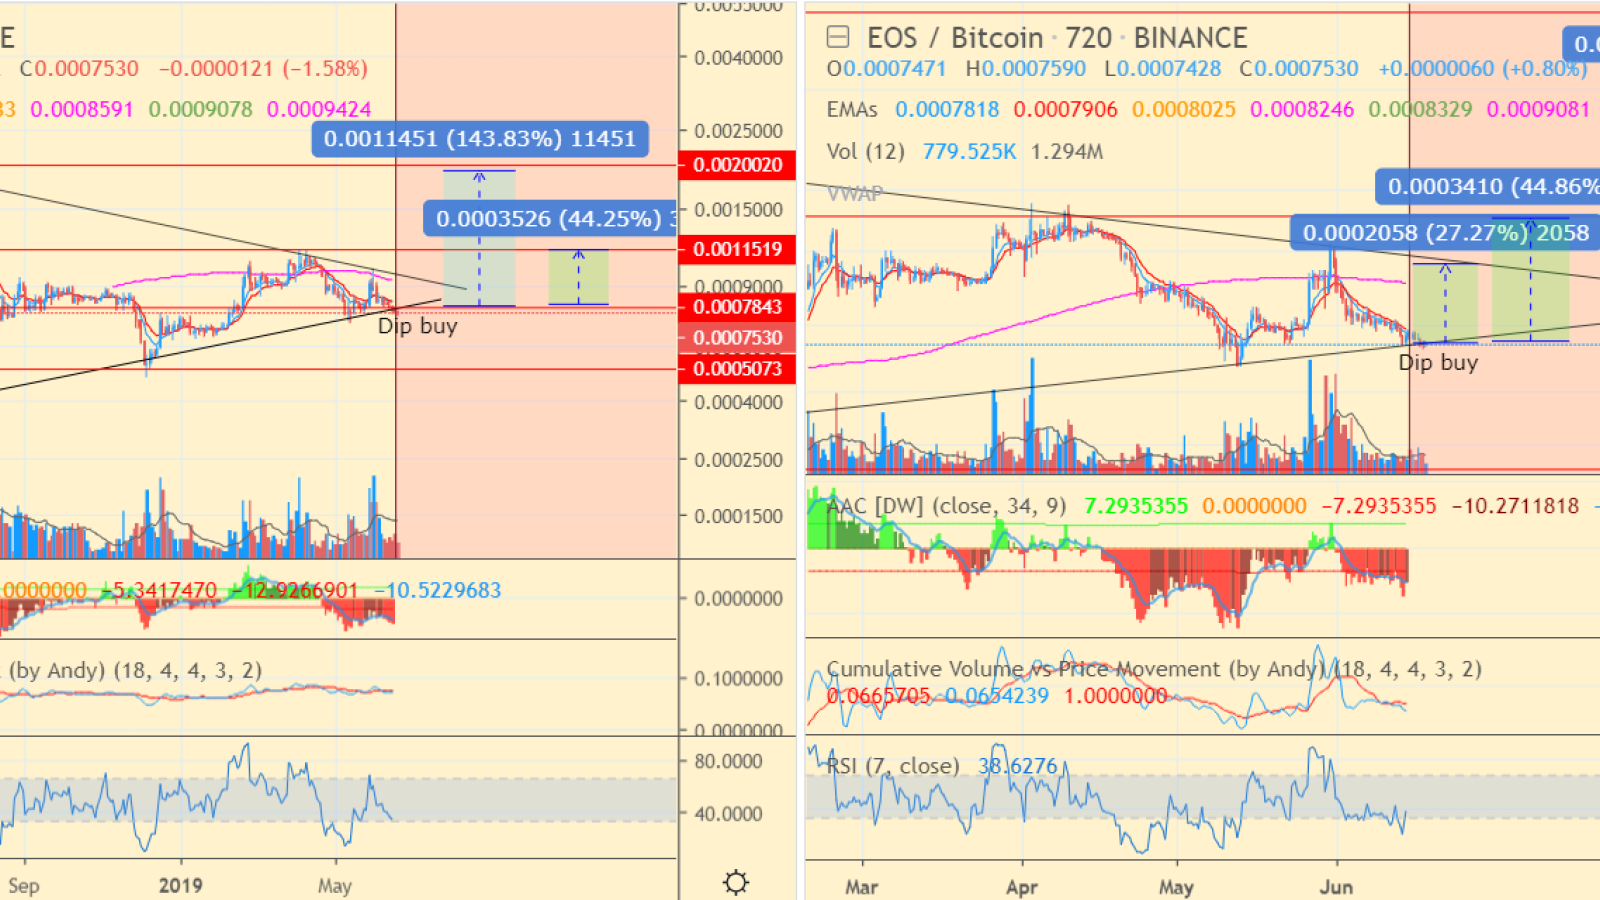
EOS/BTC has been consolidating since 2018 and the price has been creating an ascending triangle: we can clearly see it on the chart from roosgar. On June 15, the price has reached the lower bottom of the ascending triangle. Now it’s going up, so don’t miss your last chance to buy the dip for EOS before the breakout. The nearest and the highest target, for now, is 0.0011451 BTC – this is a very important resistance level. EOS has already increased by 30% and continues showing signs of strength.
Final thoughts
EOS looks very good. Momentum indicators look to be shifting back up, held the support trend line nicely, and if it goes for a retest of previous highs, you could enjoy some substantial gains.
EOS price charts by TradingView