
Disclaimer: The opinions expressed by our writers are their own and do not represent the views of U.Today. The financial and market information provided on U.Today is intended for informational purposes only. U.Today is not liable for any financial losses incurred while trading cryptocurrencies. Conduct your own research by contacting financial experts before making any investment decisions. We believe that all content is accurate as of the date of publication, but certain offers mentioned may no longer be available.
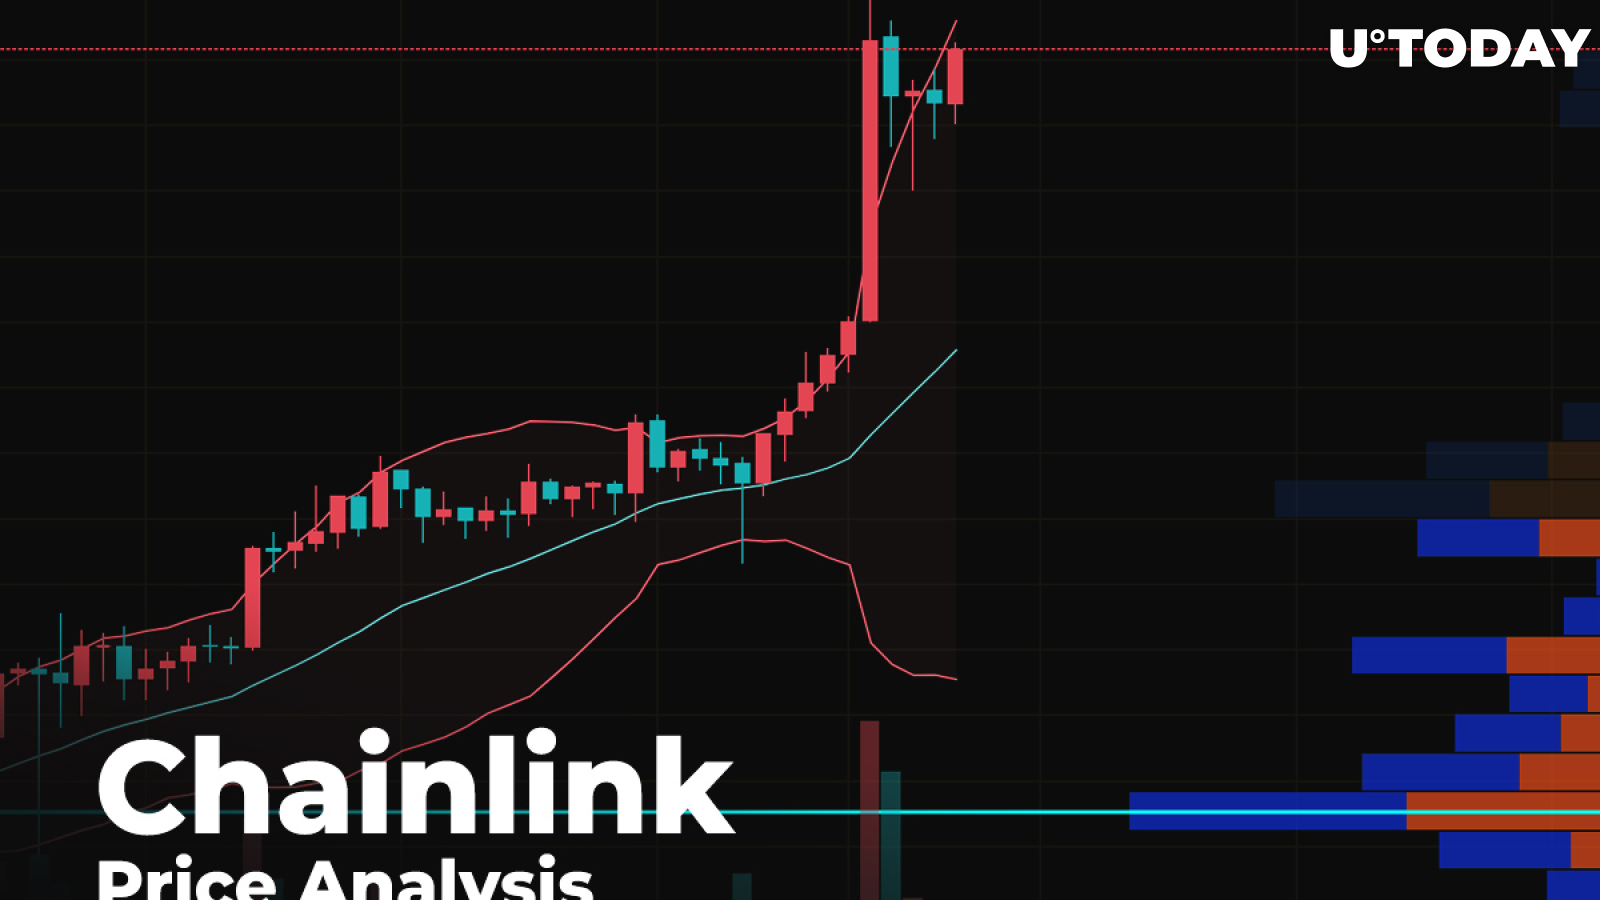
With the last day of the week, most of the Top 10 coins have faced a correction; however, there is one exception to the rule. Chainlink (LINK) has skyrocketed up 23% since yesterday and is now located in 6th place in the global cryptocurrency rankings.
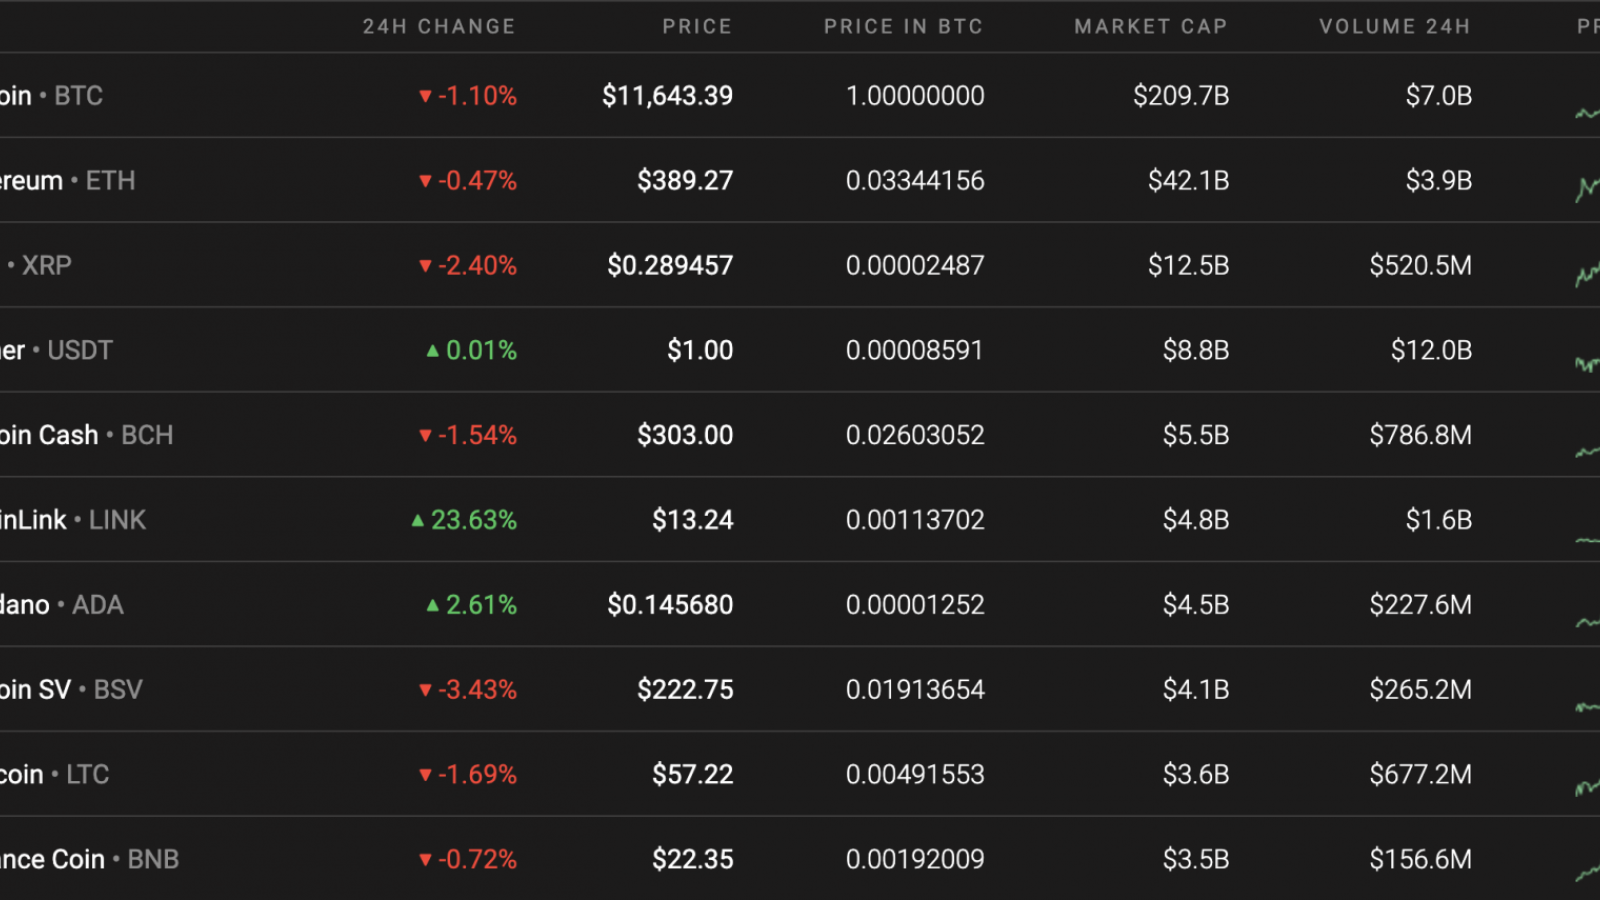
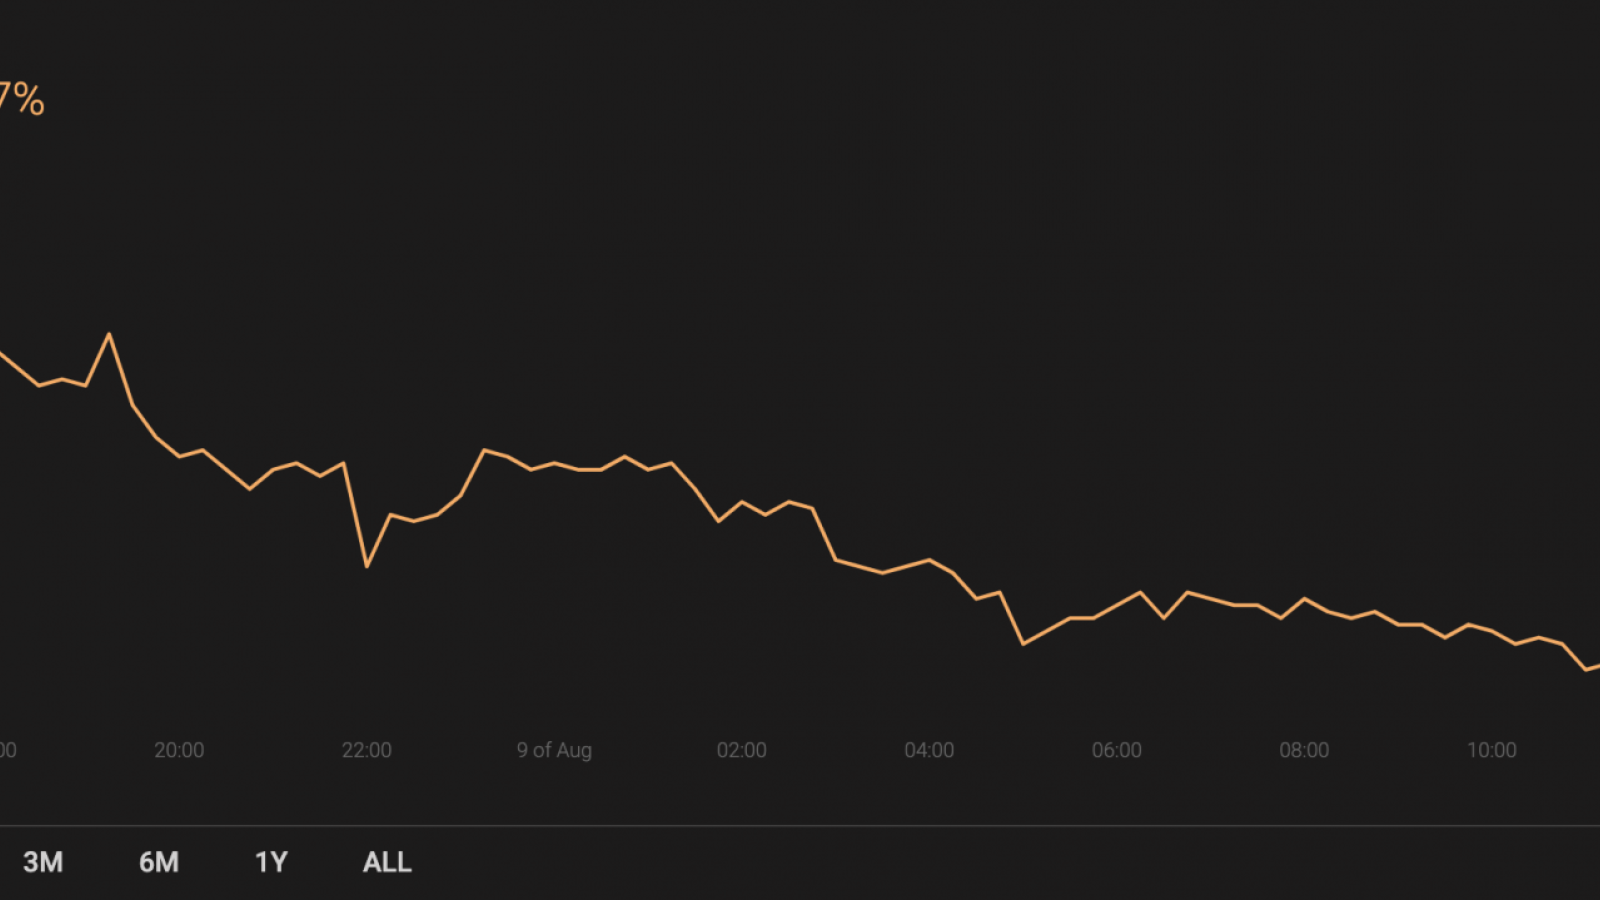
Against the high volatility of the altcoins, the dominance rate of Bitcoin (BTC) has broken the 60% dominance rate as the current index makes up 59.7%.
Below is the relevant data for Chainlink (LINK) and how it's looking today:
-
Name: Chainlink
-
Ticker: LINK
-
Market Cap: $4,656,606,195
-
Price: $13.30
-
Volume (24H): $2,994,091,609
-
Change (24H): 24.75%
The aforementioned data is relevant at press time.
LINK/USD: Can Chainlink Enter the Top 5 Coins by the End of the Month?
Chainlink (LINK) is today's top gainer. Of the top 20 cryptocurrencies, it has grown the most out in terms global rankings. The price change from last week has constituted a surge of 59%.
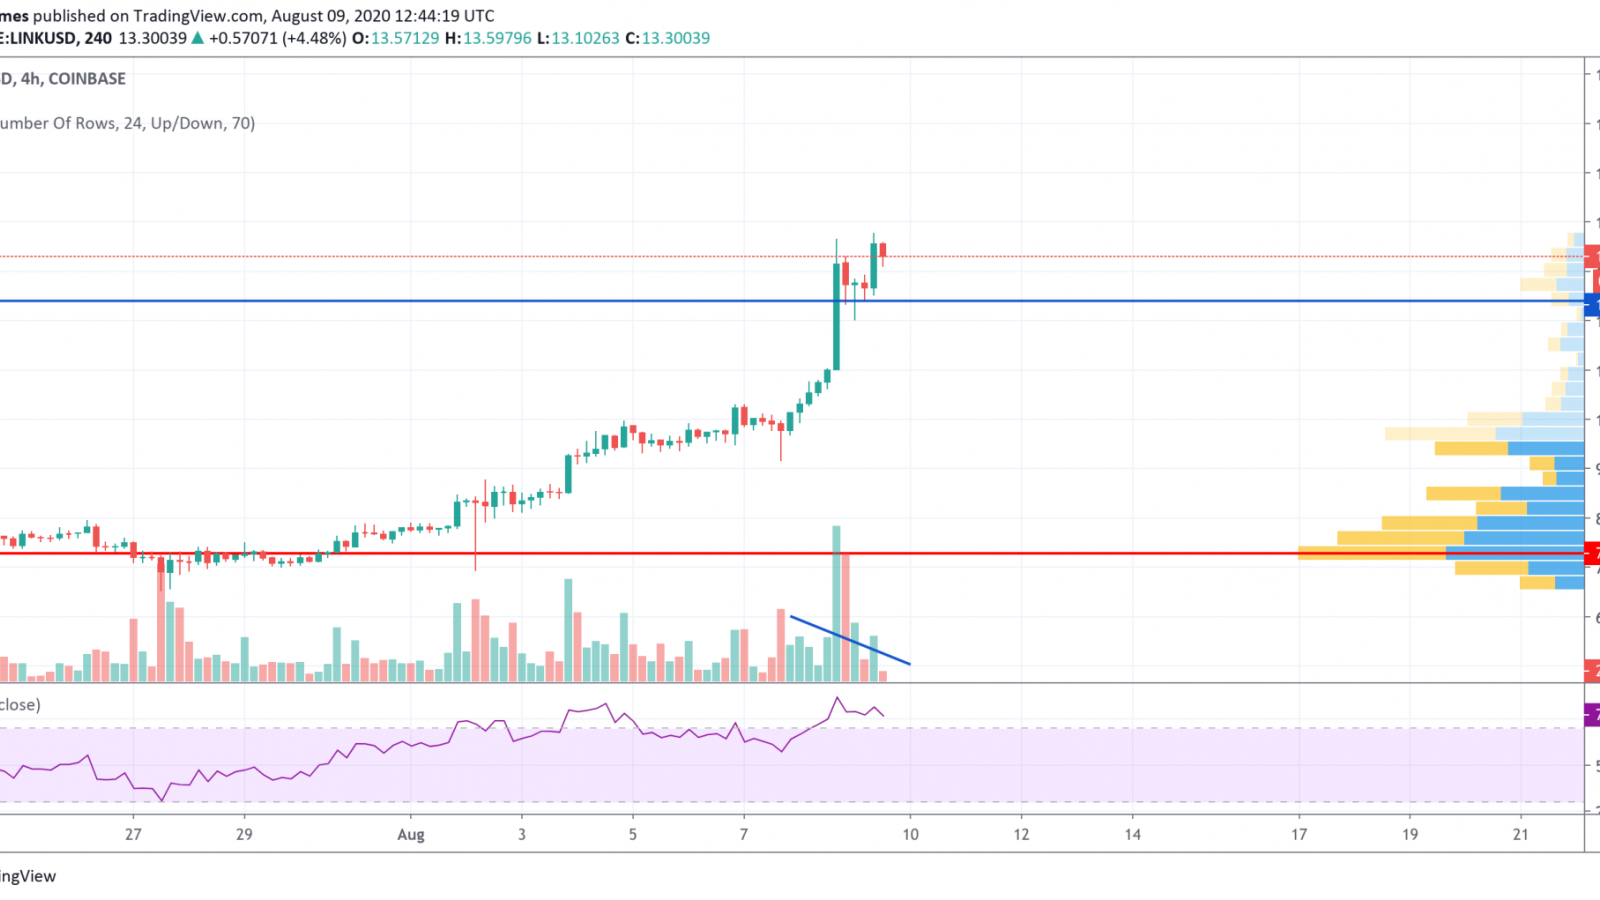
Looking at the 4H chart, Chainlink (LINK) is located in the overbought zone according to the Relative Strength Index (RSI). Even though the bulls are maintaining the growth of the altcoin, the trading volume has slightly declined, which means that there are no active buyers who want to buy LINK at the moment. Respectively, there is a high probability of seeing a correction to the nearest support level at $12.40 in the next few days.
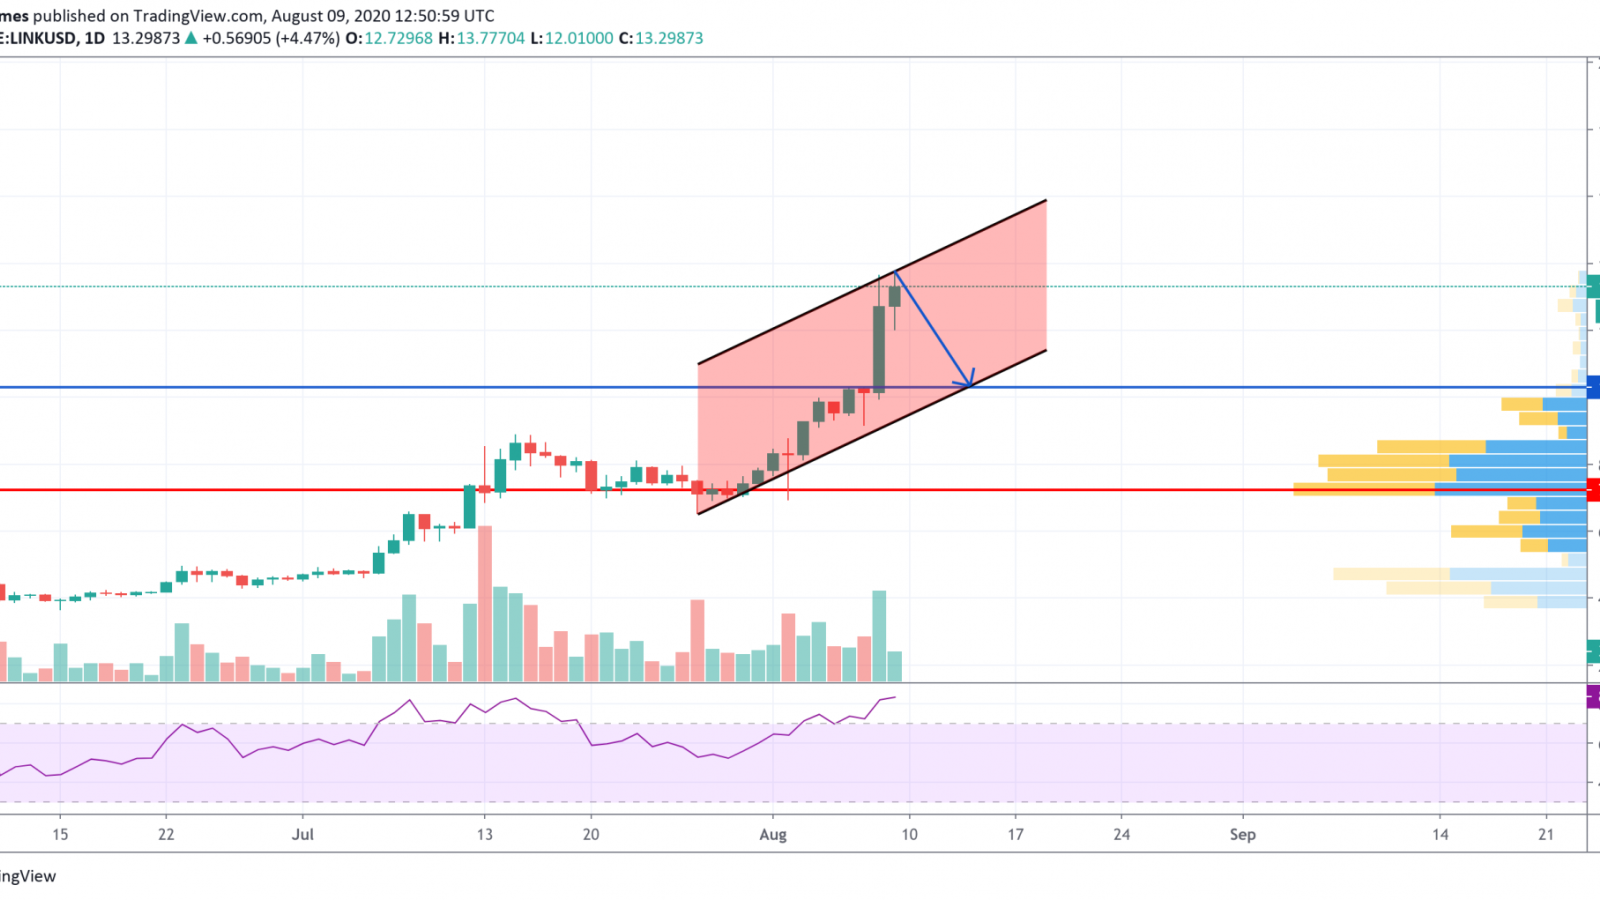
Looking at the bigger picture, the situation also considers a possible correction as the coin is overbought. Chainlink (LINK) has been trading in the ascending channel since the end of July.
Buyers have confirmed the bullish trend; however, they need the altcoin to face a short correction before the upcoming rise. In this particular case, the point where a potential bounce off could occur is the $10.30 mark.
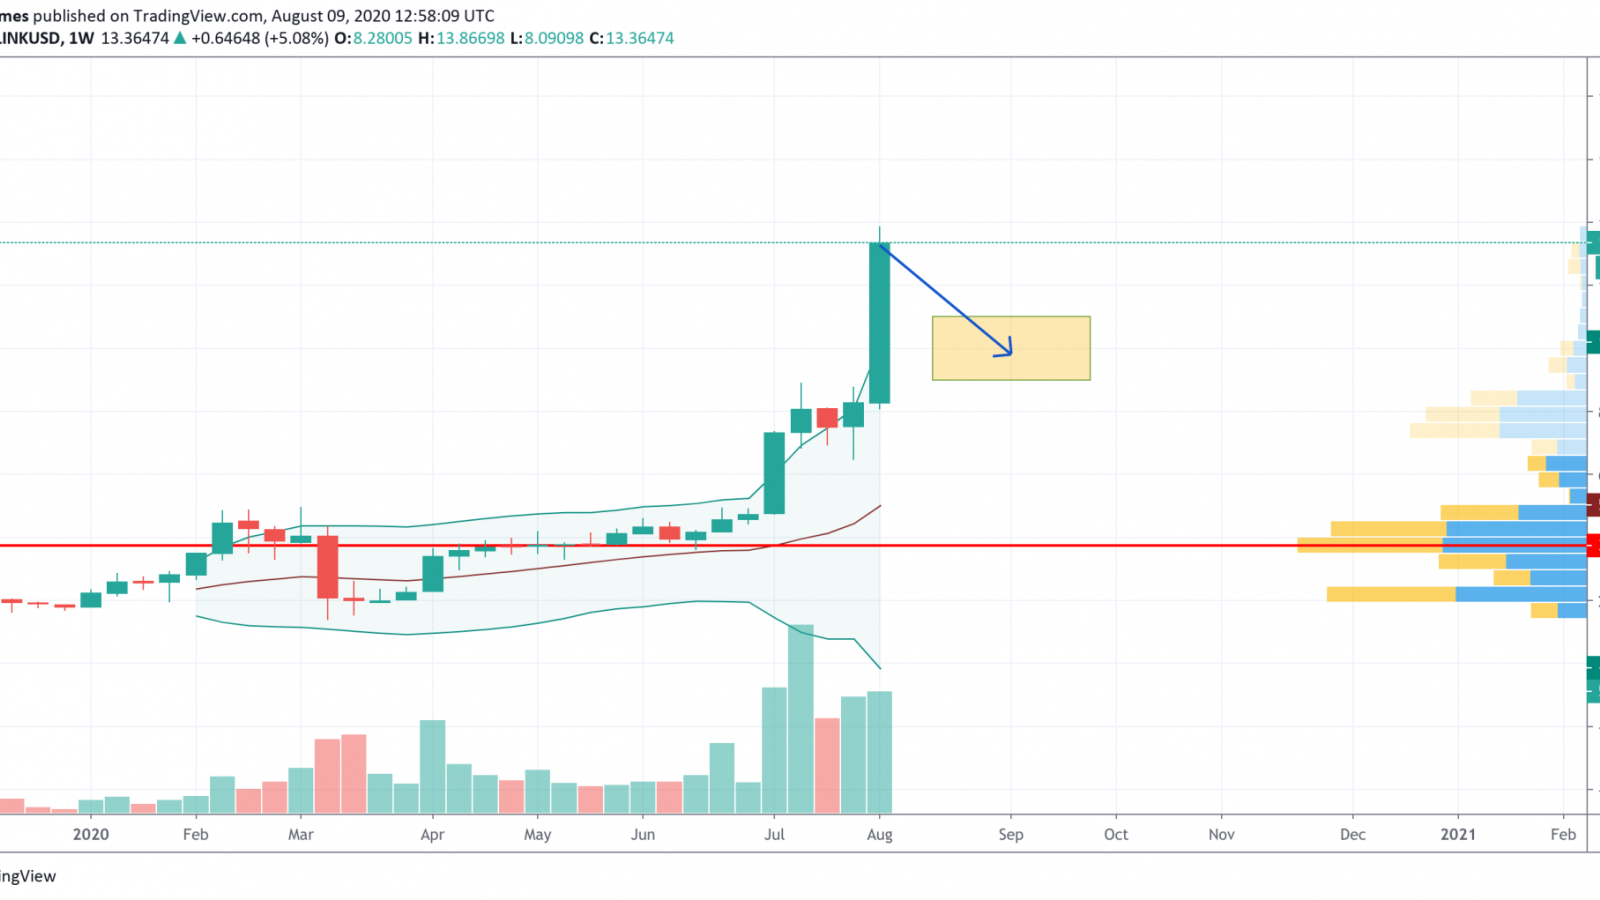
Looking at the weekly chart, the rise has been accompanied by a rise in the trading volume. The bulls have broken all resistance levels; however, Chainlink (LINK) could retest the 'mirror' level before updating the new peaks. This is why the most likely price action is a drop to the yellow range between $9-$11. However, if the bears push it below $9 and fix it at this price, then the bearish scenario will be cancelled.
At press time, Chainlink was trading at $13.34.