
Cardano, one of the top cryptocurrencies, is on the rise. Until recently, it was suffering from the bearish trend like other cryptocurrencies were, but the market seems to be stabilizing. Should we expect any sort of rally? Some TradingView users have a positive answer.
Let’s review a few forecasts for Cardano.
Cardano should hold above the $0.042 level
Cardano’s recent fall caused panic in the crypto community – people started dreading another bearish wave. However, ADA doesn’t seem to be falling further just yet. The user nicknamed Coinkilavuz has analyzed Cardano’s behavior and said that it should hold above $0.042 to reach $0.049 again. Let’s hope this forecast is true.
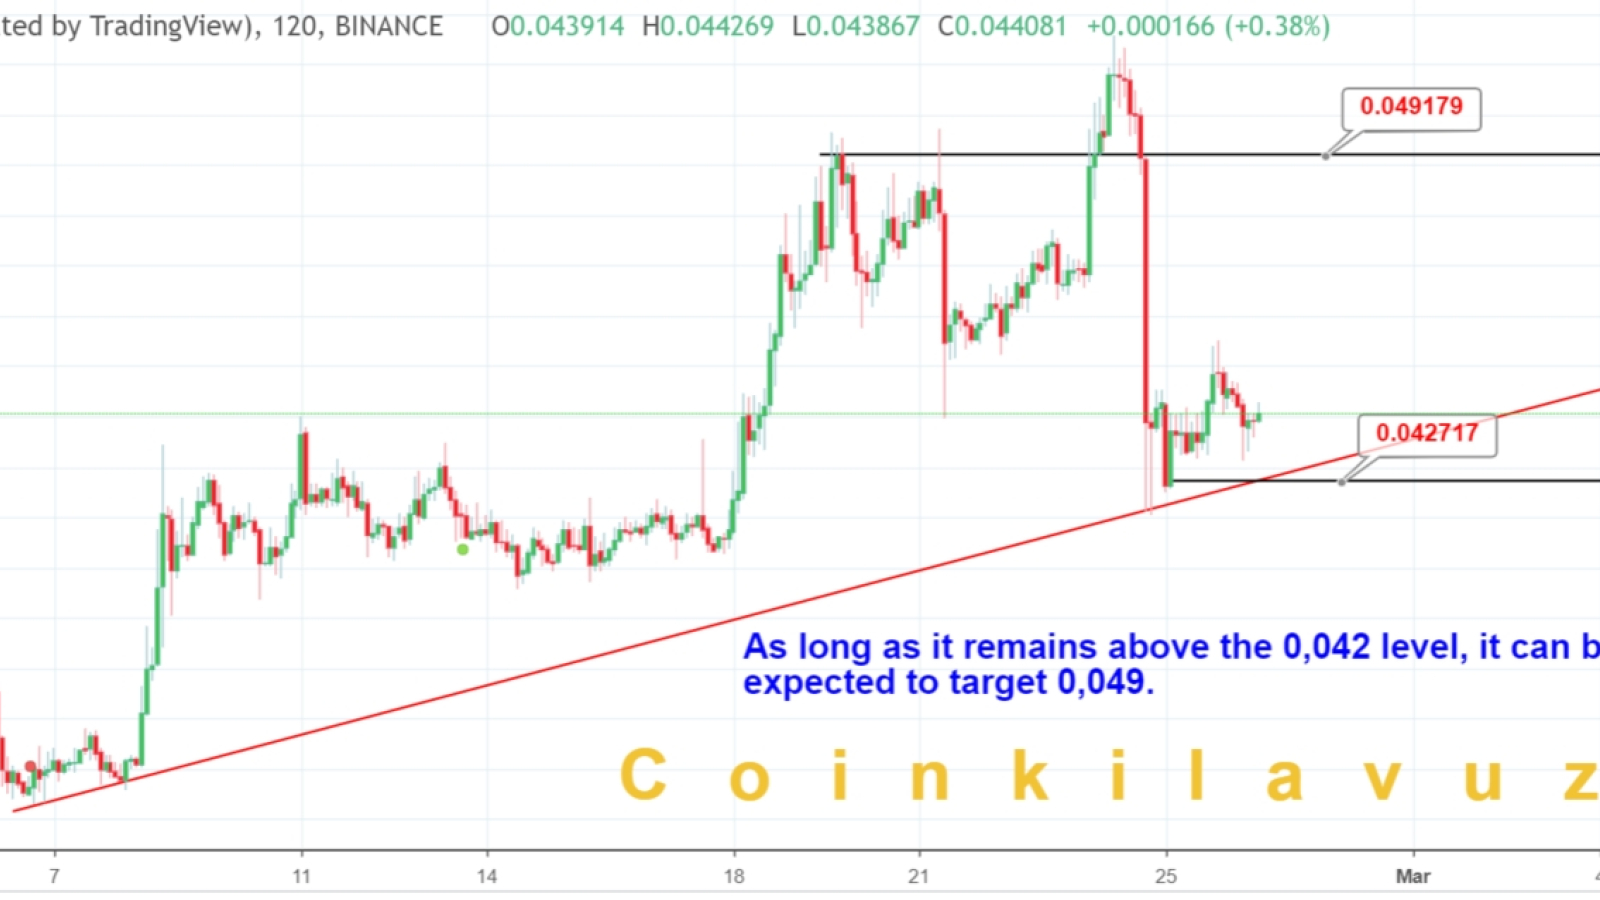
Coinkilavuz Cardano chart on TradingView
Cardano targets $0.08300
User TradingShot bases his forecast on Fibonacci levels. Good news: there’s a strong bullish signal! If we check out all-time highs, ADA/USD was rejected on the 0.236 Fibonacci retracements.
“Last time this level broke the uptrend has been sustained and no Lower Low has been made yet. This is a long term bullish signal.”
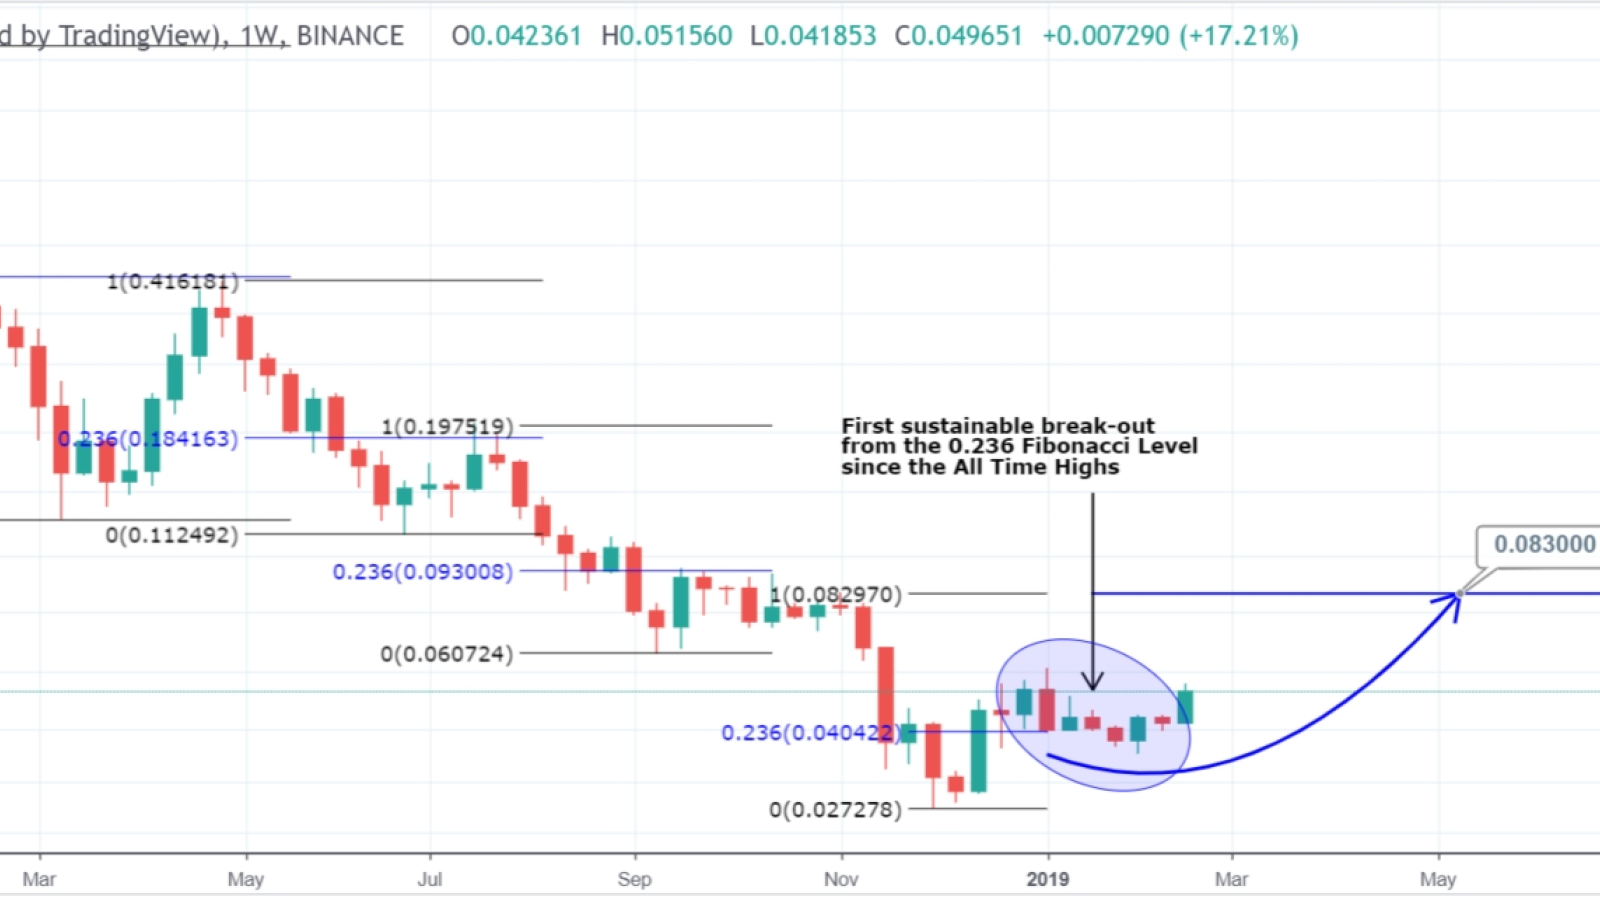
TradingShot Cardano chart on TradingView
Thus, Cardano has to fill the 100% gap left after the last disastrous decline. When might it happen? Judging by the chart, we should wait for new ADA heights in May 2019.
Cardano is through ABC correction
User Stabb presents the Cardano price chart illustrating that ADA/USDT is making an ABC correction. That’s the same thing that’s being formed in BTC development. There’s a higher low for wave B, which is a good sign. So, what’s next? ADA should start growing again. According to the chart, it might reach the $0.06 level by the end of March – even faster than other charts show. Right now, traders have to stay patient.
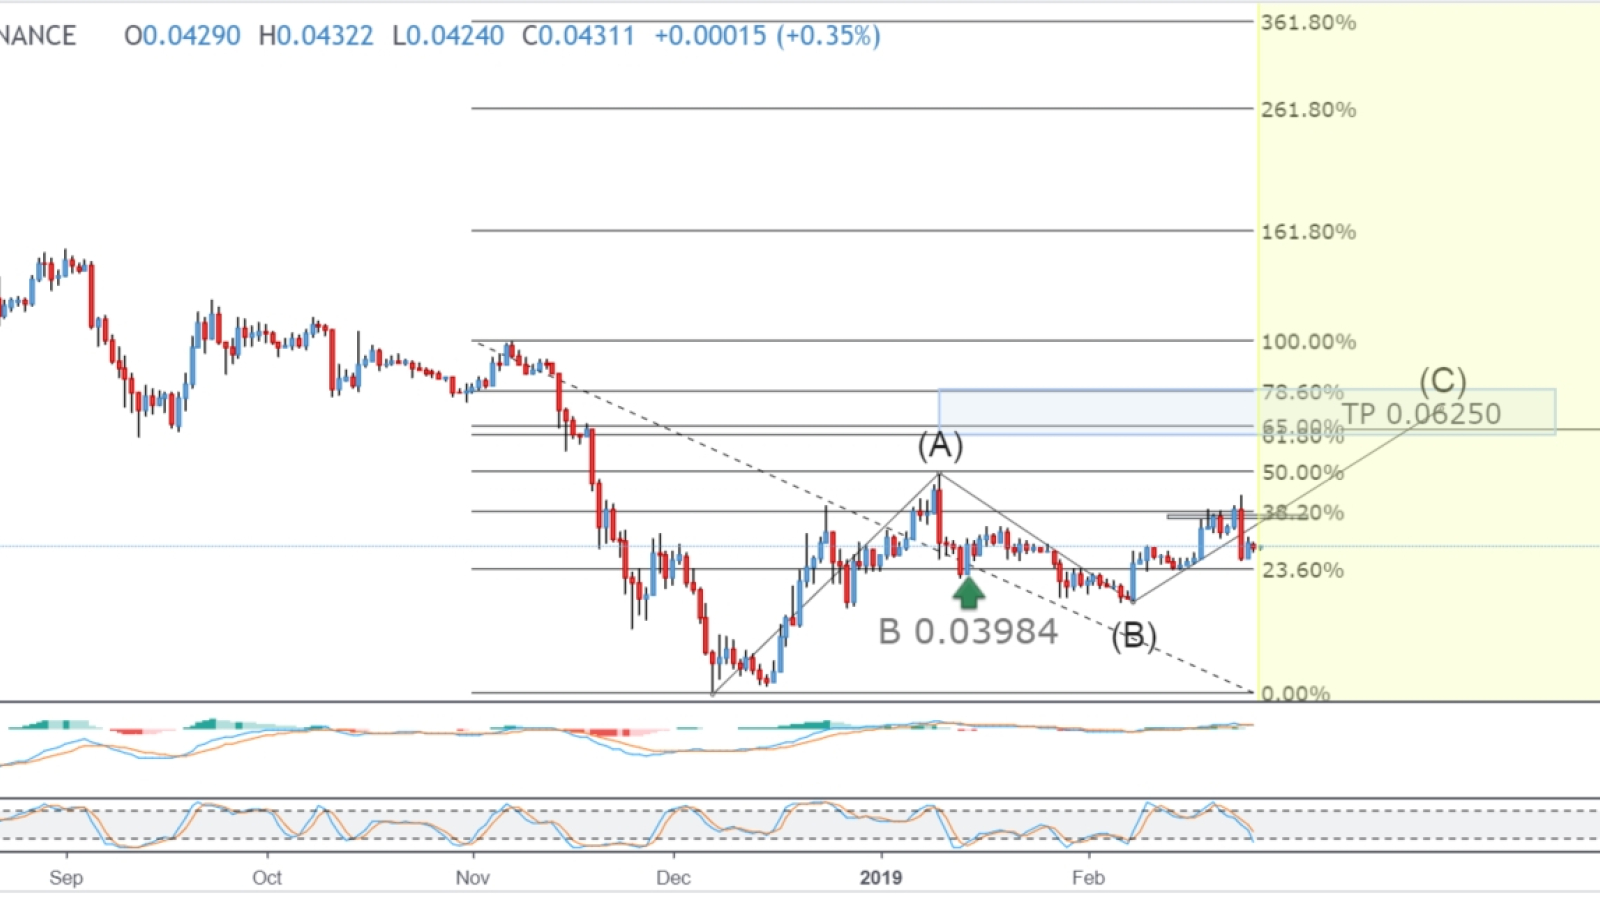
Stabb Cardano chart on TradingView
ADA/BTC is in an uptrend
If you want to invest some BTC in ADA, there’s a golden chance to do so. According to ForecastCity’s technical analysis, the Cardano/Bitcoin pair is about to enter the uptrend. The price has been keeping the 21-Day WEMA, which acts as dynamic resistance. RSI index is 50.
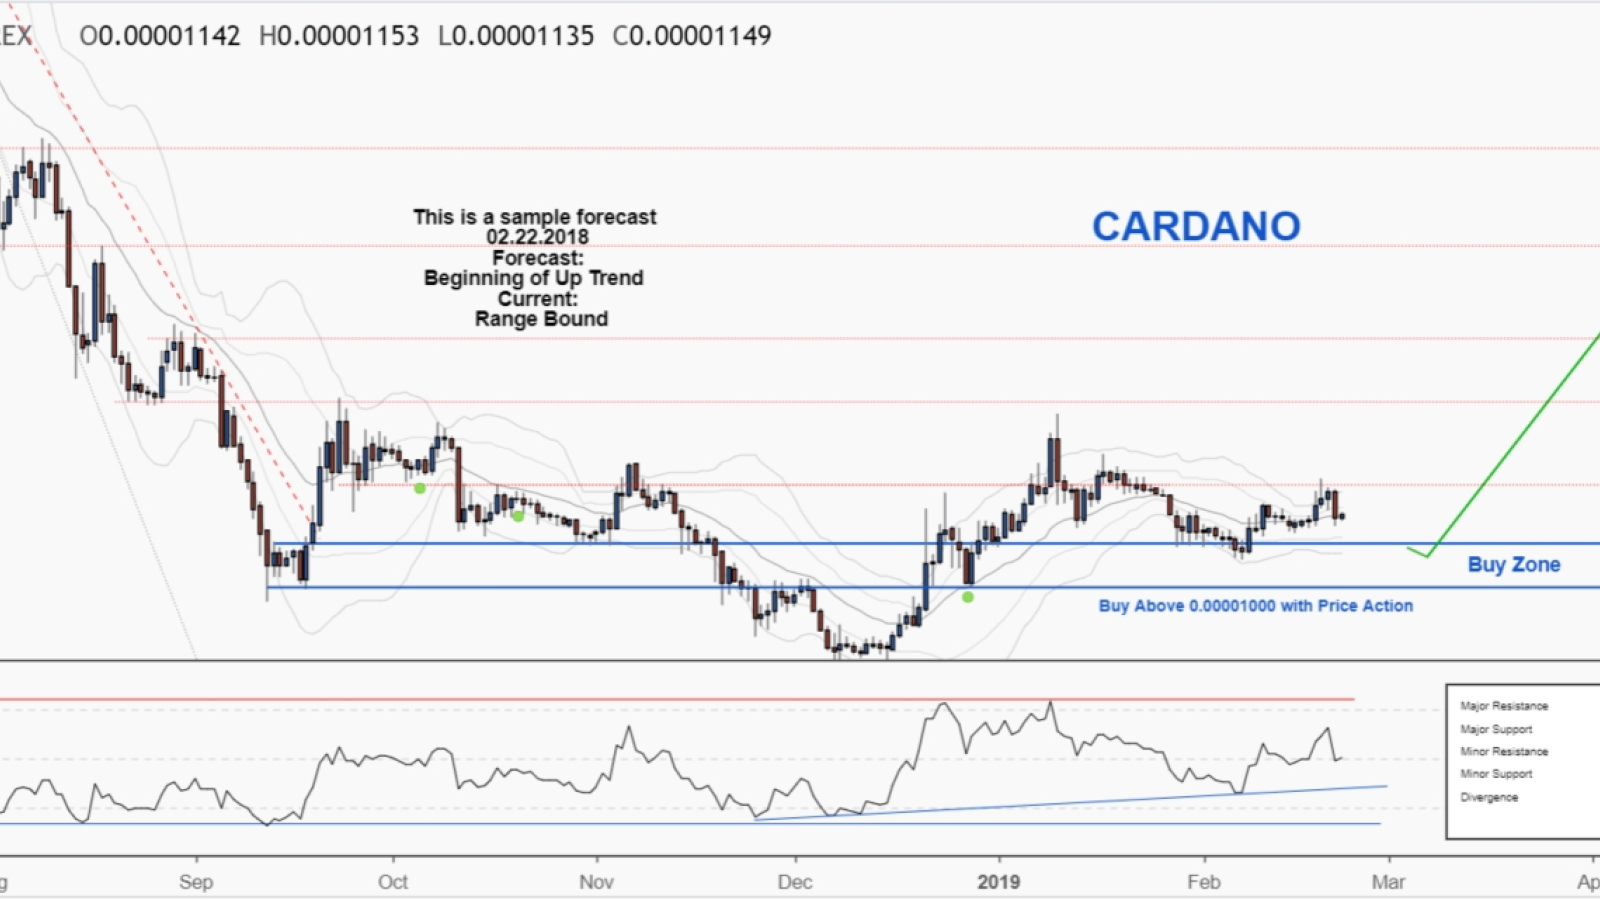
ForecastCity Cardano price chart on TradingView
This means there’s a possibility of ADA’s suggested support zone (0.00001090 to 0.00001000). In turn, traders can make orders based on Price Action and reach some short-term goals. Thus, the entry zone is from 0.00001090 to 0.00001000.
So when you see the price approaching the Buy Zone and forming some of the reversal patterns ("Bullish Engulfing", "Hammer" or "Valley"), it’s time to enter the game.
To keep tabs on the Cardano price, don’t forget to check the ADA/USD Chart by TradingView.
Disclaimer: The opinion expressed here is not investment advice – it is provided for informational purposes only. It does not necessarily reflect the opinion of U.Today. Every investment and all trading involves risk, so you should always perform your own research prior to making decisions. We do not recommend investing money you cannot afford to lose.