

The last 24 hours were as full of exciting events and extreme emotions as an action-packed thriller. His Majesty Bitcoin, accompanied by his altcoin army, attempted to storm the important resistance level for the second time this week, reached $11,070, but unable to get a foothold, was thrown back to its former position. As a result, total market capitalization fell back to Tuesday’s level and is now $445 bln, while Bitcoin dominance reached 40 percent. There are no fundamental reasons for yet another unsuccessful attempt at breaking the exasperating boundary of the descending channel, and the news cycle remains neutral or even positive. But from the point of view of technical analysis, the situation can be logically explained, which is what we will discuss today.
Correlation between Bitcoin and altcoin prices remains strong
Cowardly altcoins, as usual, reacted sensitively to the weakness of Bitcoin buyers and on Thursday we will observe a red colored market. Ethereum is holding up better than the rest, with a decrease of three percent while Bitcoin lost 3.7 percent. The worst off is NEO, with a loss of 12 percent and trading around $125. And don’t say we didn’t warn you, this decline target was described in detail in the Feb. 27 price review. Between the most resistant and the most impressionable asset are the rest of the coins, having lost from five to eight percent on average.
BTC/USD
After breaking through the resistance formed by the convergence of the ascending and descending channels at $10,900, Bitcoin buyers needed to secure the price above $11,000. However, fear and a lack of faith in their own strength led investors to take only a modest profit. In our opinion, this situation could have been avoided, had buyers gathered some strength before the final push. In this case, the rush played a cruel joke on the bulls.
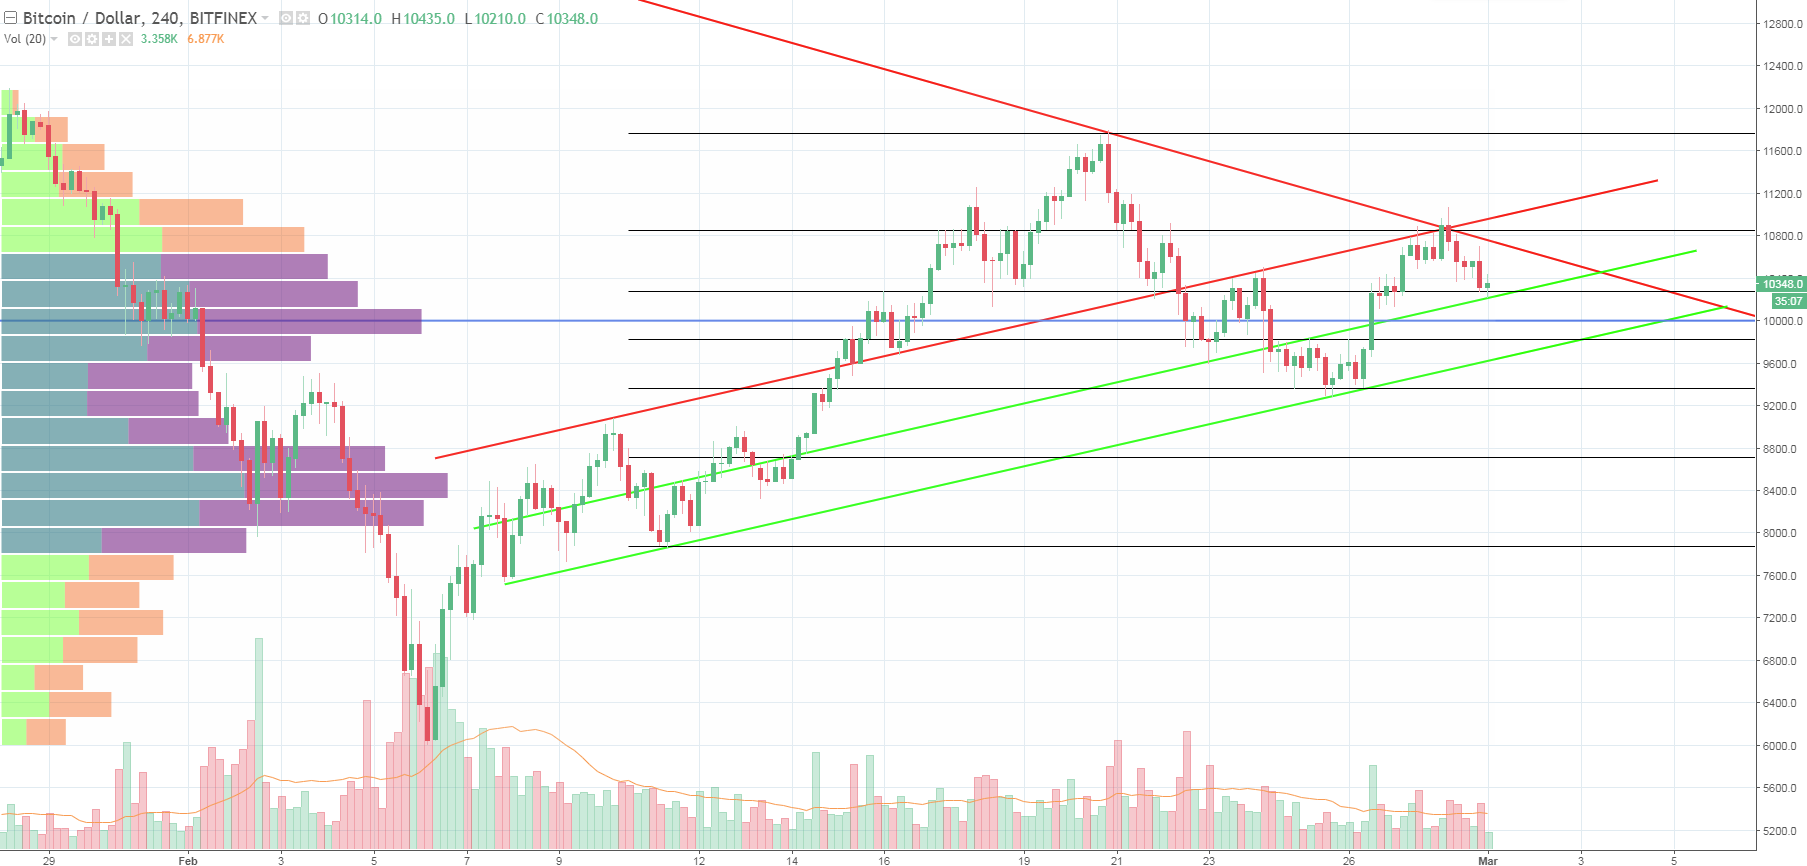
At the time of writing, Bitcoin price is $10,350, and so far nothing critical has happened. The decline was stopped at the boundary of the parallel channel and the 0.382 Fibonacci retracement to the growth wave from Feb. 11. The important mark is $10,000; it’s very undesirable to descend any lower because it corresponds with the mirror support-resistance level and the second largest accumulation zone since the end of January. In case of breaking through it, there is hope for the $9,700-$9,800 range which leans on the lower boundary of the ascending channel and the 0.5 value of the same retracement. Horizontal trading near the current price looks not only acceptable but desirable for the ultimate break through the resistance. At the moment, the scenario of further growth remains in force, but we urge readers to keep a close eye on the indicated support levels.
ETH/USD
Compared to the other altcoins, Ethereum is doing well. The current price is $850, so investors have a $30 leeway before an important support level. Moreover, for now, ETH even continues to move in the ascending channel, although it would be imprudent to pin any high hopes on it. The bulls’ objective of gaining a foothold above the nearest resistance level can be seen on the chart with the naked eye. As soon as they have a proper excuse (in the form of confident Bitcoin growth), the resistance will be decisively broken.
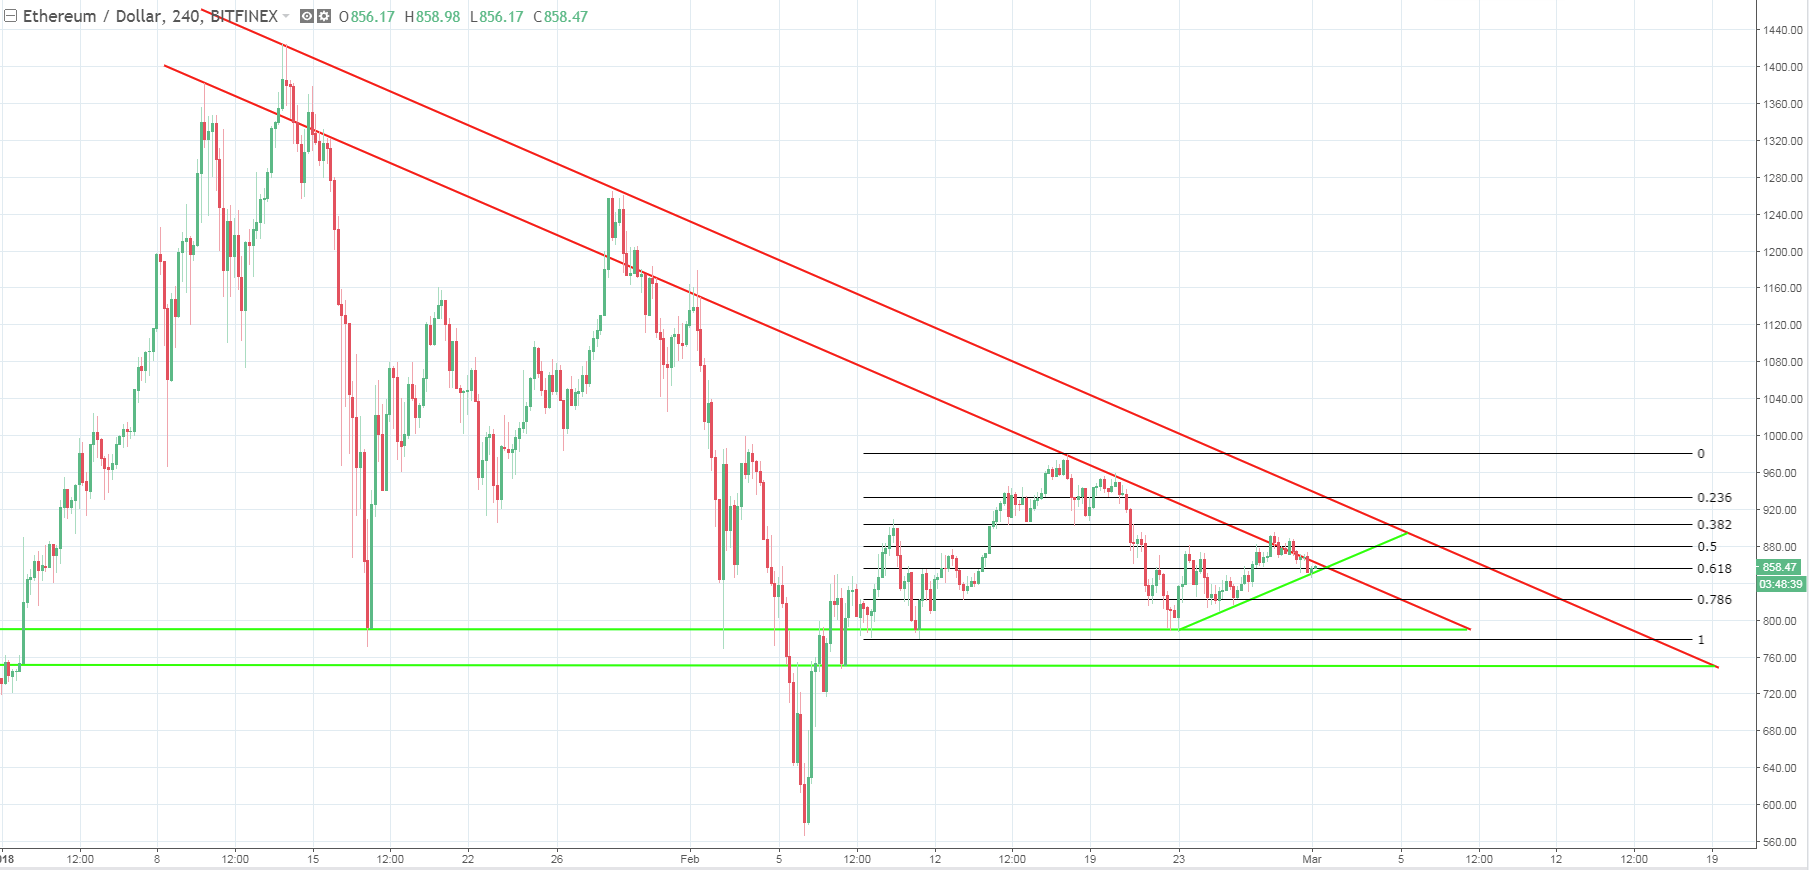
After that, the price will encounter the $900 level, coinciding with the 0.382 Fibonacci retracement, as well as the more global barrier in the form of the boundary of the long-term descending channel from Jan. 13. In the negative scenario, in addition to the already mentioned $820 support, we also take note of the $790 and $750 levels.
ETC/USD
Ethereum’s forefather, his namesake with the Classic prefix, is not doing quite so well. Judging by the speed of new block calculation, the Calisto airdrop can happen as early as March 2 rather than March 5 as previously thought. It’s alarming to see ETC price drop before the event.
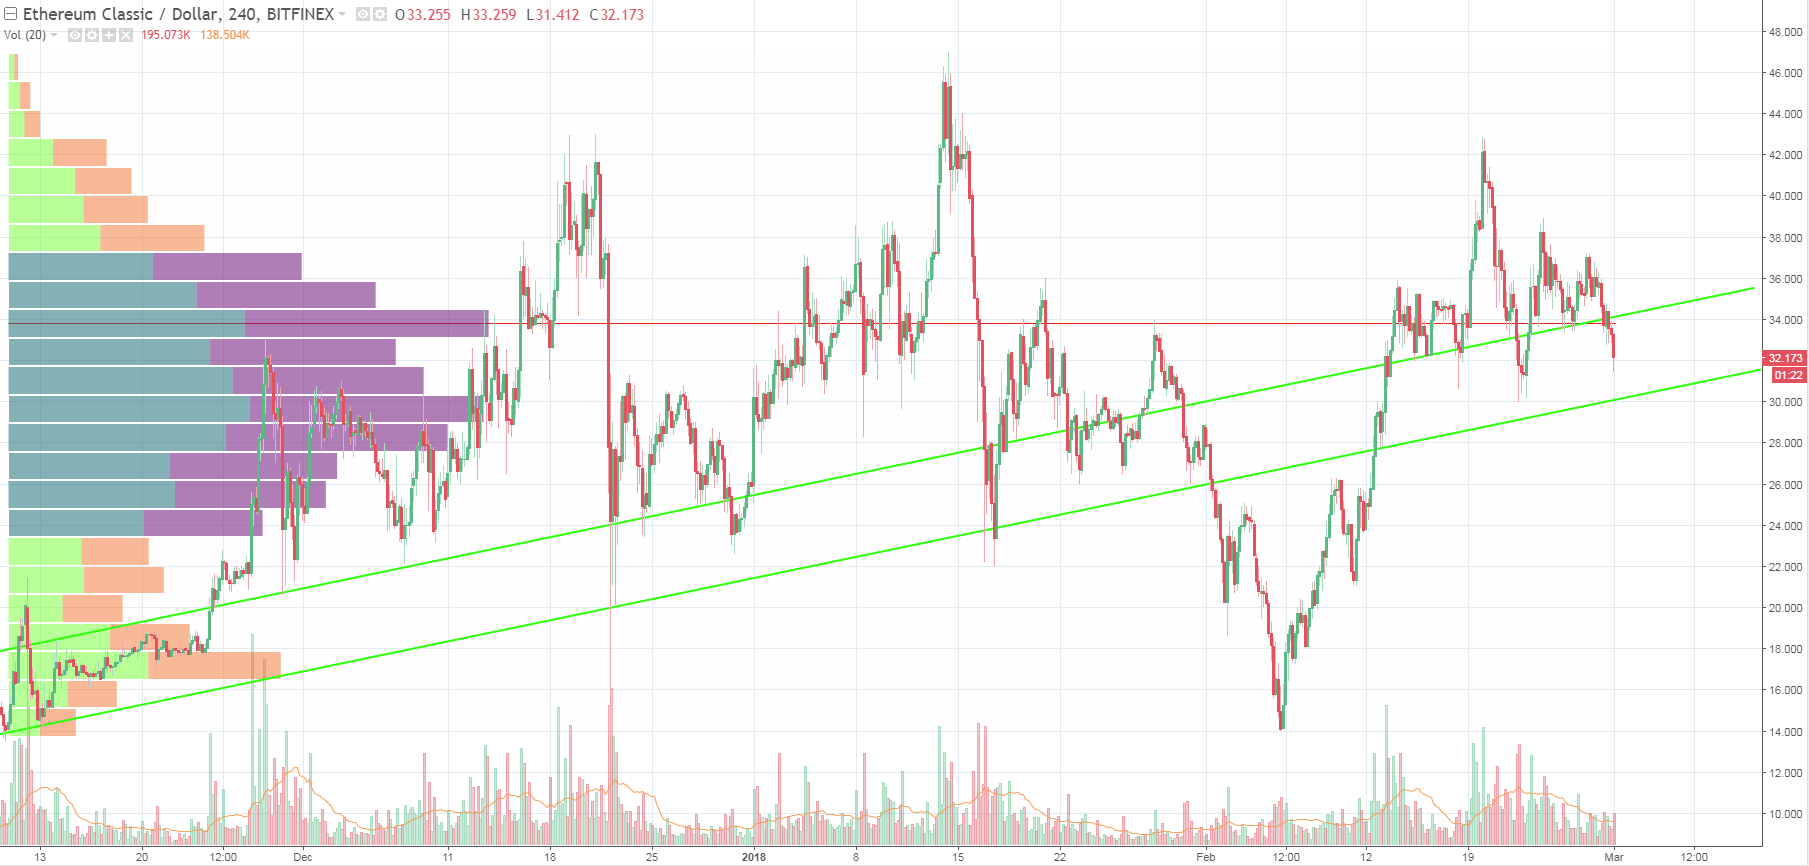
Now the coin is trading near $32, which is below the fair price for the period from Nov. 2017. The nearest support is located at $30 and coincides not only with the psychologically important mark, but also (which, in terms of technical analysis, is more important) the boundary of the long-term mirror level, to which the price was previously sensitive. The next support is at $28. Despite the fact that Ethereum Classic has many more events coming up in the spring, we can’t exclude the possibility of a short-term price reduction after the airdrop. The readers’ trading decisions have to be based on investment objectives and points of entry into long positions.