
On Tuesday, May 14, the cost of the most popular cryptocurrency - Bitcoin has exceeded the psychological mark of $8,000 for the first time since July 2018. The main crypto has updated the 10-month high and reached $8,335 at Bitstamp.
In one month, the price of Bitcoin rose by more than 67.5%, and therefore, technical analysts expected a rollback of the dominant cryptocurrency.
Nevertheless, the strong fear of missing (FOMO) investors in the global market, complemented by a sharp increase in the volume of large exchanges, such as BitMEX, and markets such as CME further feeds Bitcoin bullish tendencies.
Regarding BitMEX, its CEO Arthur Hayes announced a new record of trading volume at the exchange.

Another reason is Microsoft, which talked about the launch of a decentralized identification tool on the Bitcoin blockchain.
Also, in many respects, investor interest in cryptocurrencies is caused by the intensification of the trade war between the United States and China.
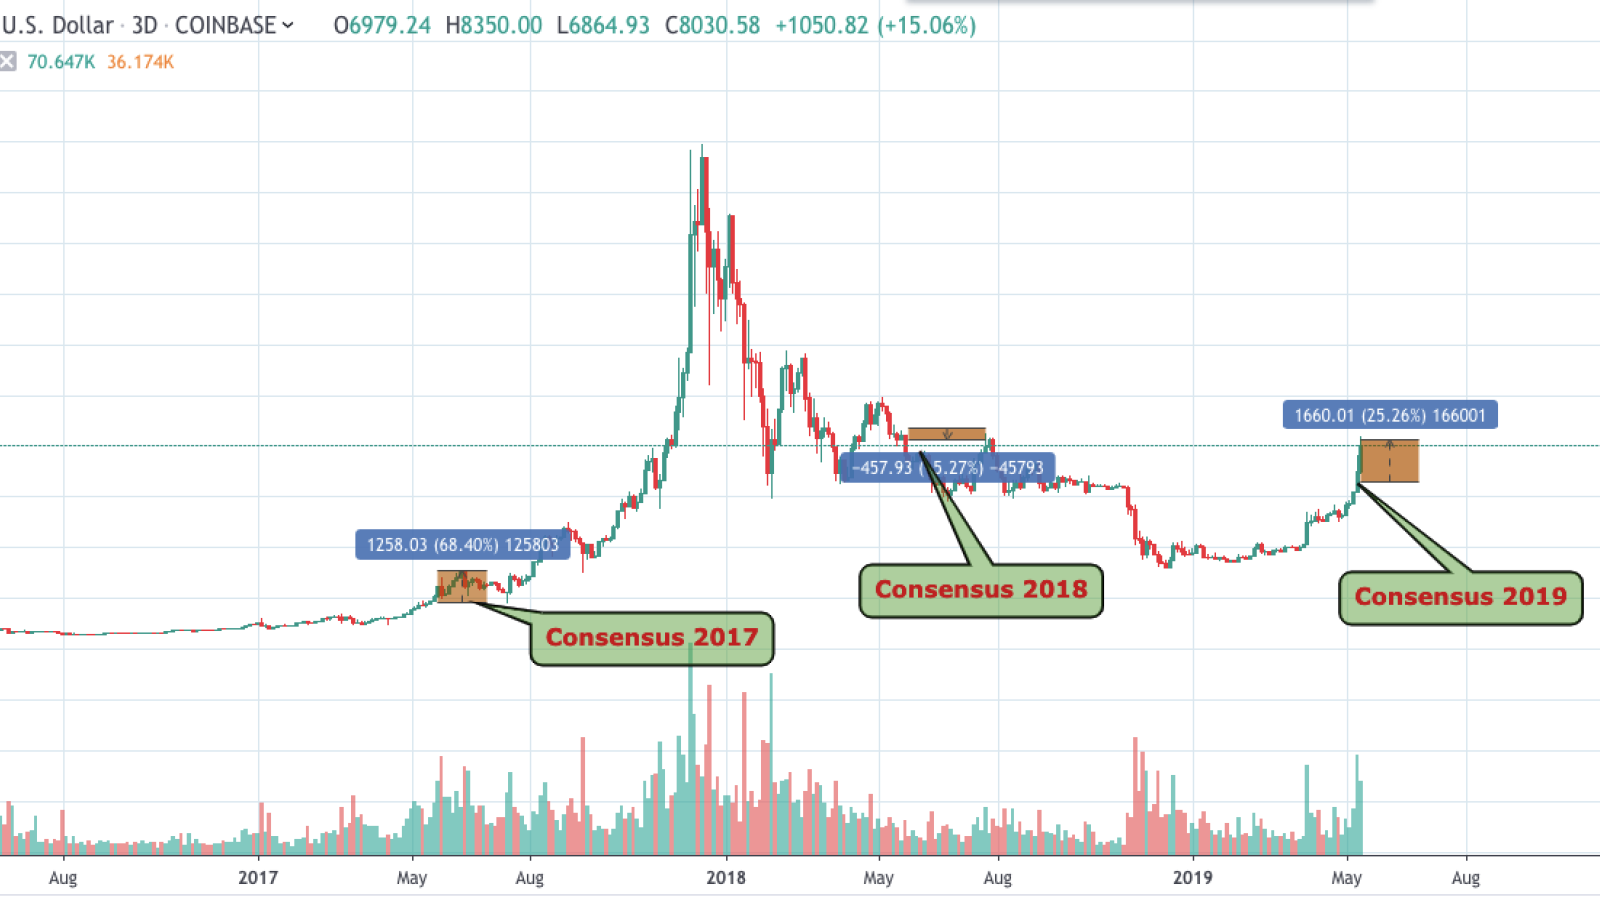
Consensus blockchain conference is another reason that usually positively influences the crypto market (except the previous year).
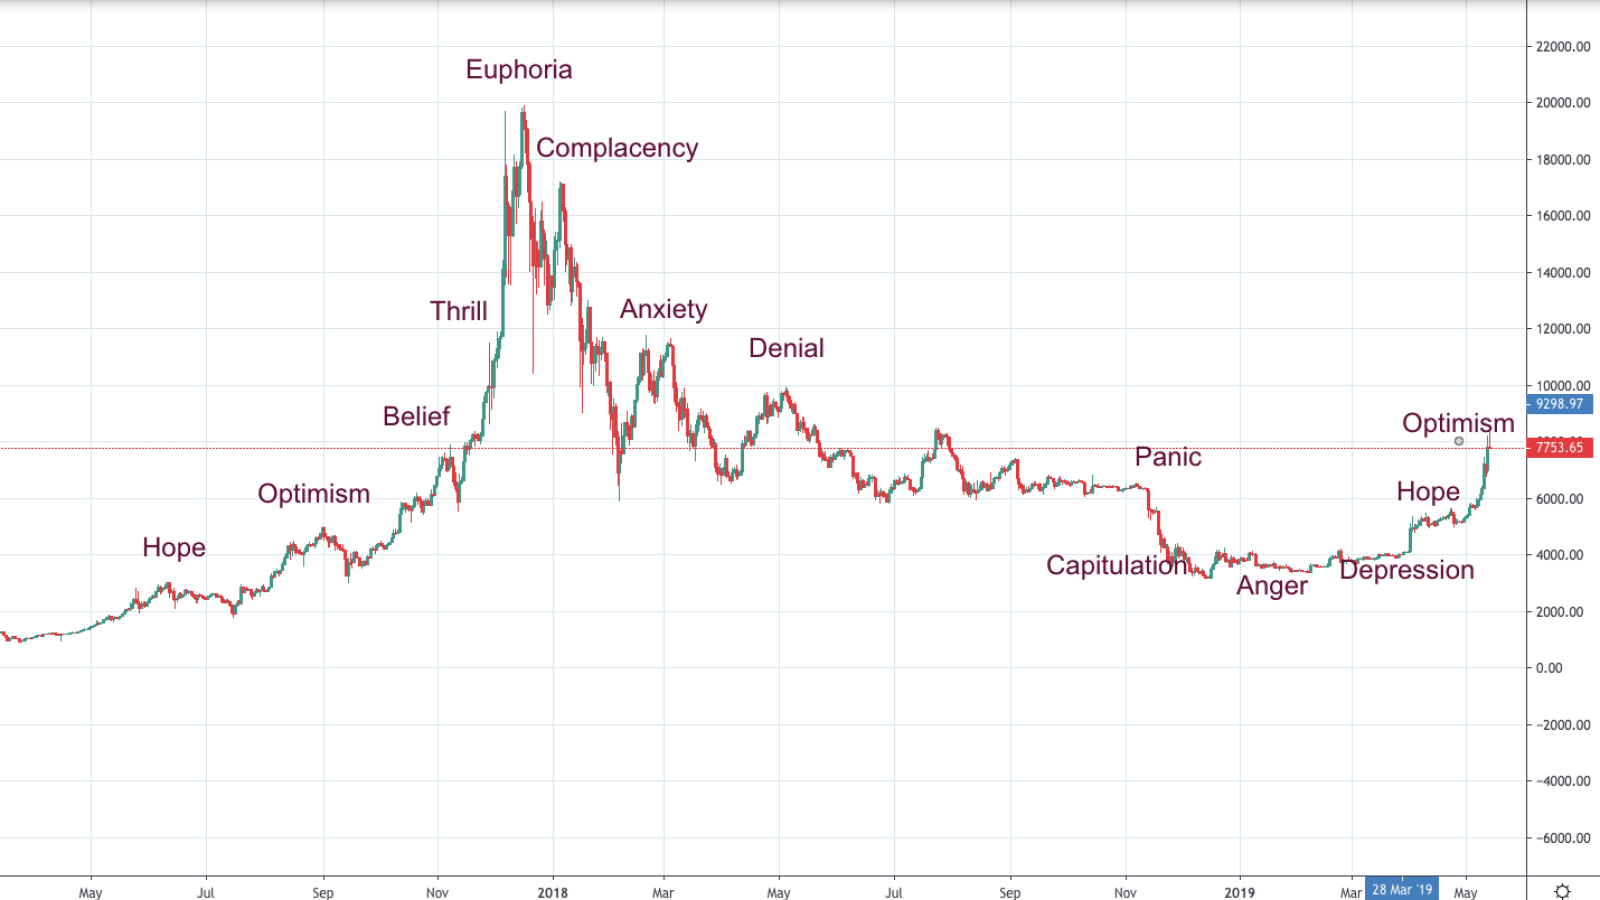
The current crypto market mood may also be described in one graph. According to the chart, the community is feeling the optimism phase now.
Now, we will analyze the technical factors of BTC’s growth.
On the short time frames, Bitcoin is overbought to a certain extent; its quotes are looking down according to the MACD indicator.
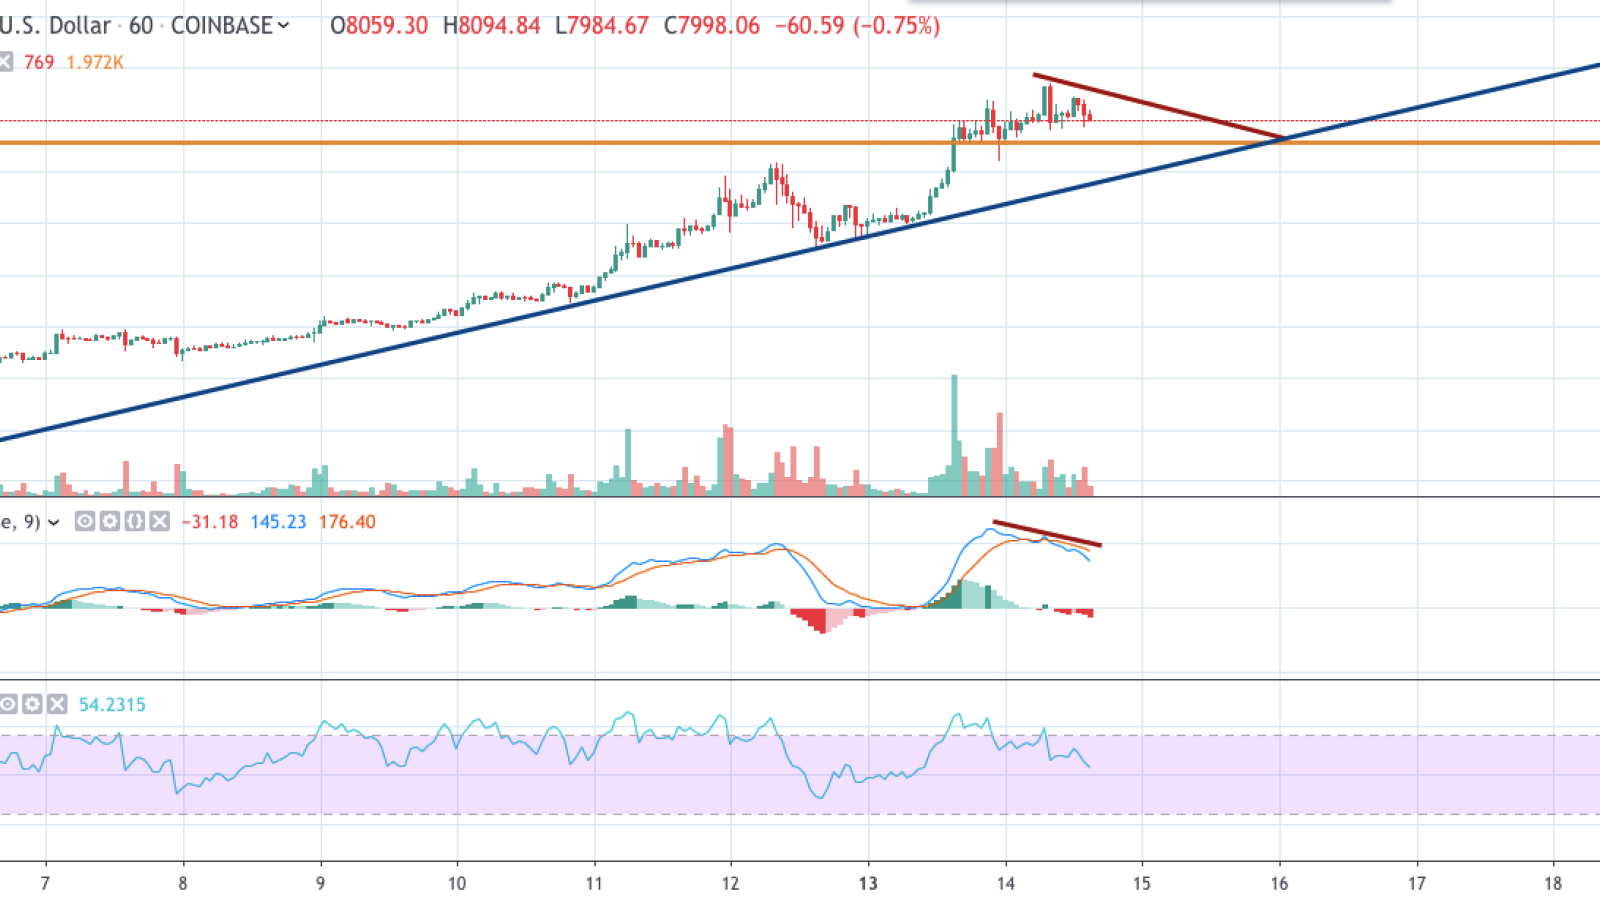
The formation of a Triangle figure is another pattern that shows a possible rollback of BTC to the nearest support level as $7,785. The RSI indicator is between the 50 and 75 points, which is close to the overbought zone. Overall, we should expect a needed correction until the end of the week to around $7,800.
The price of BTC is trading at $7,998 at the time of the writing.