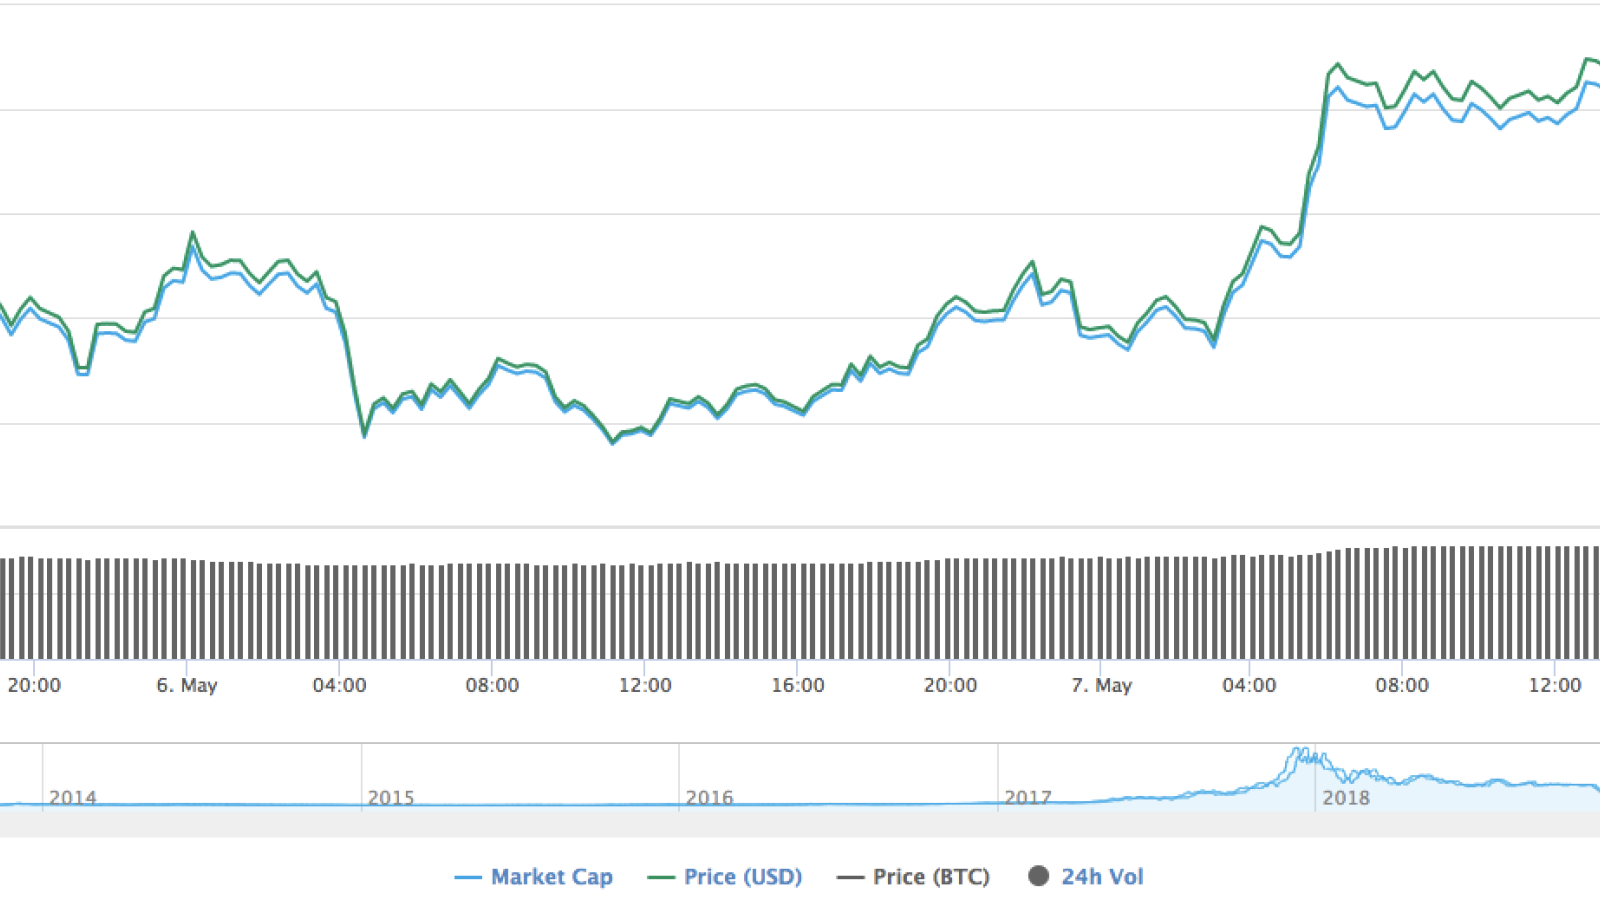
If in all cases, altcoins follow BTC’s example, today’s growth is the exception from the rule, as it is Bitcoin who is chasing after Ethereum's rally.
From a fundamental point of view, it is still too early to sell the leading cryptocurrency, as the Consensus conference is ahead of us, after which Bitcoin is likely to rise in price by a few more points.

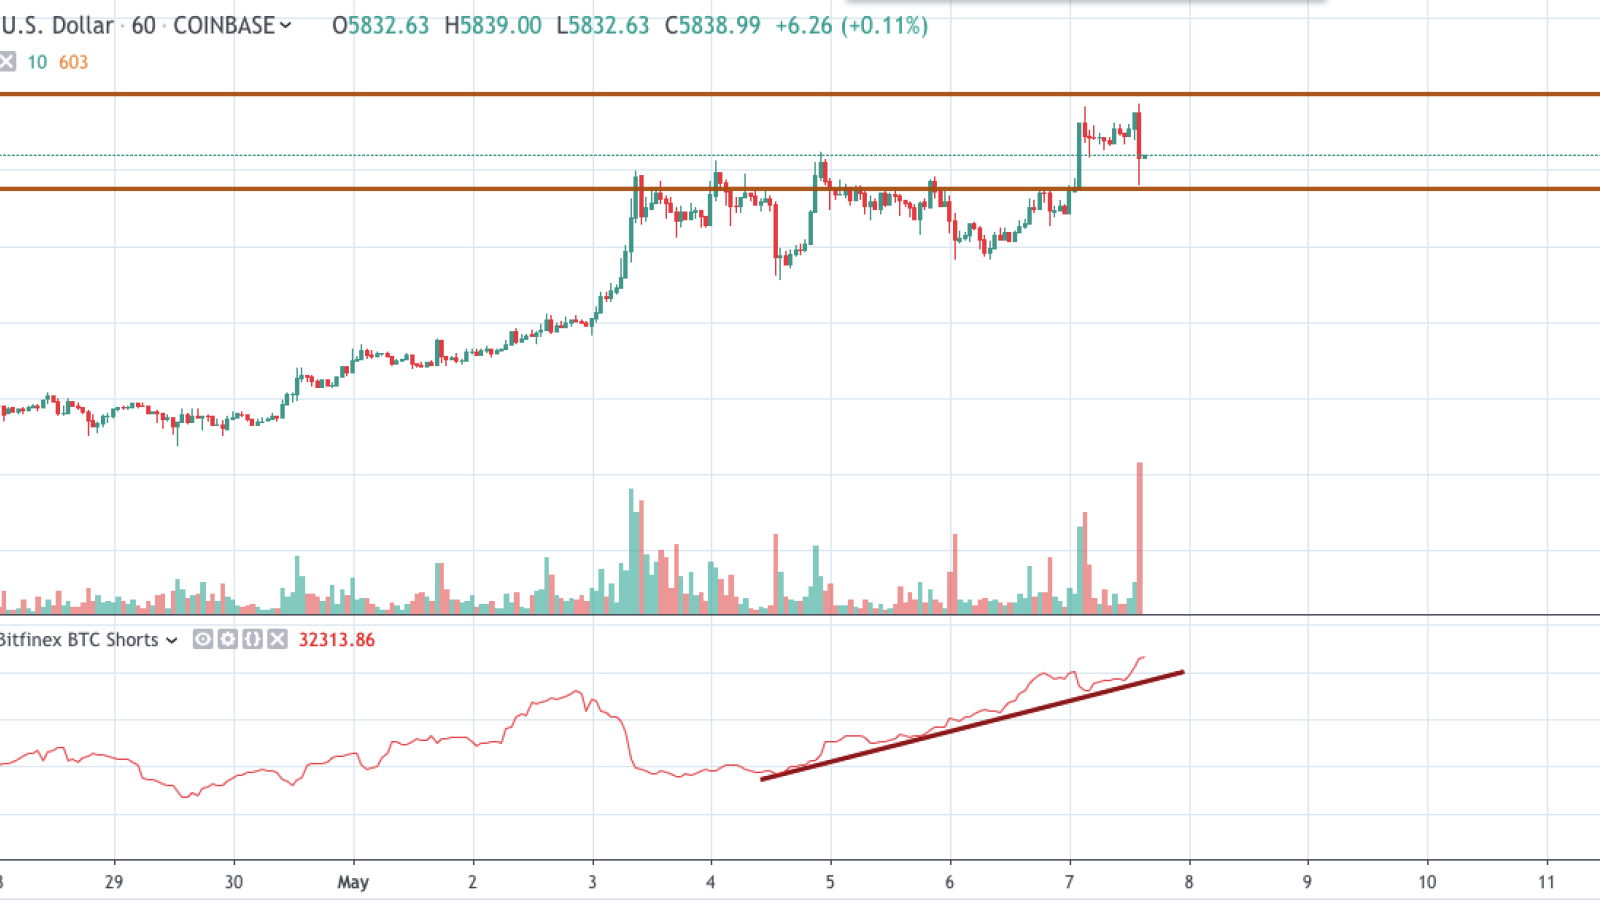
Currently, the rate of BTC is hovering at the resistance line of $6,000. It seems that the cryptocurrency will overcome this mark by the end of the week. Now the bulls are trying to buy off every noticeable BTC pullback, keeping the asset within the ascending channel. In general, the market situation indicates the complete dominance of buyers.
BTC is currently trading at $5,854, and over the past day, the price of the coin has risen by 3.31%.
Our earlier price analysis came true, as the rate came closer to $6,000, and this mark was broken on Binance.

The number of short positions on the BTC/USD pair reached its annual maximum. Last time traders saw so many shorts was in January 2019. If a sudden increase in trading volumes occurs soon and Bitcoin still moves above $6,000, most of the short positions will be eliminated by the exchanges, which will serve as another impetus for growth.
Perhaps the resistance level of $6,000 will be quite difficult to break for the first time. A few months ago, this area kept the leading crypto from a new dump for quite a long time.
In this regard, the asset may correct to $5,750 in a few days.

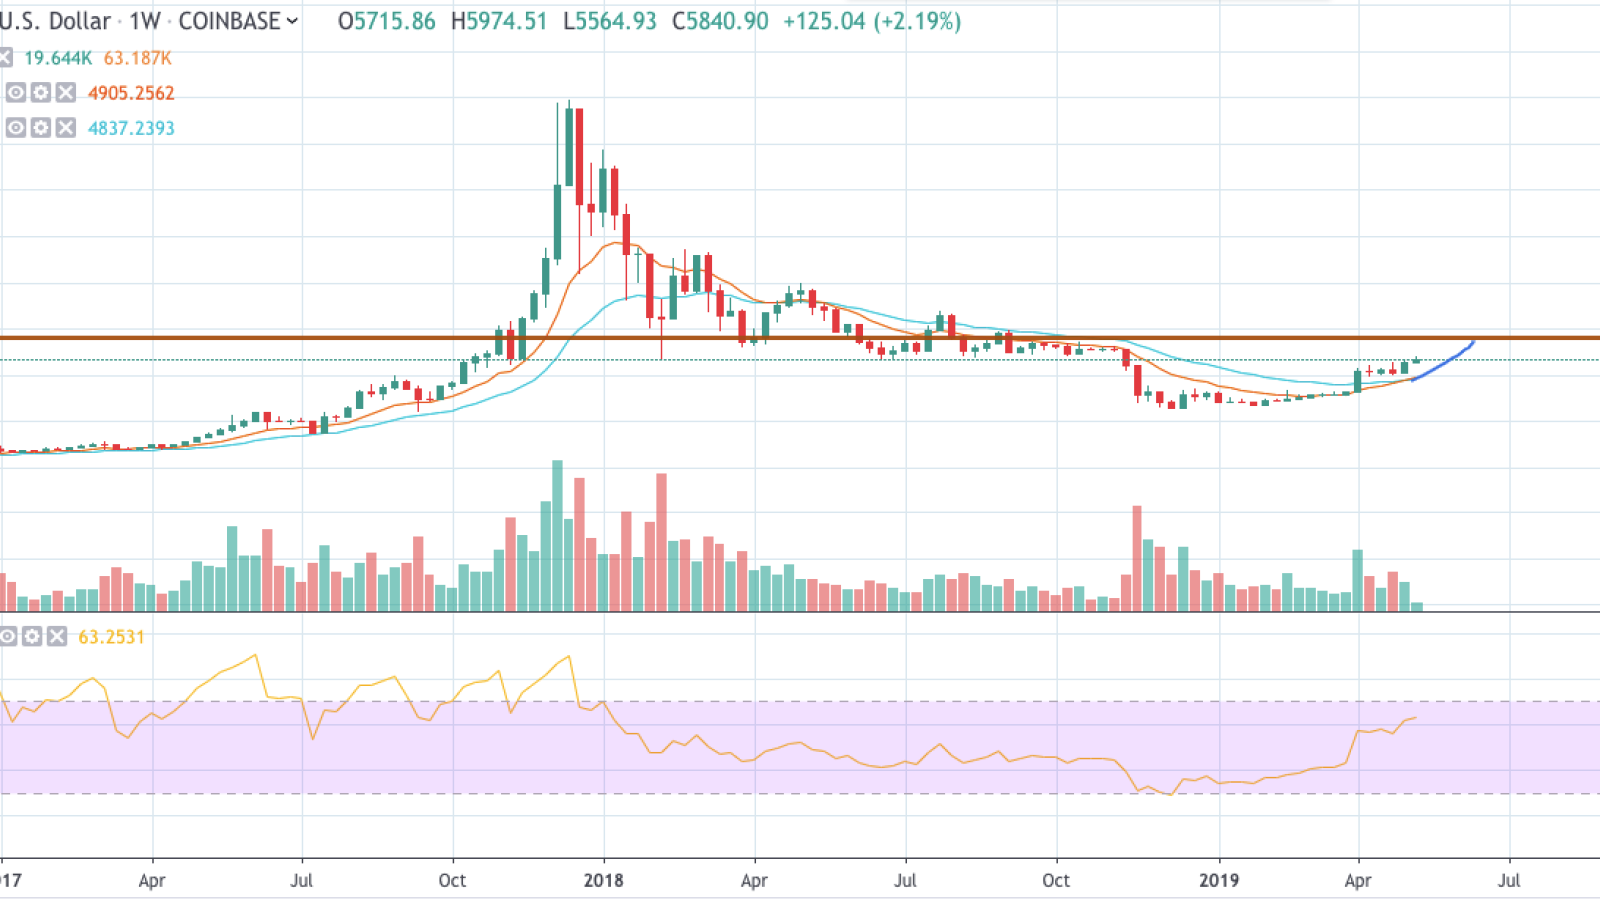
In terms of the 1-week chart, the moving average 12 EMA crossed the 26 EMA and moved higher. This is their first intersection since the start of the 2017 bull run. The RSI indicator has also reached the area dominated by buyers for the first time in over almost a year. Here one can see the emerging global uptrend.
Overall, traders can expect the $7,000 mark in the first part of June.


