*** Please note the analysis below is not investment advice. The views and opinions expressed here are solely those of the author and do not necessarily reflect the views of U.Today. Every investment and trading move involves risk, you should conduct your own research when making a decision.
Bitcoin took down the first obstacle
Yesterday, we got a daily candle closing above the orange line and the 50 EMA. These were the first obstacles to be taken down to climb to higher levels.
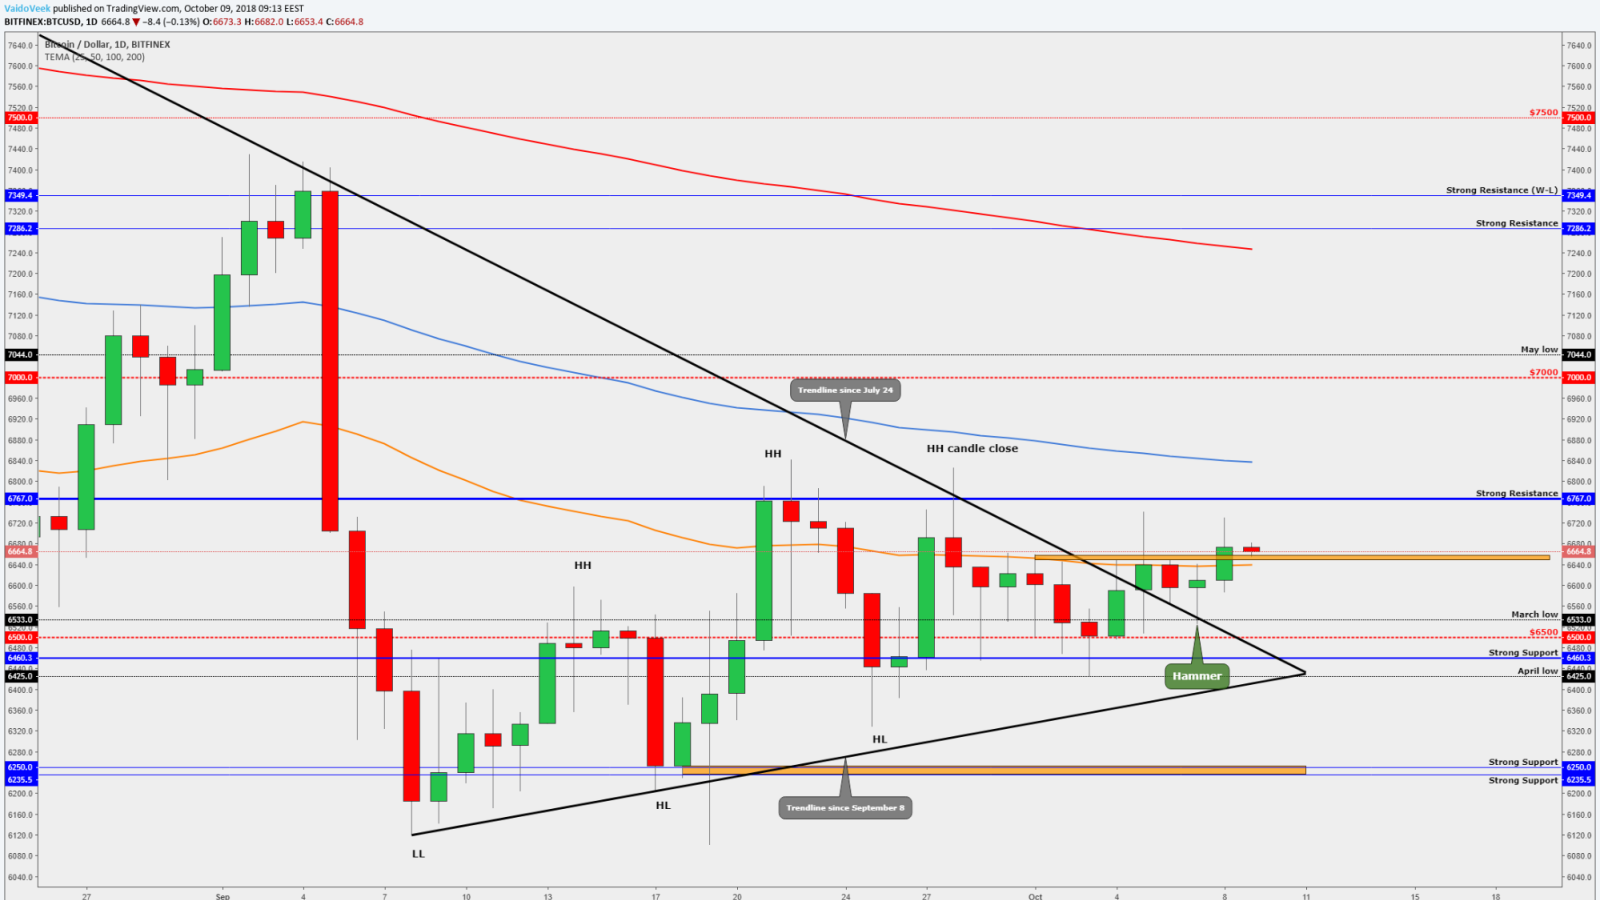
The Hammer candlestick pattern, which appeared after the price bounced up from the trendline after July 24, worked nicely and the momentum guides us through the first obstacles.
Highest October candle is closing at $6,672 and it confirms that the current momentum is bullish.
Currently, altcoins show mixed signs, some of them are on the green side, some of them are on the red. Yesterday’s move through the orange area doesn’t look like a fake action due to the fact that altcoins were also on the positive side. Altcoins follow-up confirms the current momentum on the market is bullish.
CARDANO (ADA/USD) Shows Some Bullish Patterns
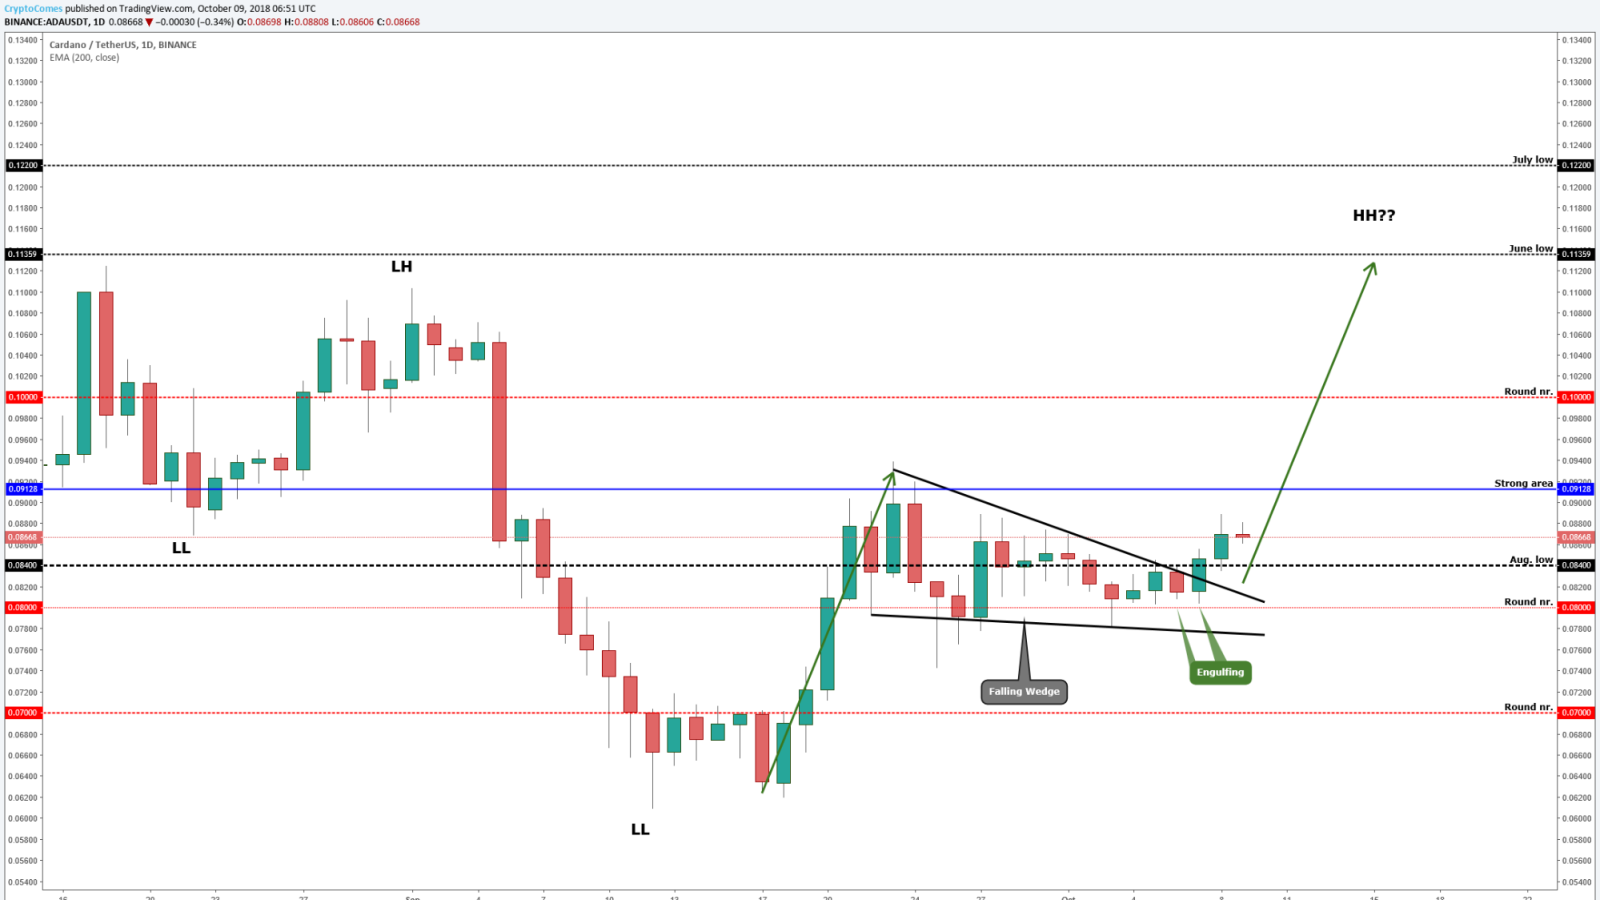
The last two days have been very bullish for Cardano. Here are a few confirmation signs to analyze. The first sign is the continuation chart pattern called “Falling Wedge”. The latest momentum was upward and after that, the price stayed in the consolidation mode (sideways movement). This sideways movement allows drawing the trendlines which will indicate that there is the “Falling Wedge” continuation pattern.
The second bullish sign is a bullish candlestick pattern called “Engulfing”. On Sunday, there was an upward breakout from the chart pattern resulting in a candle close above the August low which worked as a resistance. This candle eats entirely the previous one and thus we see a bullish “Engulfing” candlestick pattern. Yesterday, this bullish momentum continued and we have a breakout from the “Falling Wedge” as a confirmation.
The next resistances are the strong area around $0.091 and the round number $0.1. Those were the major resistances before we could see the major target area around June low at $0.113. In this area, we should make a big price structure change an HH (higher high).
The target area is coming from the chart pattern. The target has to be of the same size as the “Falling Wedge” ‘pole’.
So, if the price reaches into the mentioned resistance area you will have to see what Bitcoin does and read out some price action from the ADA chart.
ETHEREUM (ETH/USD) Is On The Mixed Area
Ethereum is on the mixed sings area. What does it mean?
We have several bullish signs and some bearish signs, too.
Let's start with the bullish ones:
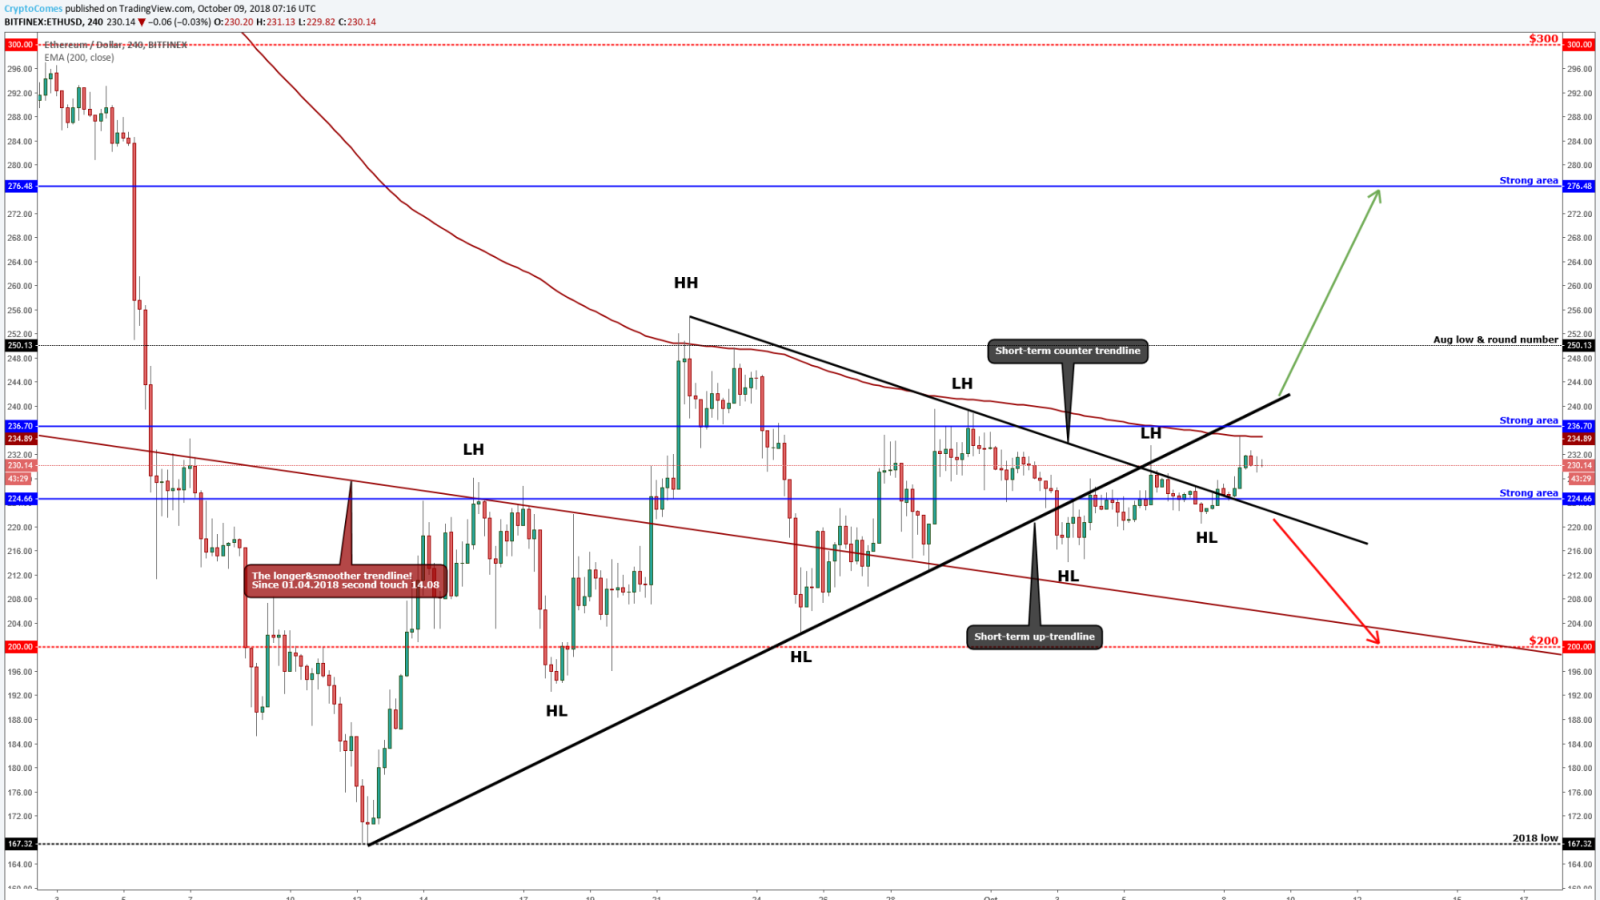
- The Ethereum price still makes perfect higher lows (HL) which will indicate that the upwards momentum is on the chart. It means that buyers are earlier on the market and it makes those lows higher, they just don’t want to see lower prices.
- We have a breakout above the short-term counter trendline. Since Sept. 22, ETH has slowly moved downwards and it has made lower highs. Yesterday, however, it made a confirmed break above this trendline which indicates that the bullish momentum may continue.
Bearish signs are as follows:
- The price is still below the short-term upwards trendline. Yes, it makes higher lows but the strong momentum has gone, though we slowly start to pick it up again.
- The price is still below the 200 EMA and strong resistance. The resistance, a short-term upwards trendline and the 200 EMA make a crossing area. To see a powerfully bullish Ethereum, we have to break down this crossing area but it’s difficult: several price action criteria match each other in one price level and, as you know, those levels are very hard to beat and it takes a lot of power.
So, both resistance and support are strong (the support consists of the strong support (a blue line), the short-term counter trendline works as a support). A breakout from either of the blue lines will guide us to the next move.