

Disclaimer: The opinions expressed by our writers are their own and do not represent the views of U.Today. The financial and market information provided on U.Today is intended for informational purposes only. U.Today is not liable for any financial losses incurred while trading cryptocurrencies. Conduct your own research by contacting financial experts before making any investment decisions. We believe that all content is accurate as of the date of publication, but certain offers mentioned may no longer be available.
Bitcoin doesn’t hurry to recover from the bearish period that started a few weeks ago. Instead, it touched the $7.8K level recently and stayed around $8K. What to expect from BTC in October? This BTC price prediction from TradingView will help you understand.
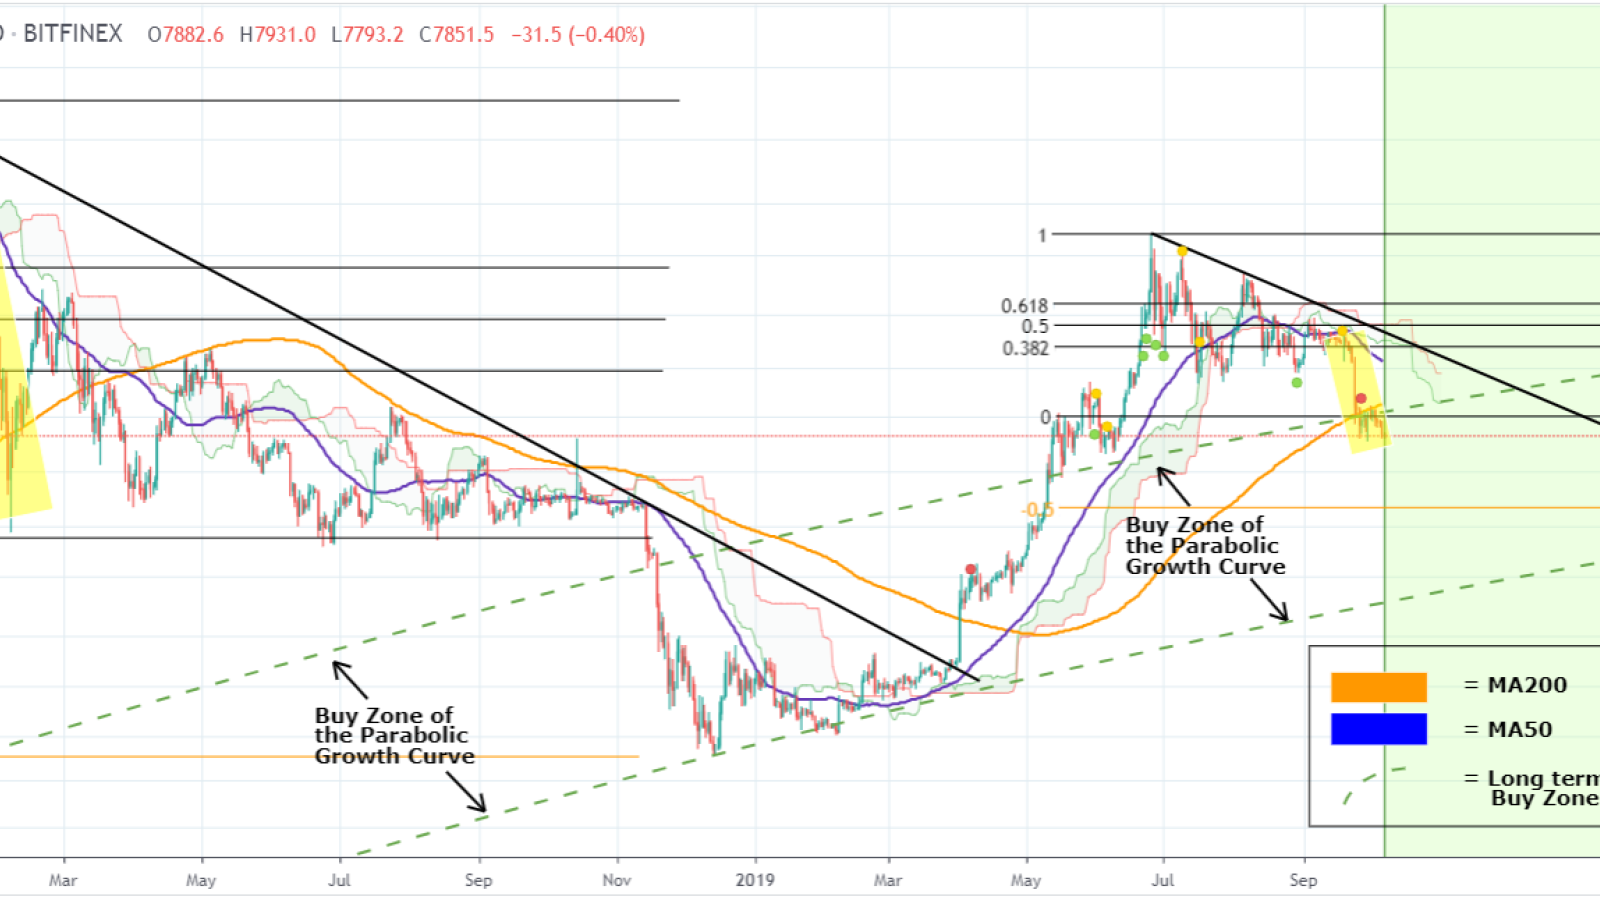
We can see Bitcoin entering the Buy Zone of the Parabolic Channel, which is a potential Buy Signal near $6,500 relative to the price action of the 2016 Bull Cycle. Now, let’s focus on the more recent price action and what is more relevant than comparing the current bearish channel to the 2018 bear market. The comparison alone can only offer us a certain degree of reliability as the current one is only a pullback within the new 2019/2020 Bull Market while the former is a whole Bear Market of its own. However, in combination with the previous BTC analysis on $6500, it provides us a very useful insight.
Let’s see what the outlined patterns have in common:
-
Strong rejection from the 1D MA50.
-
First time crossing below the MA200 (after a multi-month period)
-
Lower Highs forming a bearish channel.
-
Ichimoku Cloud indicating there is one last dip to expect.
-
Both completed a full (0) retrace on their Fibonacci scale with that MA pull back.
If the current one ends up as the 2018 bear cycle, we should see the entire sequence on a -0.5 Fibonacci extension. That places the potential bottom at $6,400 which is currently in the middle of the long term Buy Zone of the Parabolic Growth Curve.