
Bitcoin has entered the bearish zone and traders are guessing when it’s high time to enter the market. Want to join their rows? Find out what to expect from BTC in the nearest days – read Bitcoin price predictions from TradingView experts.
BTC will dip before the push
Since it’s difficult to predict the short-term BTC fluctuations, the best strategy now is to stay away until the situation gets clearer. If you prefer holding BTC, now you just have to find the best moment to charge more the bag.
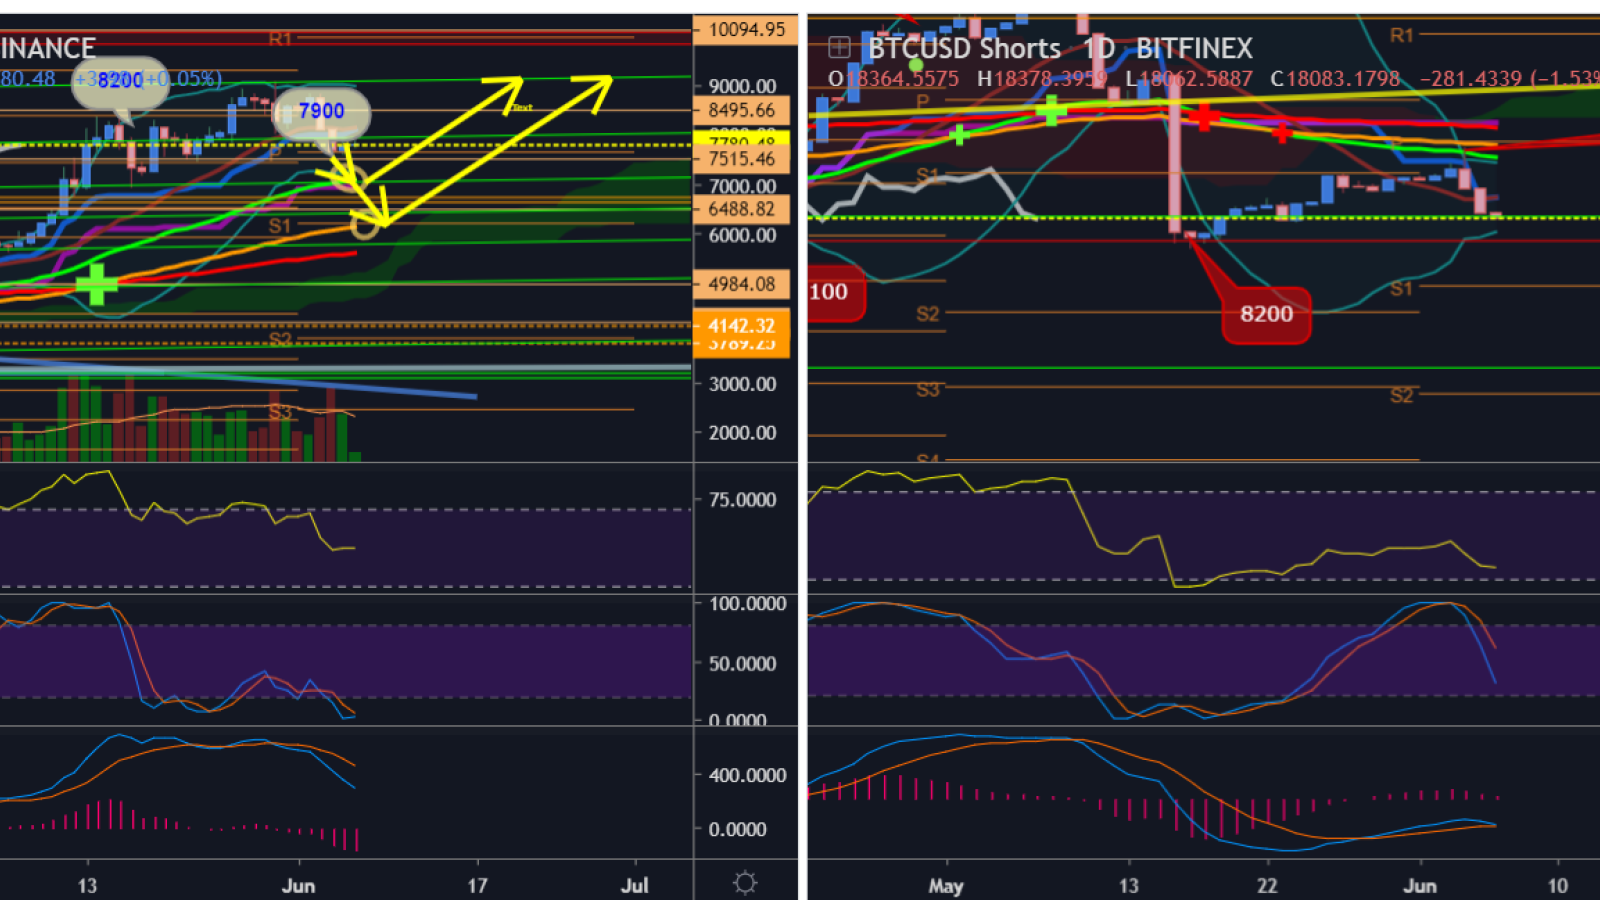
In order to predict Bitcoin’s future, we should analyze its past. When BTC reached $8,200, shorts went down as you can see a long red dip column. After that shorts started to go up again but longs were stronger so BTC continued is push to $9,000.
A few days ago, we saw that BTC dipped to $7,600 area and shorts pushed up. So right now we can see that BTC Pushed a bit back up to $7,800 area but Shorts are almost down and ready for a next push up.
What does it mean? If shorts dip down and BTC go up a just bit, they will attack to push up again BTC will down again. If you see shorts breaking up the 3 EMAS (Red 200D, Orange 100D, Green 50D), it’s not good and it could mean that we will go down more, but for not they got rejected and fall.
Now, the interesting Areas are on EMA50 and EMA100, where BTC can get a Strong Bounce from $7,000 area if it passes down EMA50, would mean have to wait for $6,000 Area to bounce back from EMA100.
The next bounce should push BTC around $9,200.
BTC goes through waves pattern
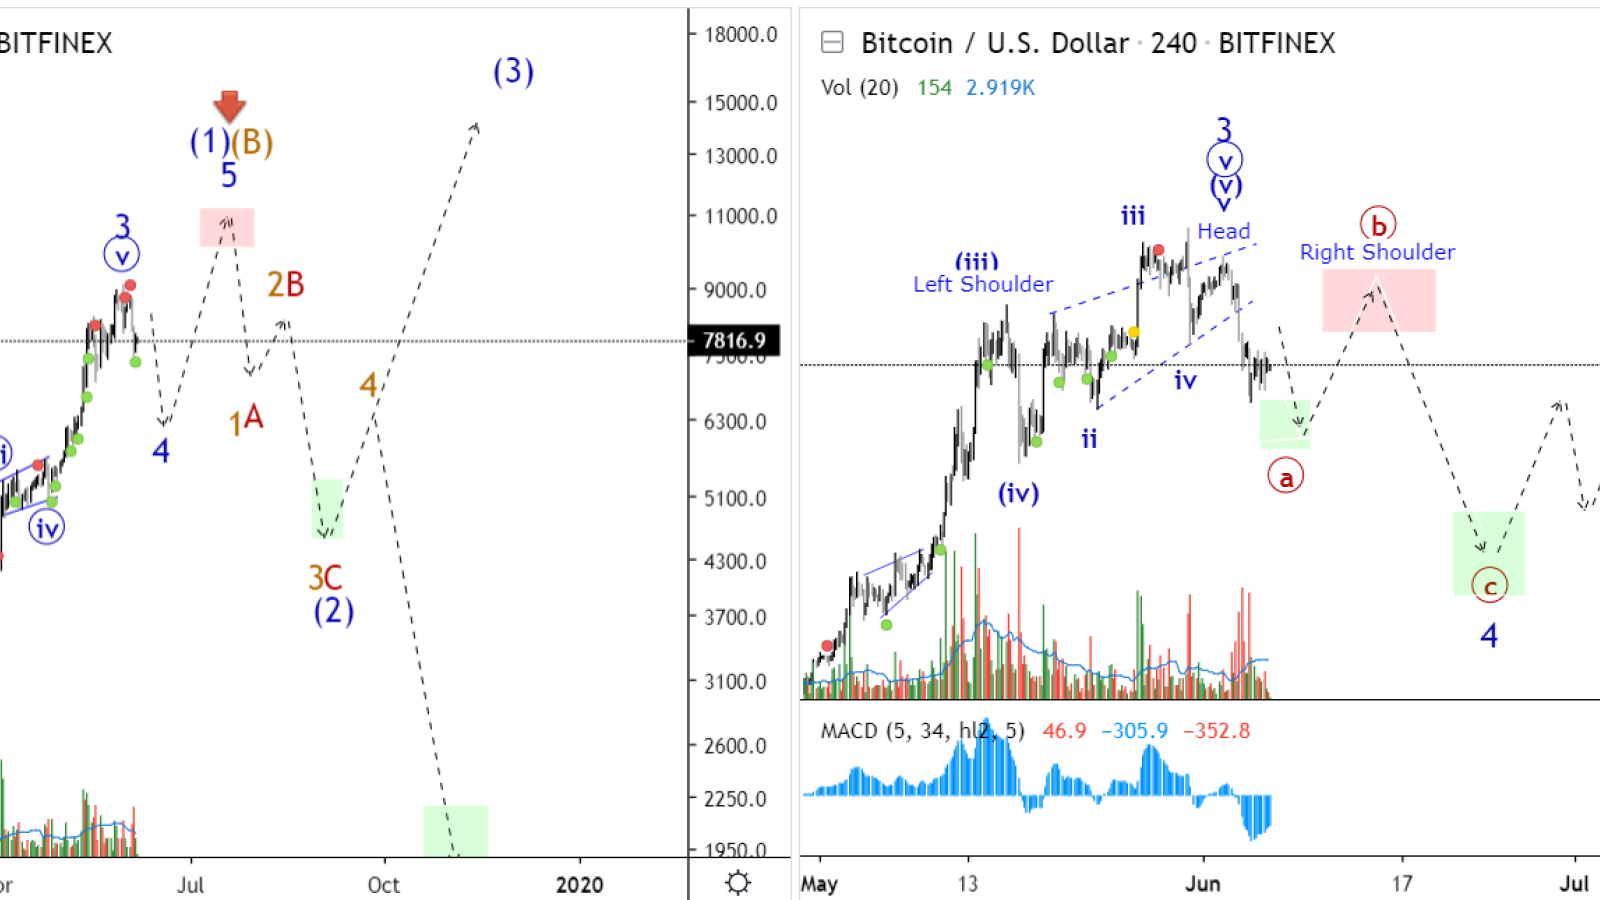
QuantumHF team expects the completion of the local downward movement and the beginning of the restoration of prices in the right shoulder. Thus, you should consider buying Bitcoin in the range of $7,400-7,200 in order to sell above $8,000 in the near future.
BTC will enter the correction zone
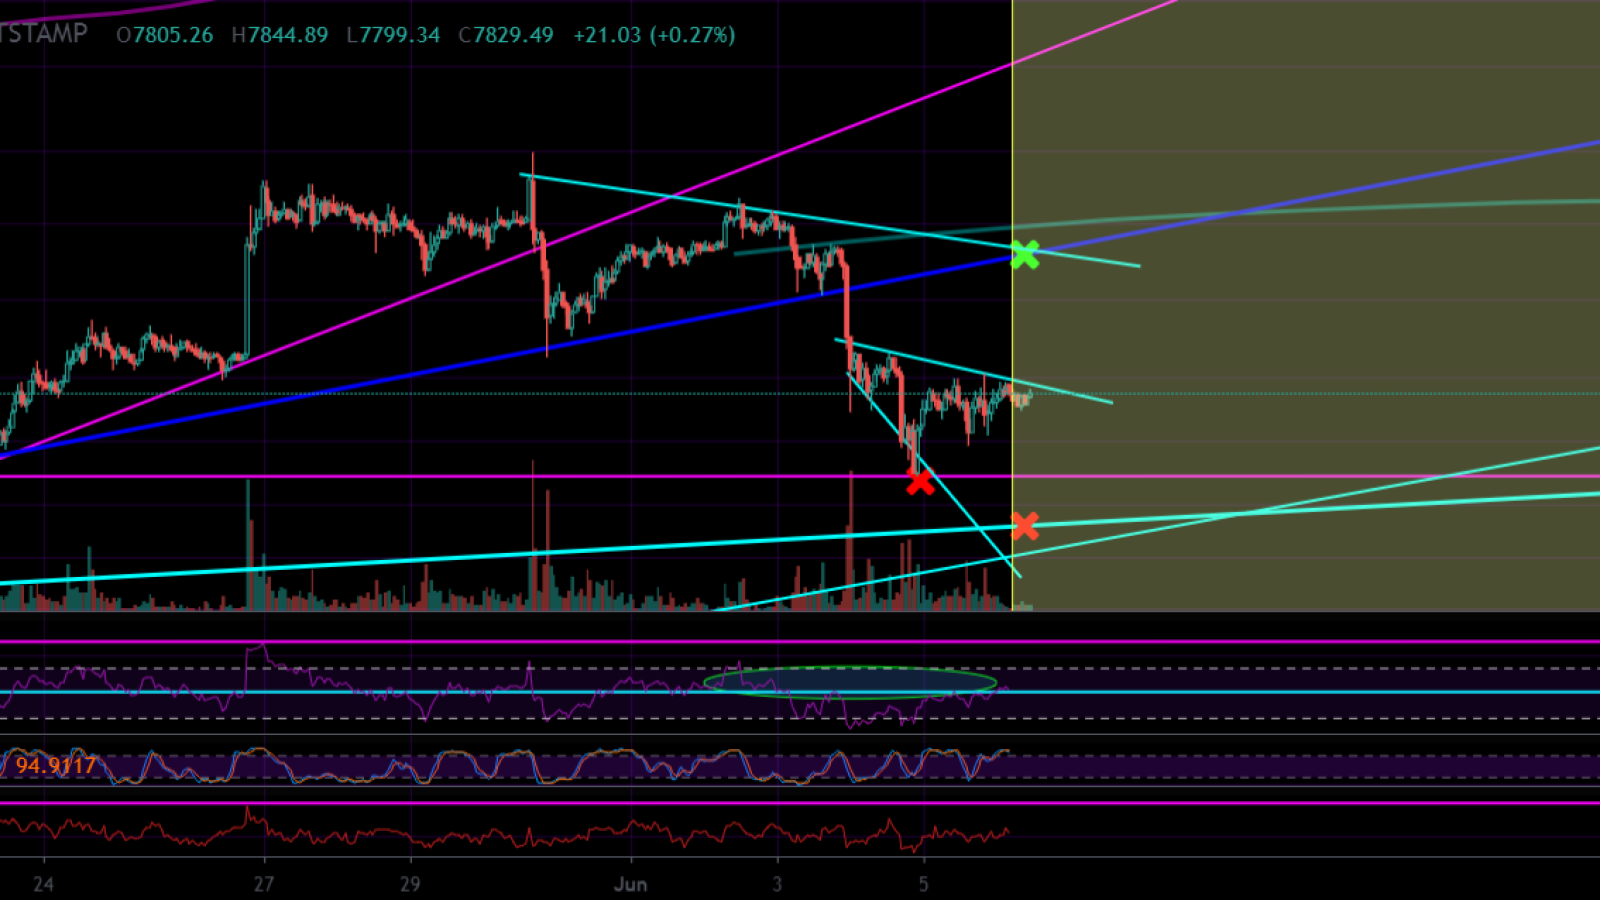
If Bitcoin can continue pushing up here through the short term downtrend, we could actually see some more buyers come in, since the potential for further downside will decrease. In that case, the price could shoot up quickly even towards $8.500. Obviously, if we shoot past that on a volume surge, we could even test the $9K resistance again. However, the volume is still very weak. A continuation of the short term trend is also possible, meaning that we could see a drop towards the next support, around $7.200. Depending on how price and volume reacts if we reach that point, we will have to assess whether or not we've seen the extent of this correction.
Zooming out, you can see that we're still in the light blue bullish channel. Based on this, a longer correction becomes more likely if we break the $6.800-7.200 support zone. If the channel support holds, the uptrend will likely continue after some consolidation.
Final thoughts
Currently, the bulls are attempting to hold the level but BTC lacks volume and strength, which is a negative sign. If Bears continue their downward rally, BTC can go towards $6,700-$6,900. Probably, we should wait for BTC to fall under $7K to replenish the wallet. The consolidation between $7,413.46 and $9,053.12 is possible, and cryptocurrency will pick up momentum above $9,050.
Bitcoin price charts by TradingView