

Bitcoin continues to grow steadily. One can see a sharp rise again, but it failed to consolidate above $13,000.
The last time Bitcoin was located above $12,000 was January 2018, when prices declined amid the start of a downward bearish market. However, today, the situation is different. BTC continues to show impressive results, showing an increase of 40% in June alone, while its annual productivity grew by more than 250%.
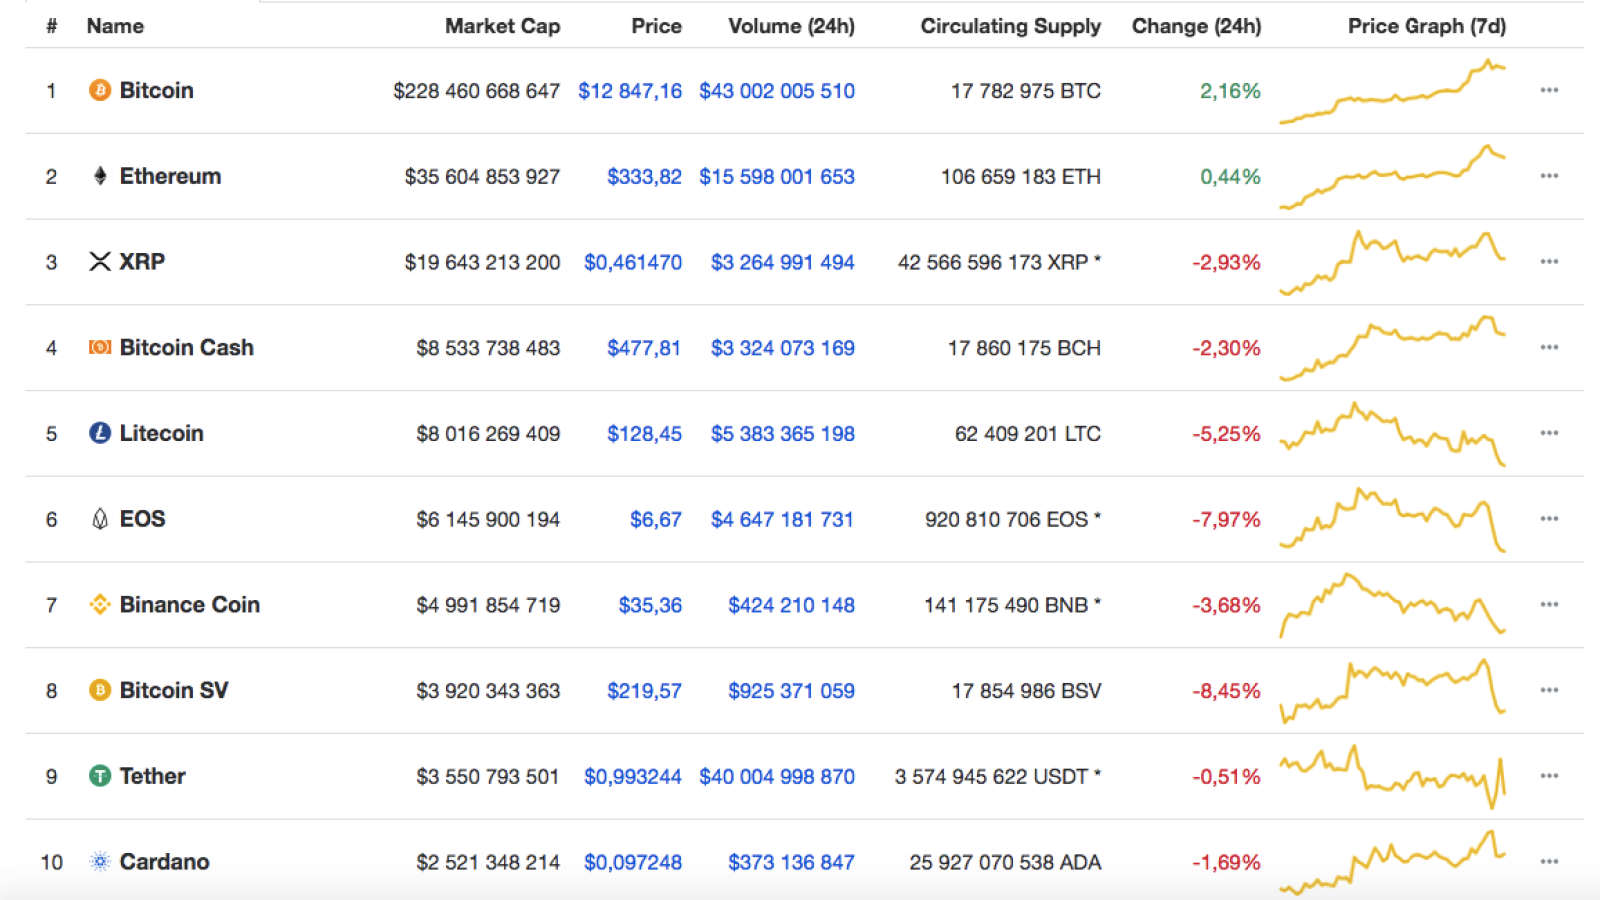
However, altcoins are showing negative trends. If Ethereum, the second largest cryptocurrency capitalization, rose in price to $330, then XRP fell by more than 3% per day.
At the same time, the growth of Bitcoin did not affect Litecoin, EOS, Binance Coin, Bitcoin SV, and Tron – all of them are in the red zone compared to yesterday’s positions.
BTC/USD
The weekly chart details key support and resistance levels at $11,500 and $13,700, respectively, with the result that closing above or below these zones will determine the direction of the trend: either a price rise or a rollback.
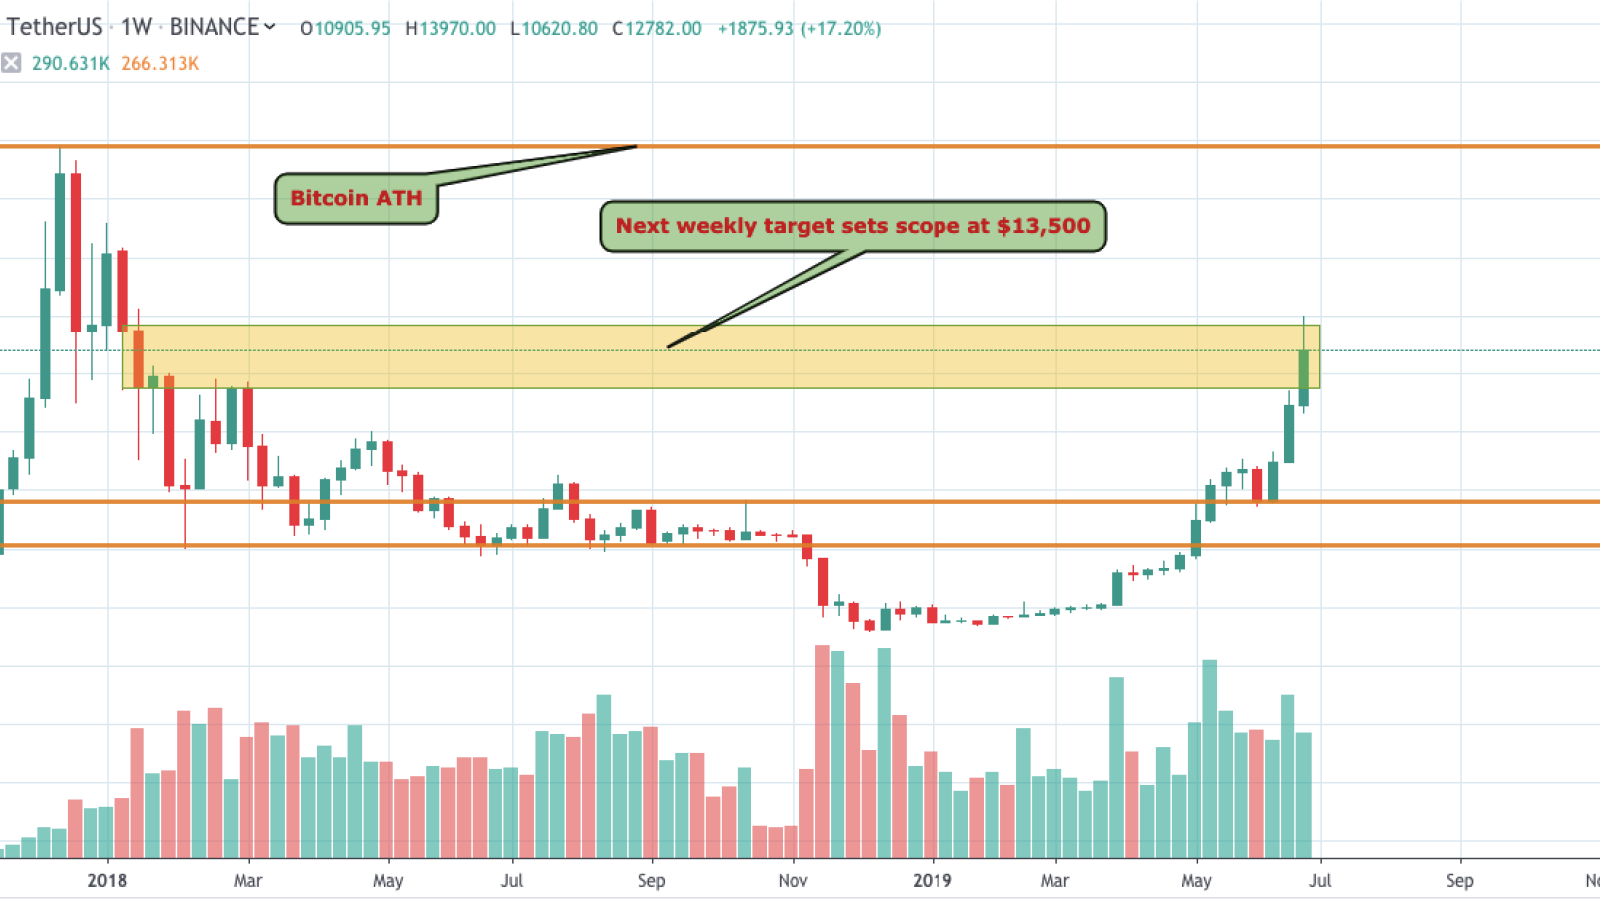
Our scenario for yesterday came true, as the expected rollback below $13,000 occurred. Since the beginning of the new year, there has been strong support for the weekly volume, except for March, when trading volume during the month was below average. This is a good sign for the bulls, as the movements are supported by strong liquidity and traders’ pressure.
If the market conditions maintain their current exchange rate, BTC may aim at a resistance of $13,500 in the coming days. If prices fall below $11,500, then traders should consider re-testing the psychological support zone at $11,000.
The price of BTC is trading at $12,750 at the time of writing.
ETH/USD
Although our Ethereum price forecast has not justified itself yet; the quotes are looking downwards, as we predicted earlier.
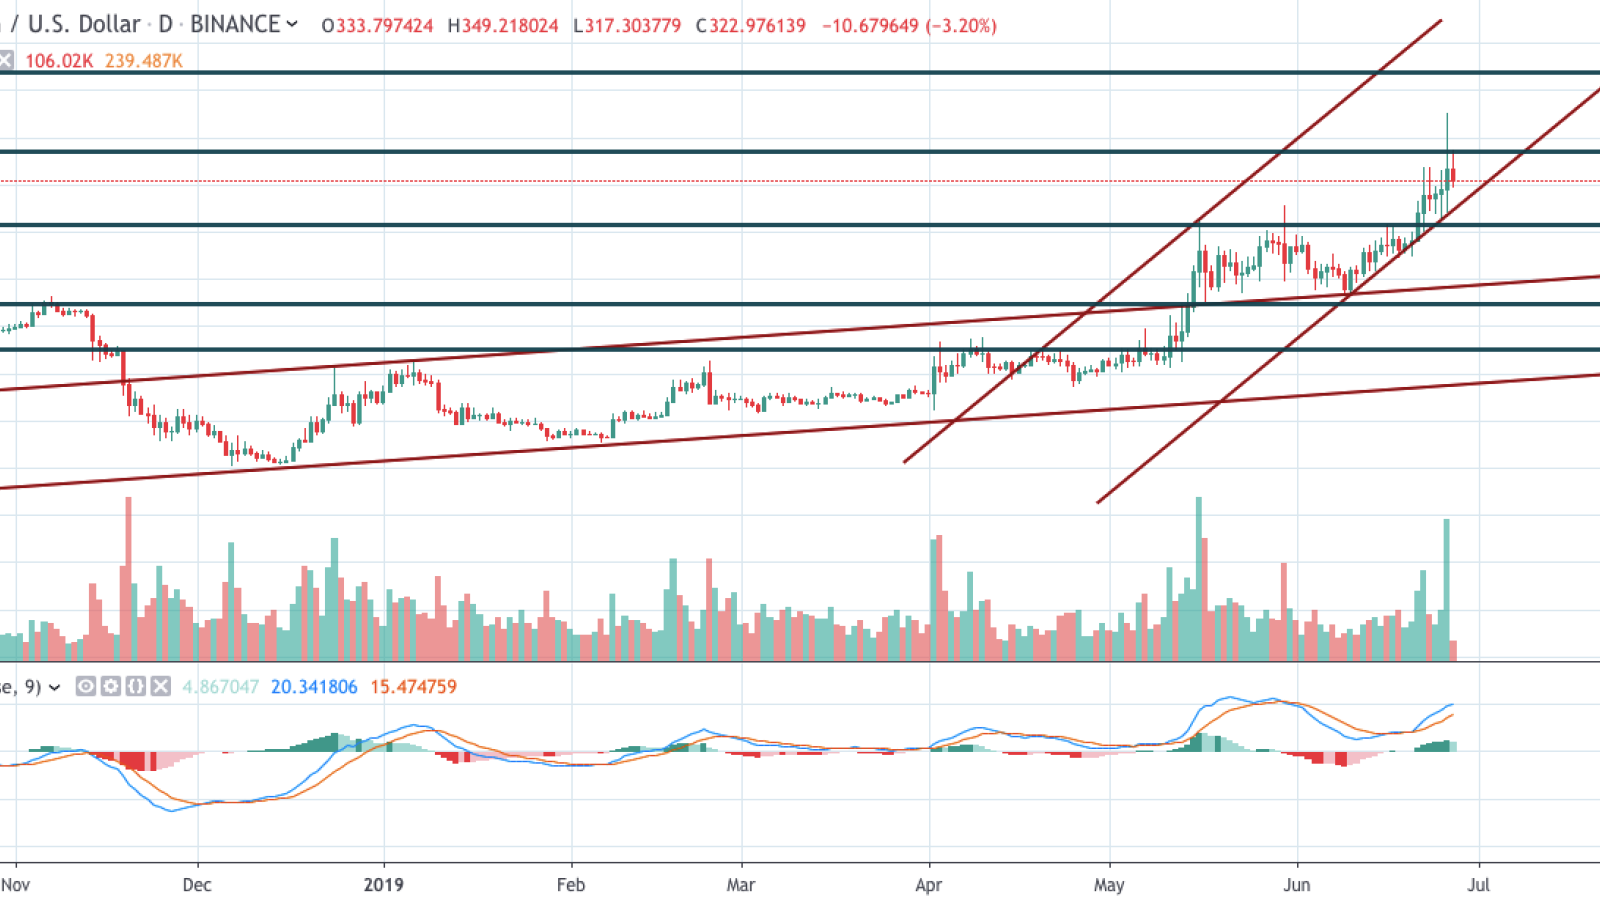
In general, the cryptocurrency continues its growth, and the main idea was to rise by the width of the broken upward channel. As we see, the market has successfully fulfilled such a goal. At the moment, one can expect a decline and a test of the lower limit of the rising channel at $285. After that – continued growth with a potential target of $416. The MACD indicator confirms the long-term bullish tendencies.
The price of ETH is trading at $323.95 at the time of writing.
XRP/USD
Ripple is falling even faster than Bitcoin or Ethereum; its rate has dropped by more than 5% over the last 24 hours.
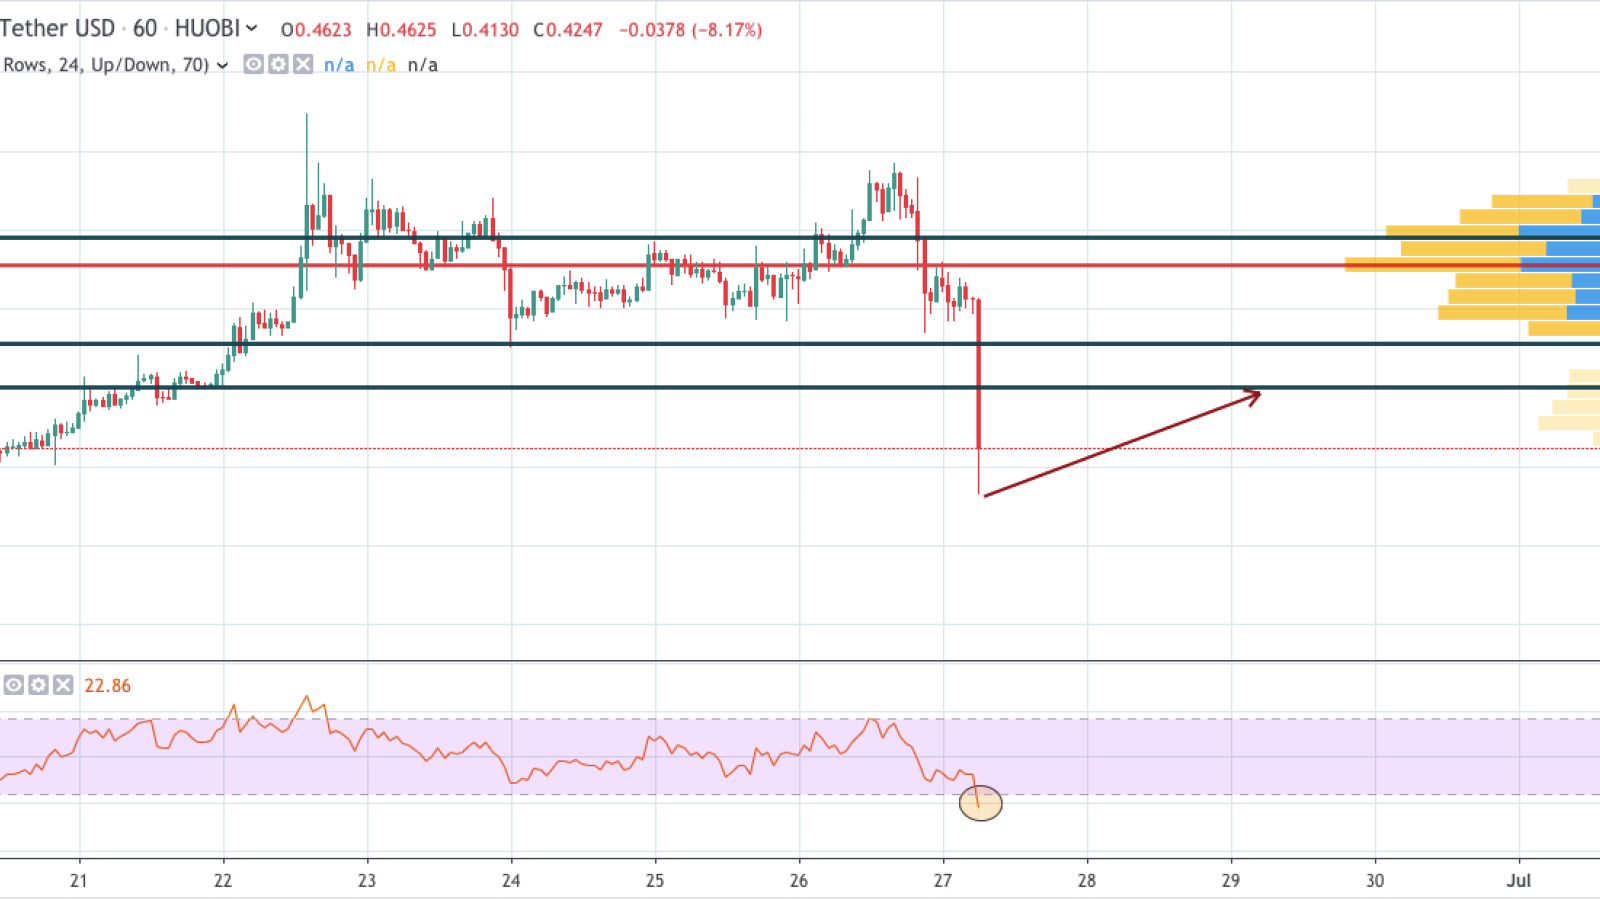
On the hourly chart, the XRP price declined from $0.46 to $0.42 just in 1 hour.
From a technical point of view, the asset has found a bottom, and a bounce back is likely to happen soon. However, one should not expect a fast price rise to previous levels. The nearest support which Ripple may reach is $0.44.
The price of XRP is trading at $0.4269 at the time of writing.