
The recent Bitcoin drop nullified all gains made during the last couple of weeks and demolished any short term hopes of a steady climb above $4,000. The market cap shed $16 billion in a single day, currently standing at $122 billion and BTC/USD is currently testing a critical support level located at 3700.
Chart Analysis – BTC/USD
Last time BTC/USD touched the current level (3700), it recovered swiftly and managed to climb above the 200-period Exponential Moving Average on a 4-hour chart. Price also showed a strong reaction to the level in the past, so it’s safe to say that the way it will behave now will determine the next short to medium term direction.
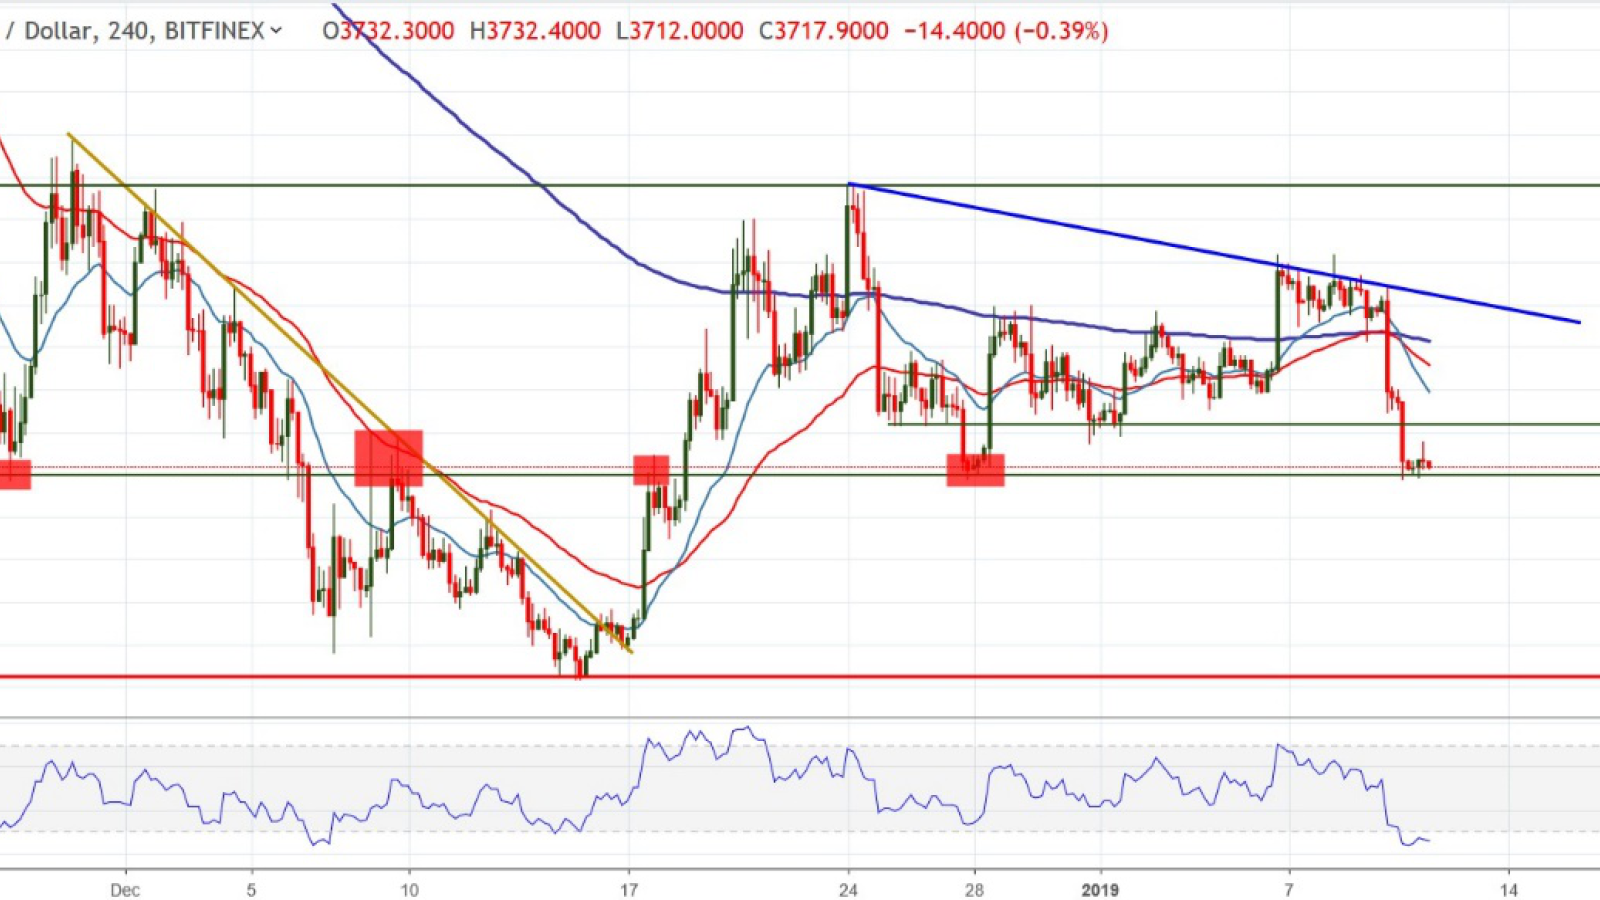
A bounce higher will take the pair above 3820 and possibly into the bearish trend line seen on the chart above. A move above the 200-period EMA will solidify the climb and will probably bring in additional buyers.
On the other hand, a break of 3700 will make 3500 the first target (BRN – big round number) and will open the door for a drop into 3200 area in the longer term. Even if this second target is reached, we will probably see upswings until the price gets there.
Support zone: 3700 (still intact at the time of writing), 3500
Resistance zone: 3820, 200 period EMA and the bearish trend line
Most likely scenario: unclear, depending on how the “bounce or break” scenario plays out
Alternate scenario: low volatility price action, no clear break or bounce