

Disclaimer: The opinions expressed by our writers are their own and do not represent the views of U.Today. The financial and market information provided on U.Today is intended for informational purposes only. U.Today is not liable for any financial losses incurred while trading cryptocurrencies. Conduct your own research by contacting financial experts before making any investment decisions. We believe that all content is accurate as of the date of publication, but certain offers mentioned may no longer be available.
Staying within the $5,200 range, Bitcoin kept traders on the edge of their seats. ‘What will happen next? Should it reach $6,000 or is it doomed to retrace?’ – that’s what many of us asked. TradingView experts rush to answer your questions and come up with Bitcoin price predictions based on their technical BTC price charts. Prepare for surprising discoveries.
Most got it wrong
After the correction, Bitcoin proceeded to move higher – being fueled by the short squeeze which led to another subsequent rally. At the moment, Bitcoin is somewhat tricky. Here’s what we have:
-
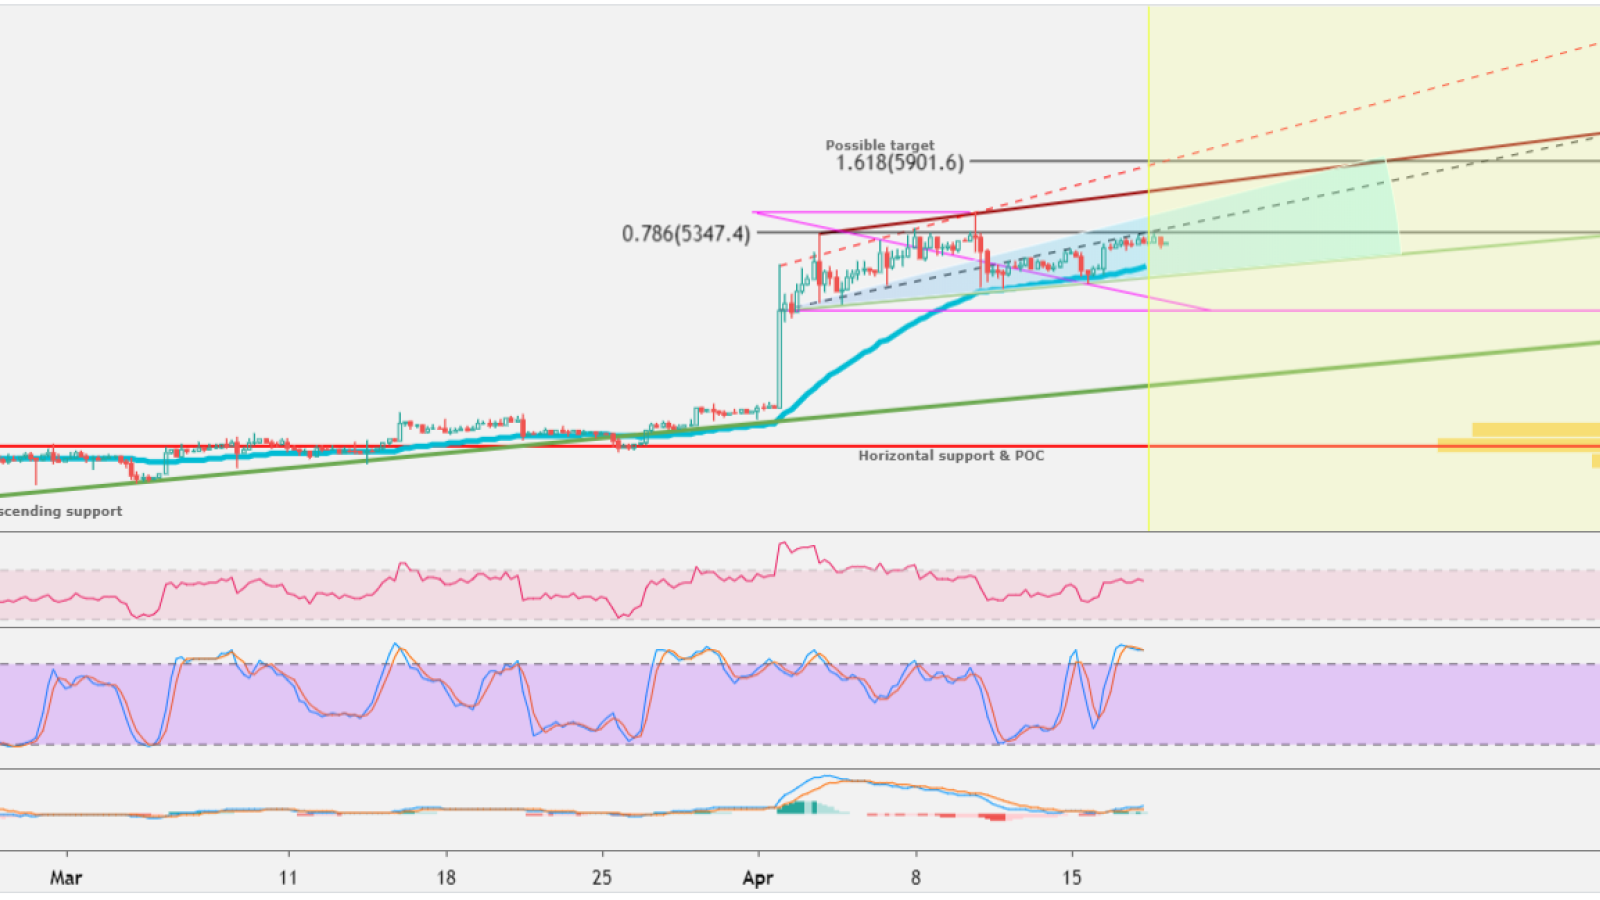
Bitcoin is about to test the .782 retracement level from the recent high counted from the large bullish candle with the first stoppage from that candle – this could be resistive and a trigger for a broader correction.
-
Bitcoin found support at the 50-EMA, as we can see each time Bitcoin dropped below that point, it has moved back above shortly after since 19th of February.
-
According to the Mayer Multiple indicator, BTC hit the bottom a few days ago over 1 – this, however, doesn't mean that we won't see any corrections.
-
Judging by indexes, we have 77/24 Bullish to Bearish sentiment.
The current pattern of Bitcoin could be a bullish ascending-broadening wedge which very well could target the $5,900 level (1.618 extensions). For this we need to test the $5,600 level, the top of the ascending resistance, this seems to be a progress Bitcoin is working on right now.
According to the volume profile (bars on the right side) we can see that the $5,000 level has been established as a support and holds a decent buying interest as of now. If this level would fall we could see a sharp decline in price as levels between $5,000 and $4,000 hold little to no support as of now. $4,000 remains the stronger level for buying interest.
Card: Forget About Satoshi. Mysterious Miner Dubbed ‘Patoshi’ Allegedly Has 1 Mln Bitcoins
5th Elliot wave flushes the BTC market
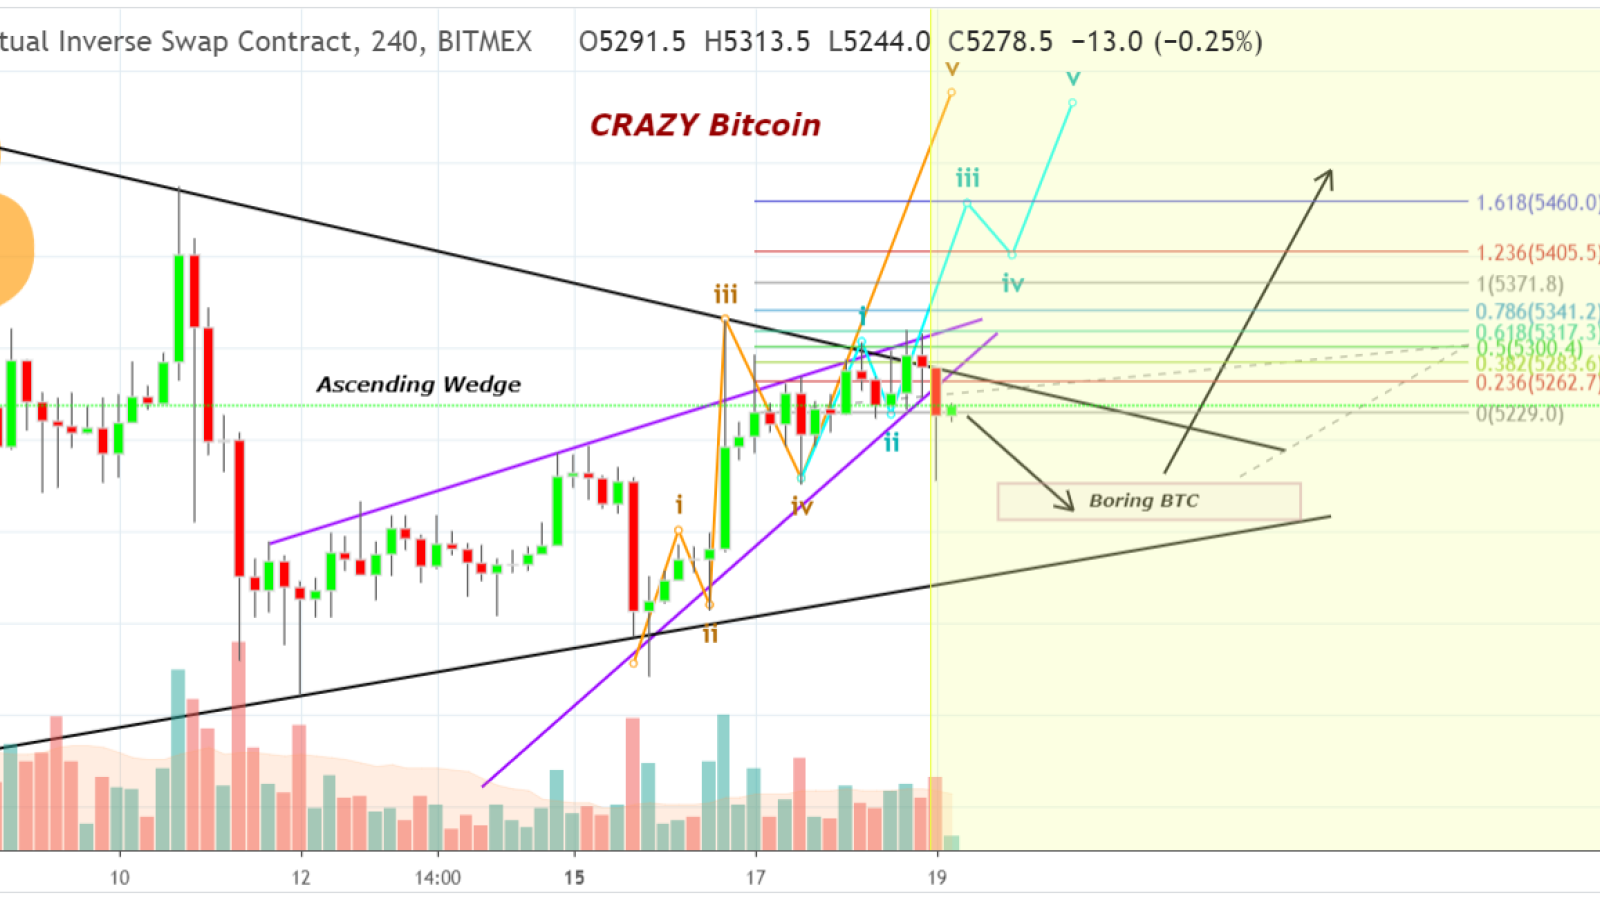
Here we have an ascending wedge, which normally would mean that BTC is to go down. And it is definitely a possibility! However, Bitcoin might have a different hidden plan. It has escaped the down line, and take a close look – Bitcoin might soar and make a 5th Wave Extension!
So we have 2 scenarios according to D4rkEnergY:
-
BERSERK-version which up via my Elliott Waves (traders can make a LONG position with a stop loss below the wedge).
-
Fail in case the first option fails. Anyway, we will go up after this event.
Card: John McAfee Says He Knows True Satoshi Identity, Promises to Reveal It Soon
Bears never sleep
Despite positive forecasts, no one denies that Bitcoin also has a pretty bearish setup. So, what are the indicators of bearish trends?
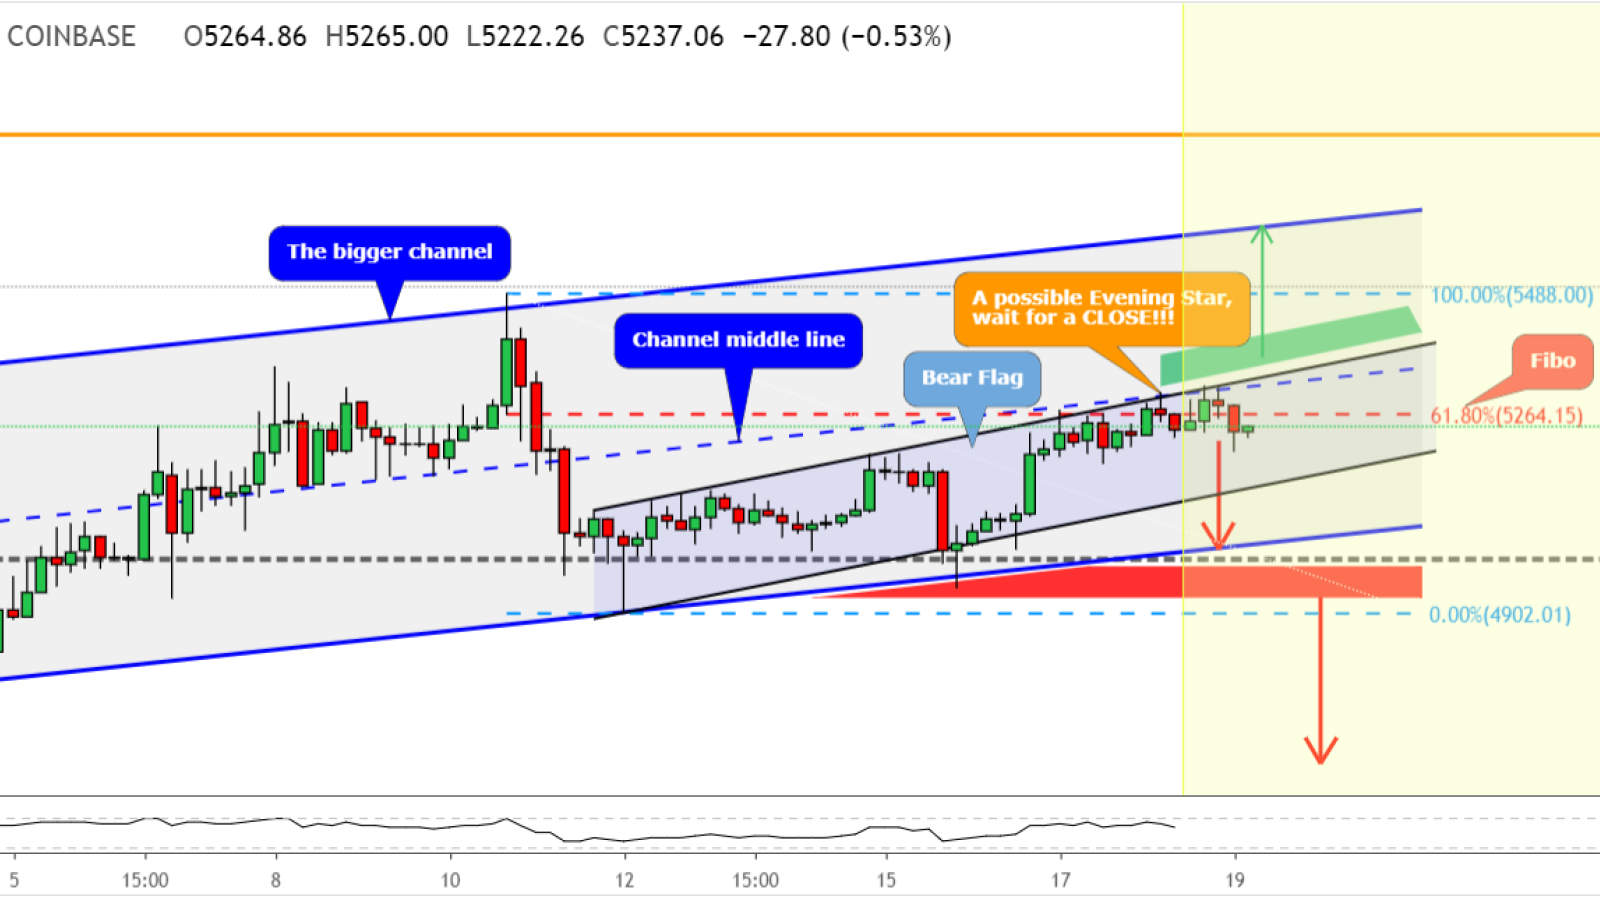
Firstly, as you see, there is an ascending channel inside of the ascending channel. The smaller, which has black trendlines and inside it is a little bit blueish, we can call it also a Bear Flag. This flag is too long and it doesn't work after the breakout as it should be. Currently, everything is fine and we can count this as a Bear Flag but okay, enough of it and let's start to count those bearish signs/criteria on the current level could possibly drive the price back down, they are:
-
Fibonacci retracement level 61.8%, known also as a golden ratio, and we all know how well the BTC chart has reacted after the golden ratio touch.
-
Bear Flag upper trendline works as a resistance (black line). It has several rejections downwards from the upper trendline and so as now, plus they make a crossing area with mentioned Fibonacci level.
-
The bigger channel middle trendline (blue dotted line) has worked as a support level and now it has worked also as a resistance level. We got a rejection from the crossing area a few hours ago and now those three criteria are on the same price level, so, pretty strong area at $5,300.
-
EMA100 on the Weekly chart is located exactly just above the current price (current price is $5,241), EMA100 is at $5,251. It should work as resistance and this matches exactly with our crossing area.
The best possible scenario is a current 4H candle close to around $5,230, then we have pretty solid candlestick formation which also indicates that the market may make a move downwards.
If we get a rejection downwards from the current level and the price falls into the red area, then this area is still a pretty big bearish confirmation area. Then we have a breakout downwards from the bigger channel, from the smaller channel, from the head and shoulders pattern, and we got a break below the round number $5,000.
Thus, we can see that despite Bitcoin’s great current price, there are many bearish signals, so we should be prepared that it might take a nosedive anytime.
Bitcoin price charts are taken from TradingView